-
-
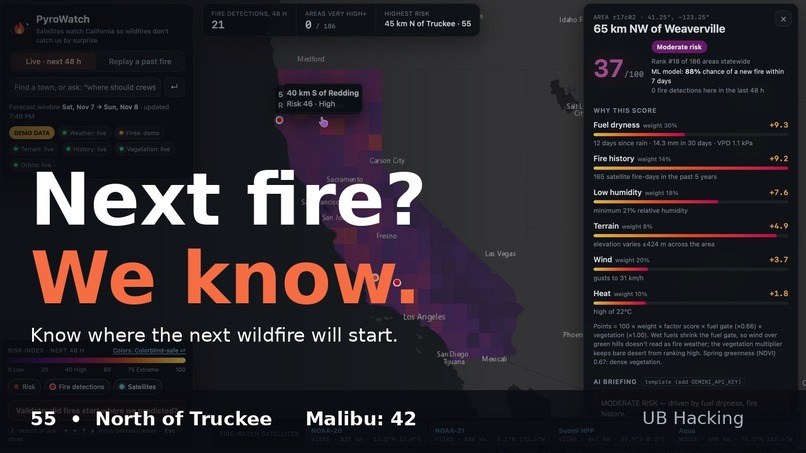
Intro page
-
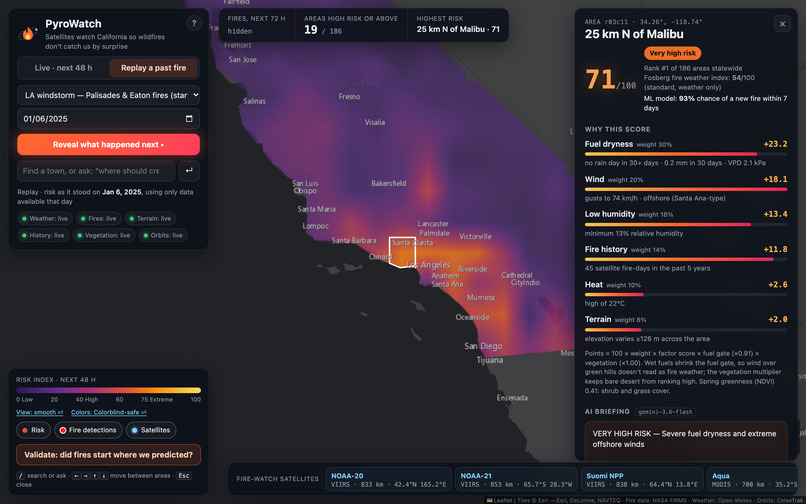
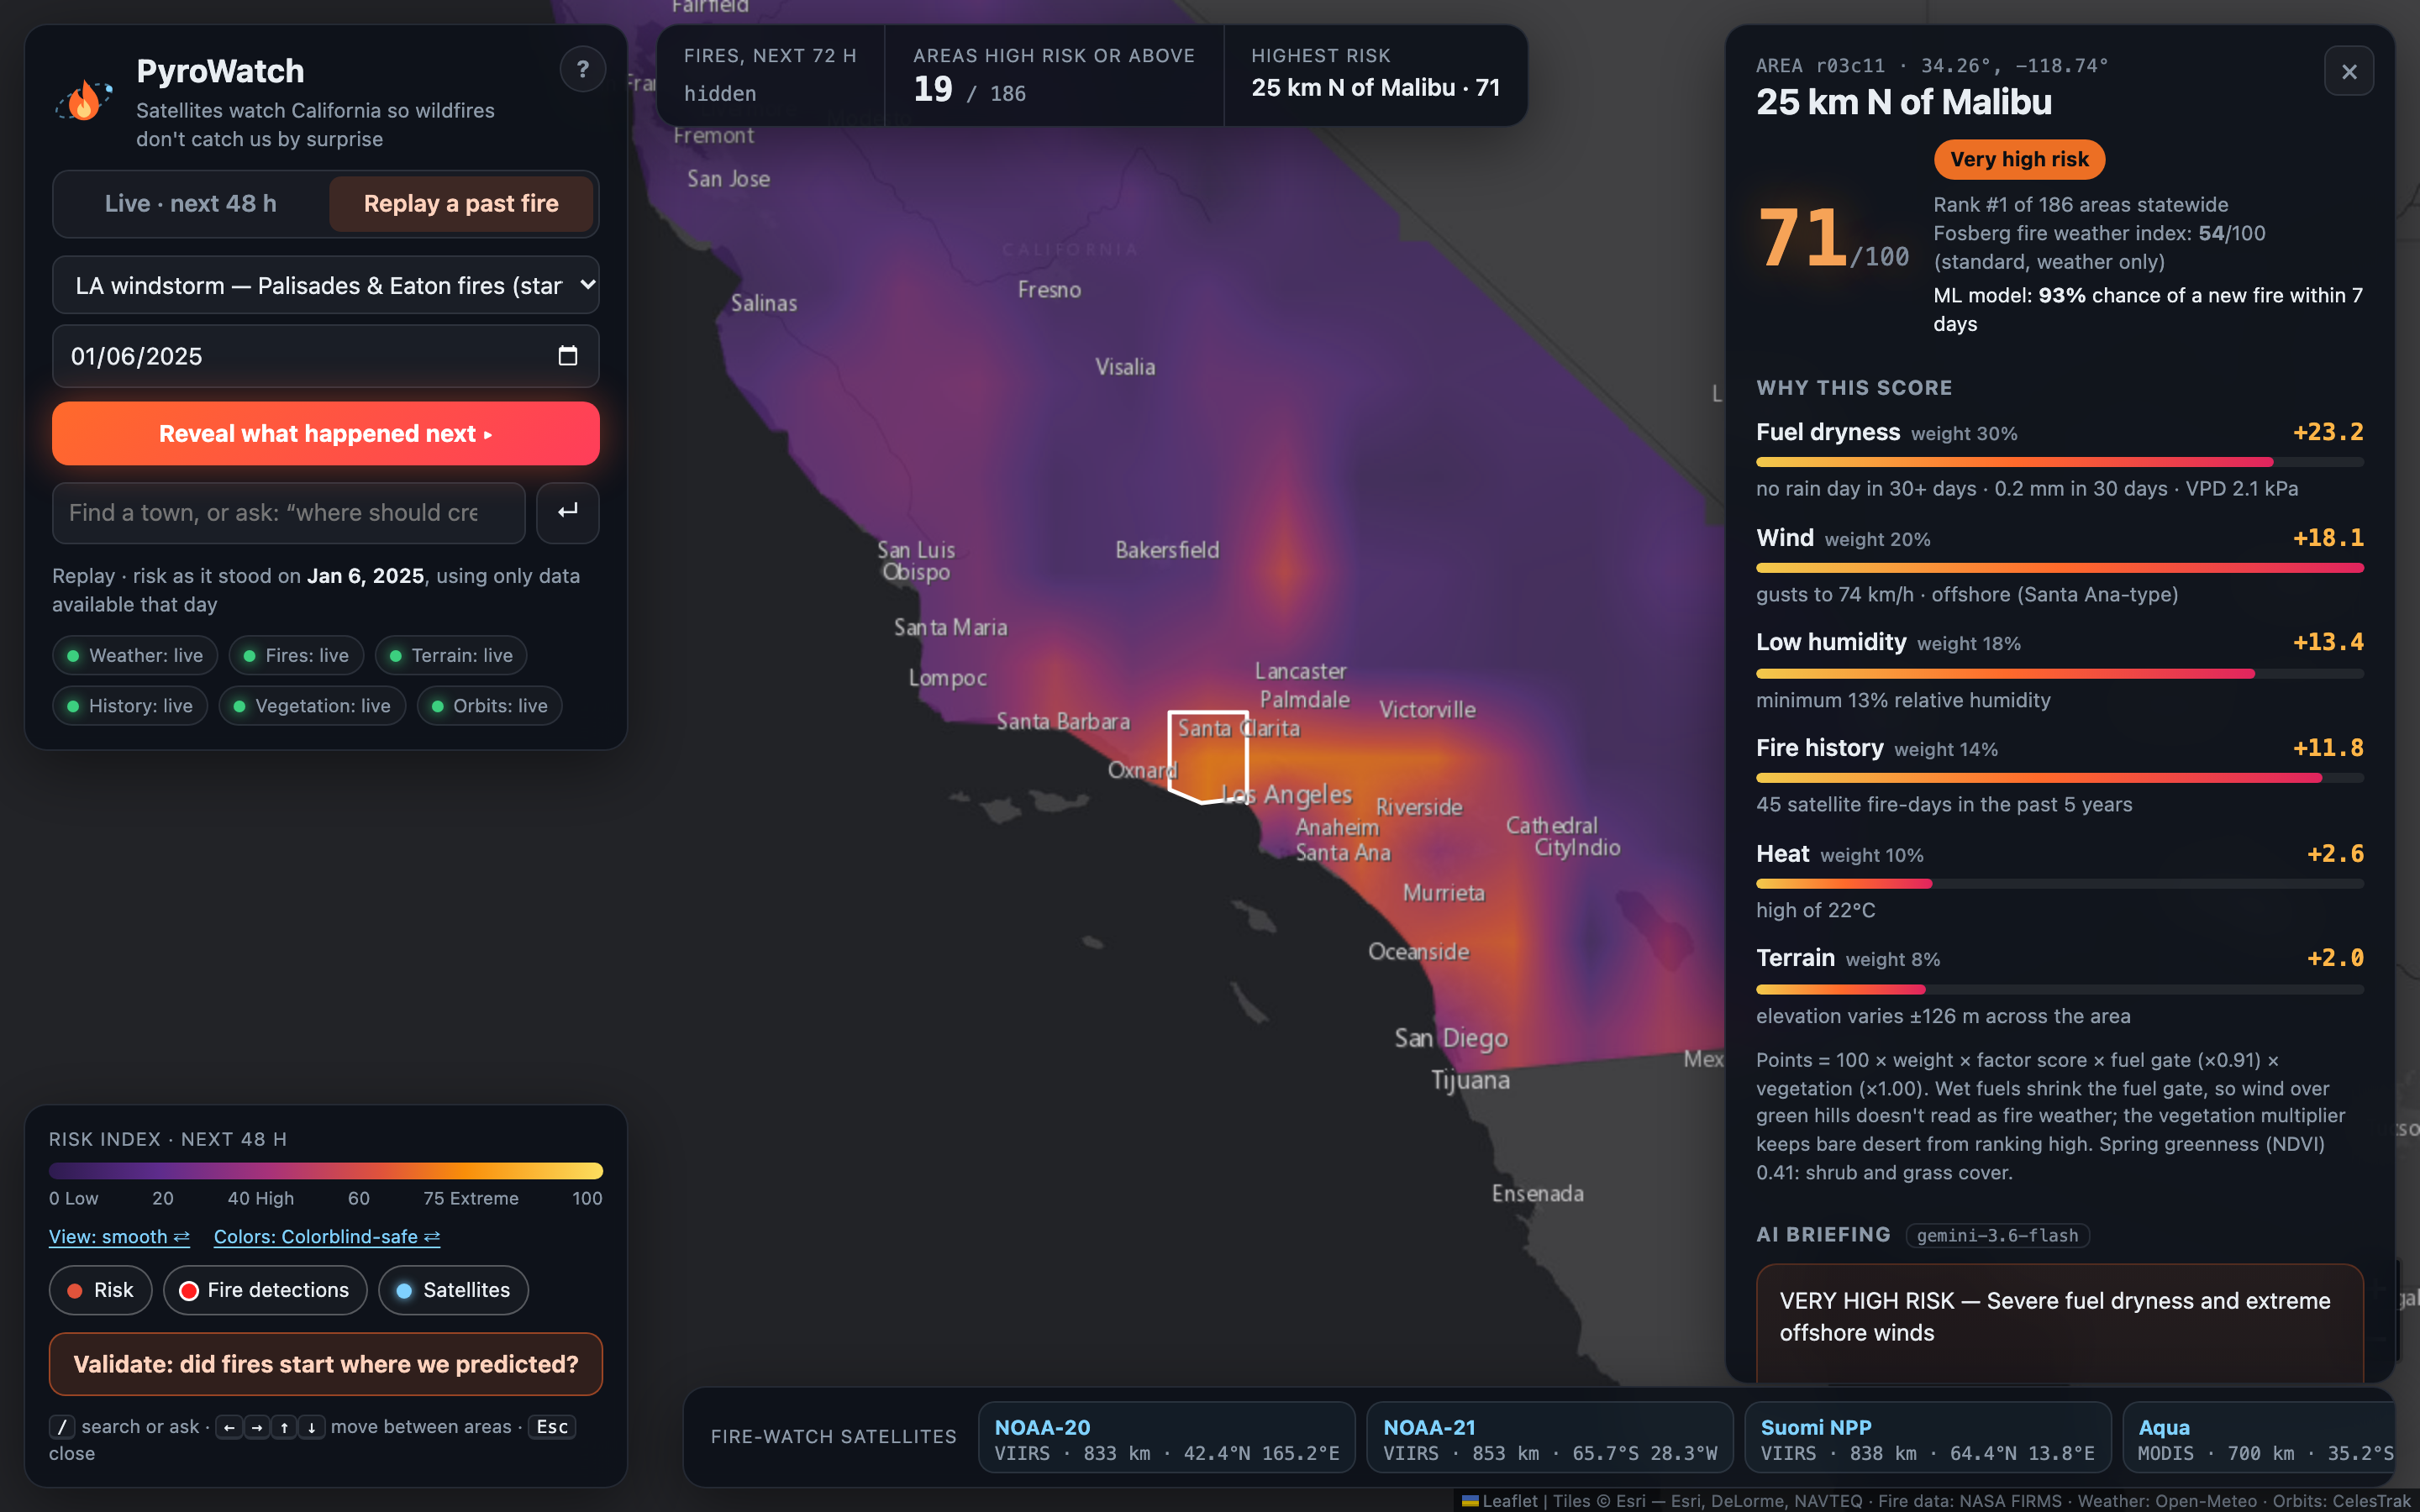
The day before the LA fires: using only data available that day, PyroWatch ranked the area where the Palisades Fire started #1 of 186.
-
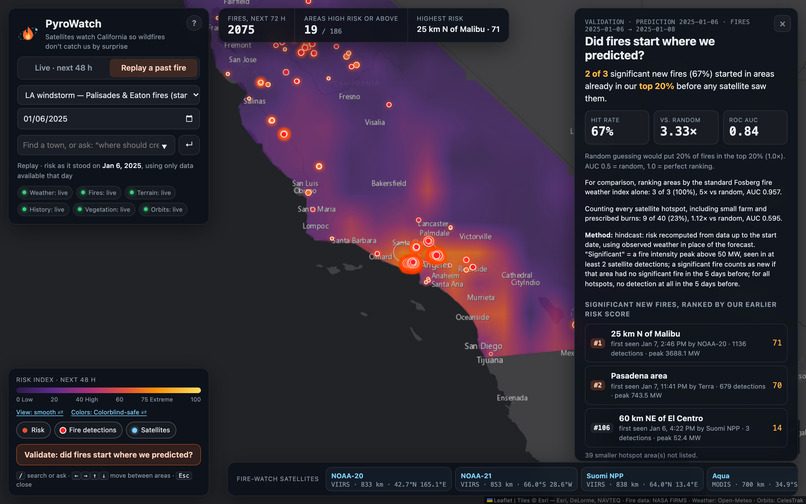
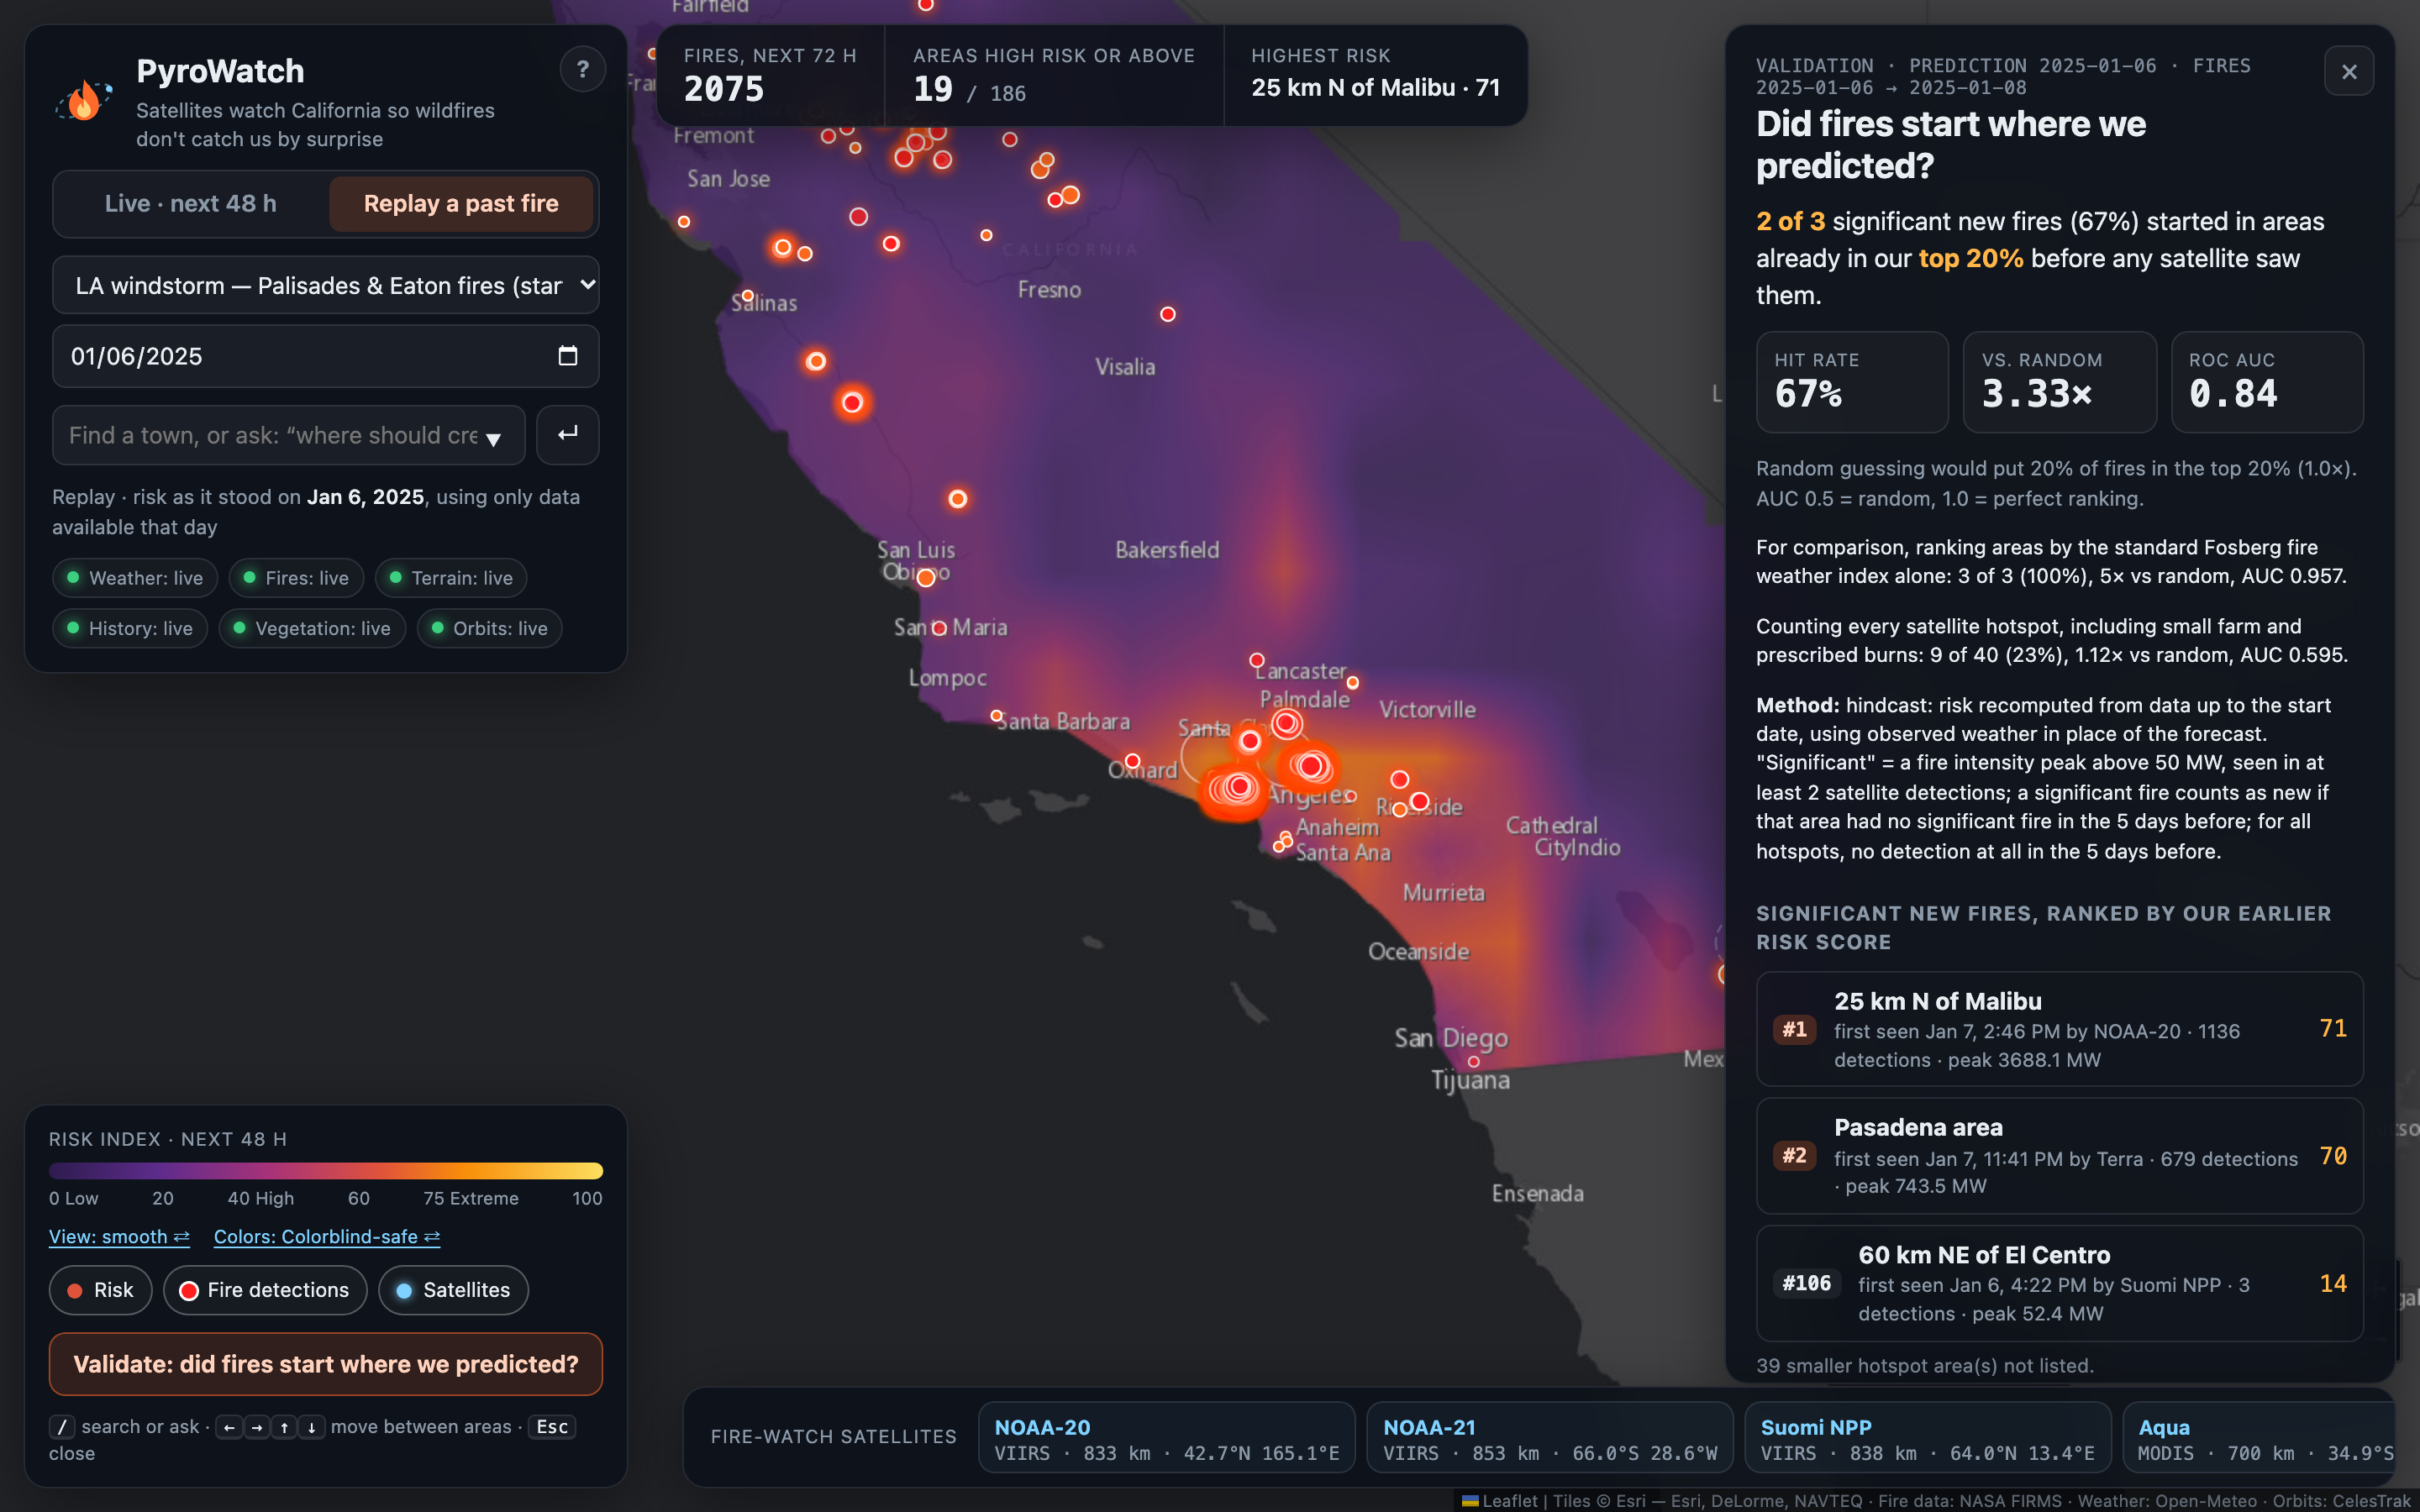
Reveal what satellites saw burn next: 2 of 3 significant new fires started in our top 20% (3.3× better than random, ROC AUC 0.84).
-
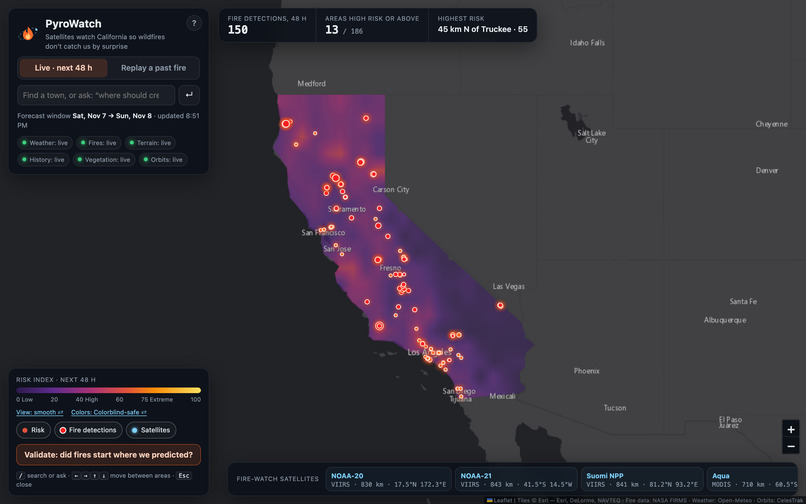
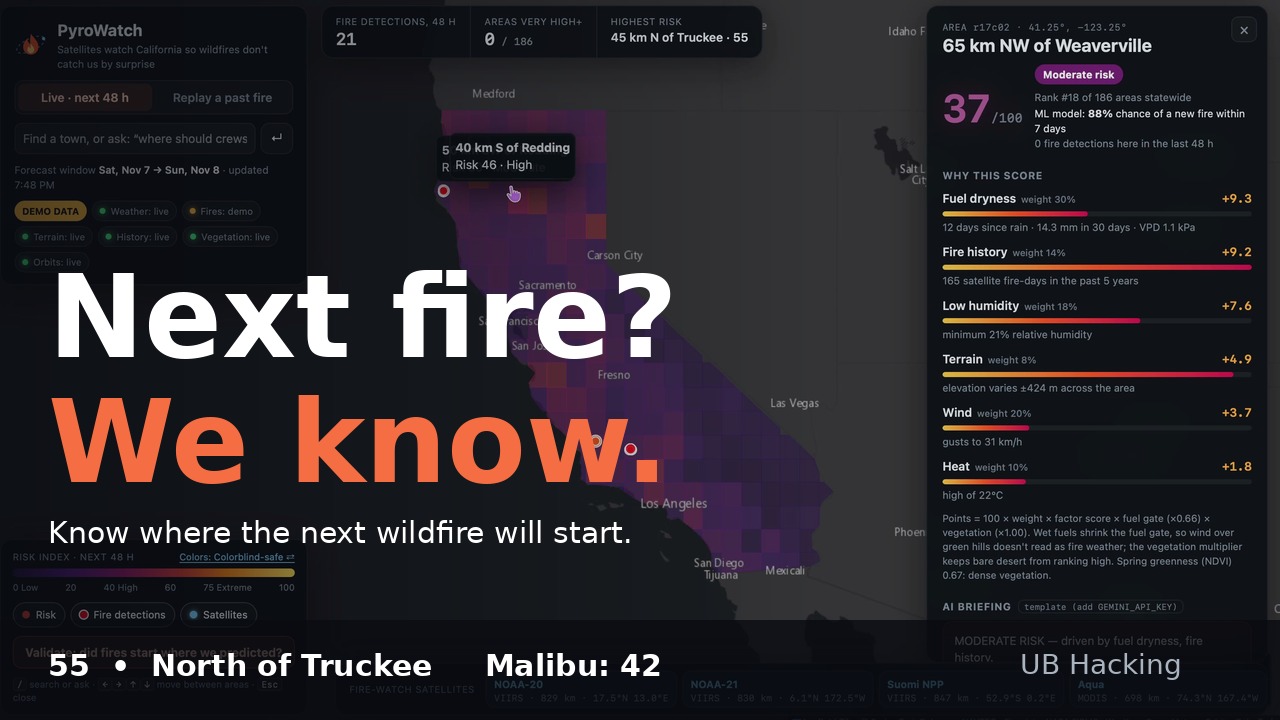
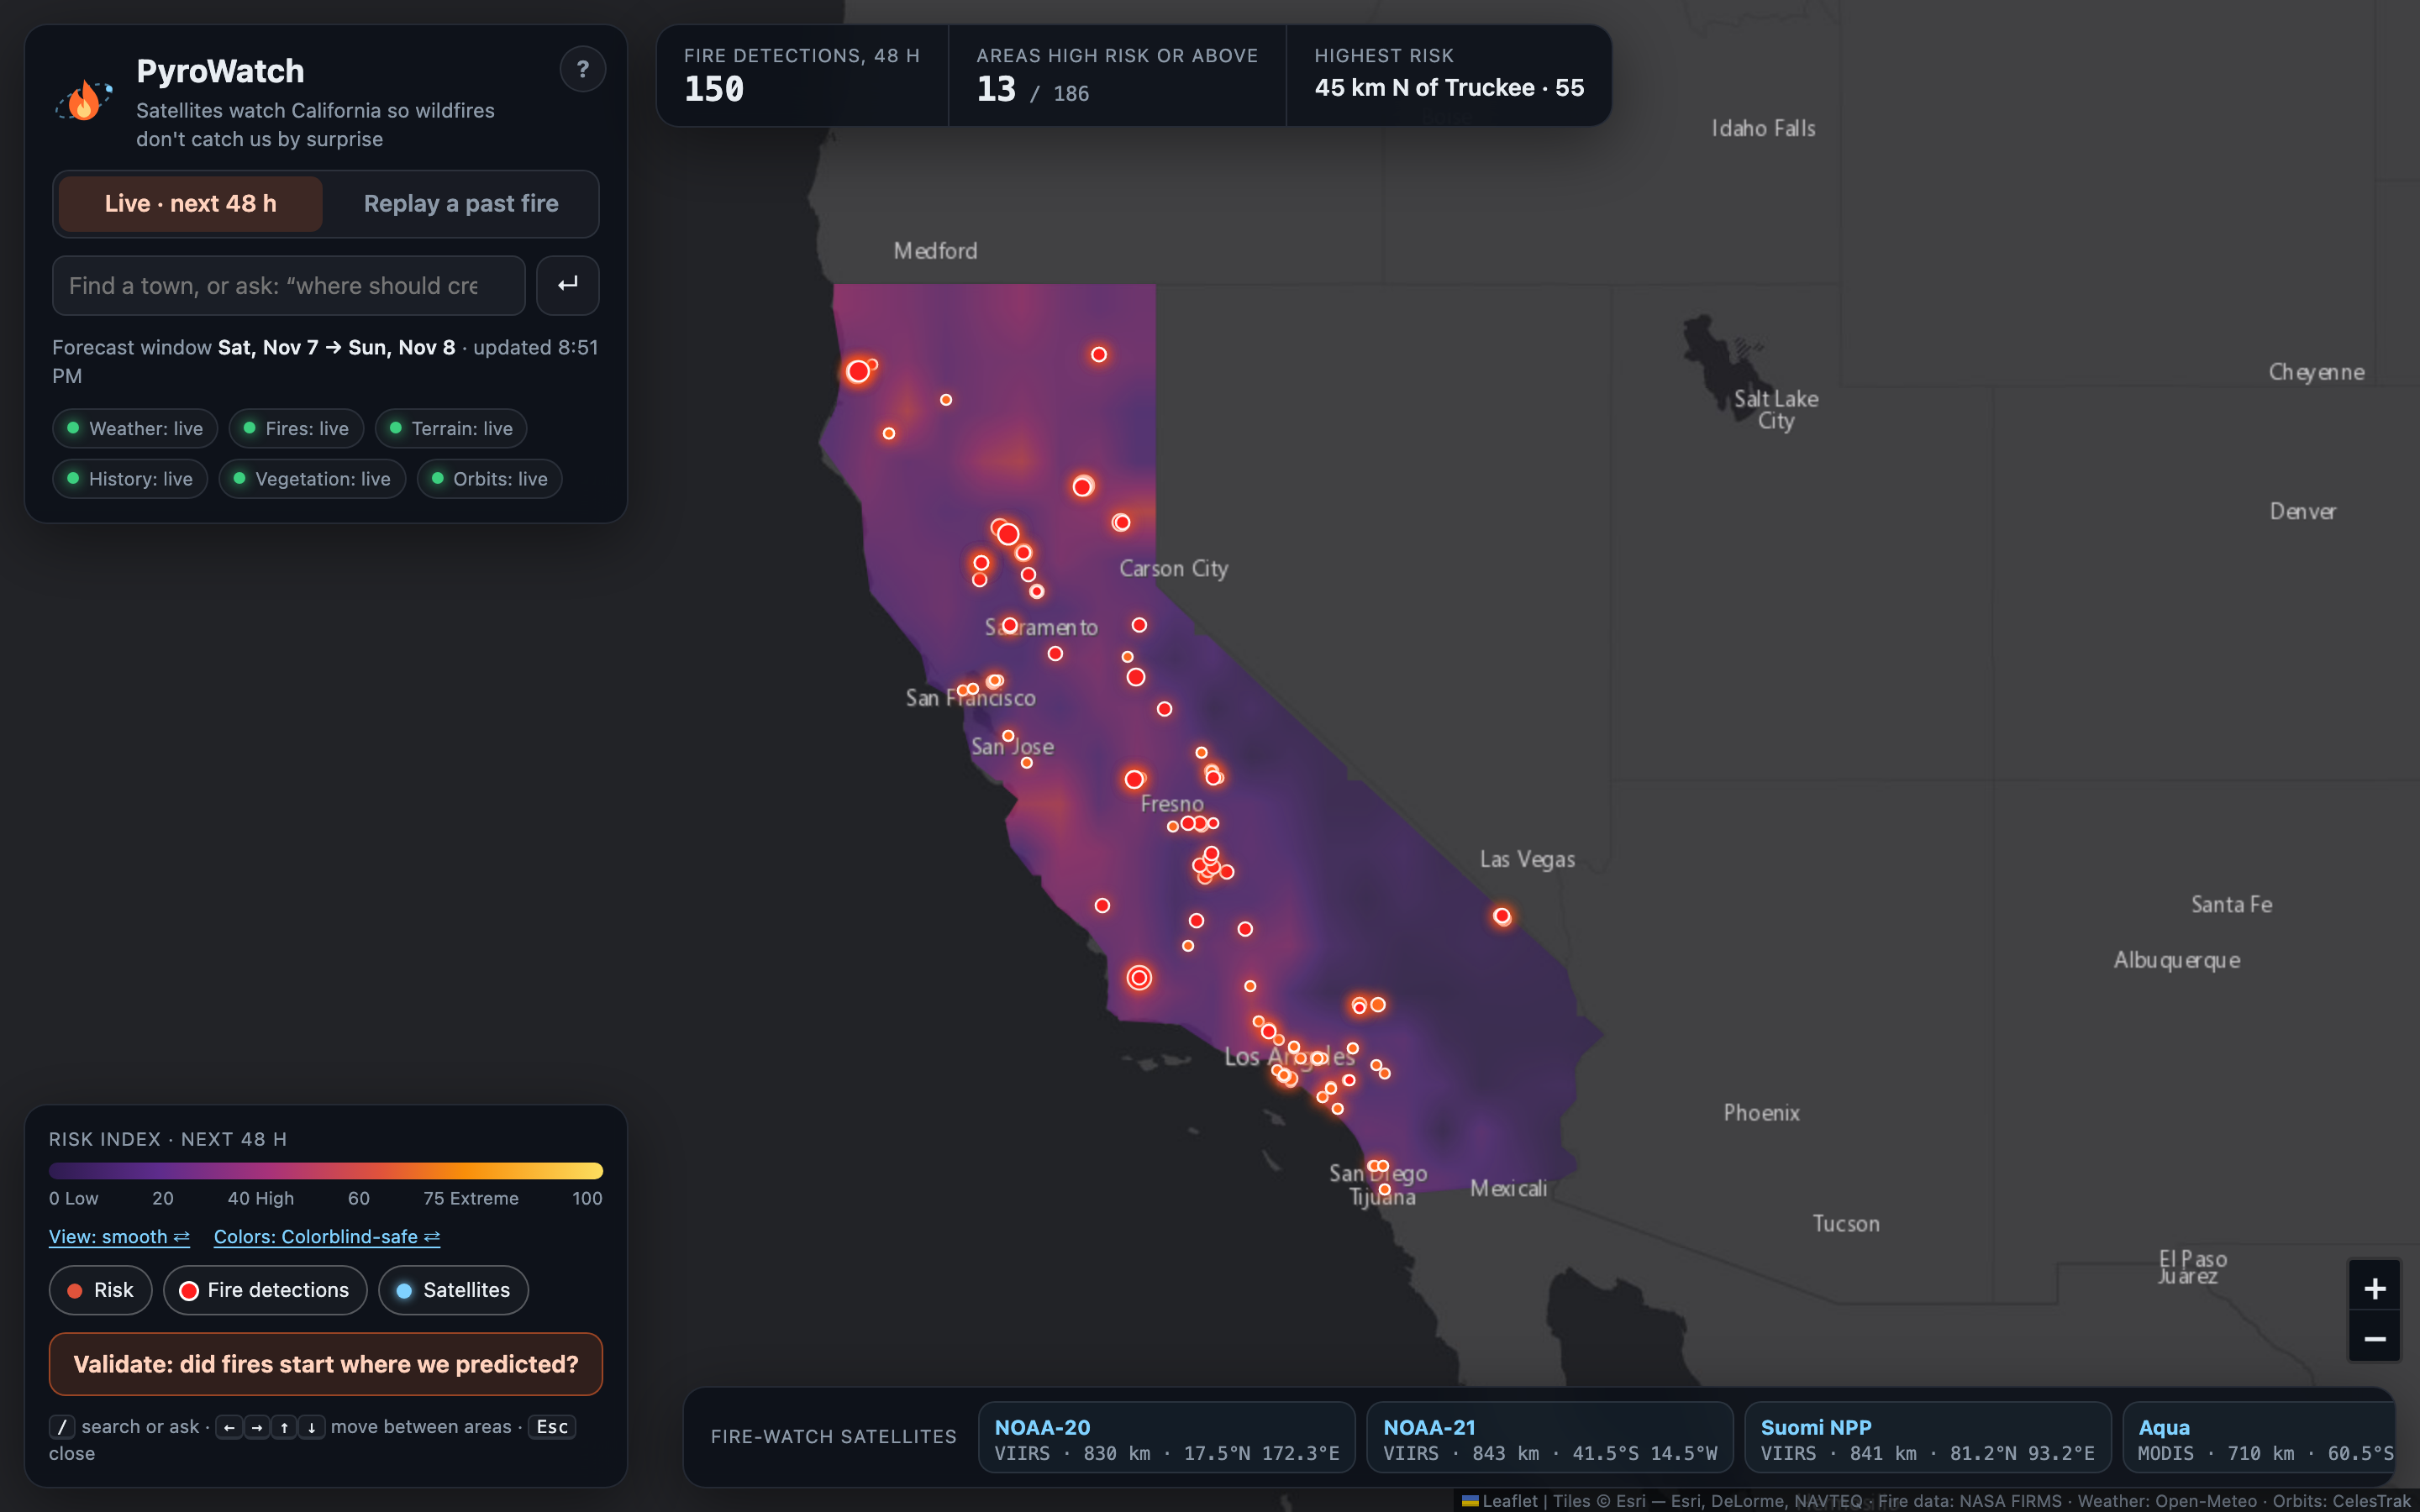
Live 48-hour wildfire risk for all 186 areas of California, with NASA satellite fire detections.
-
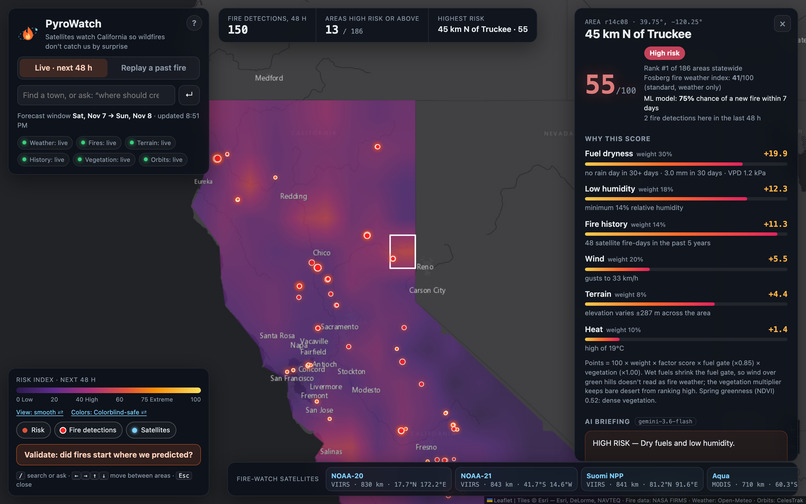
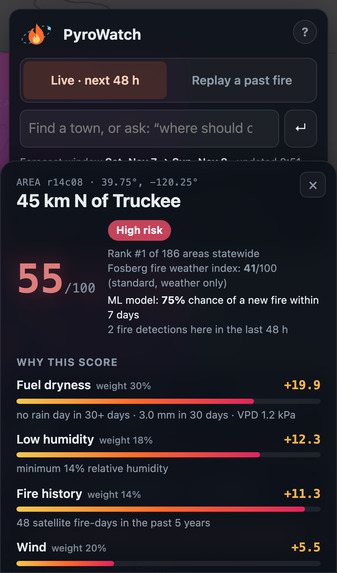
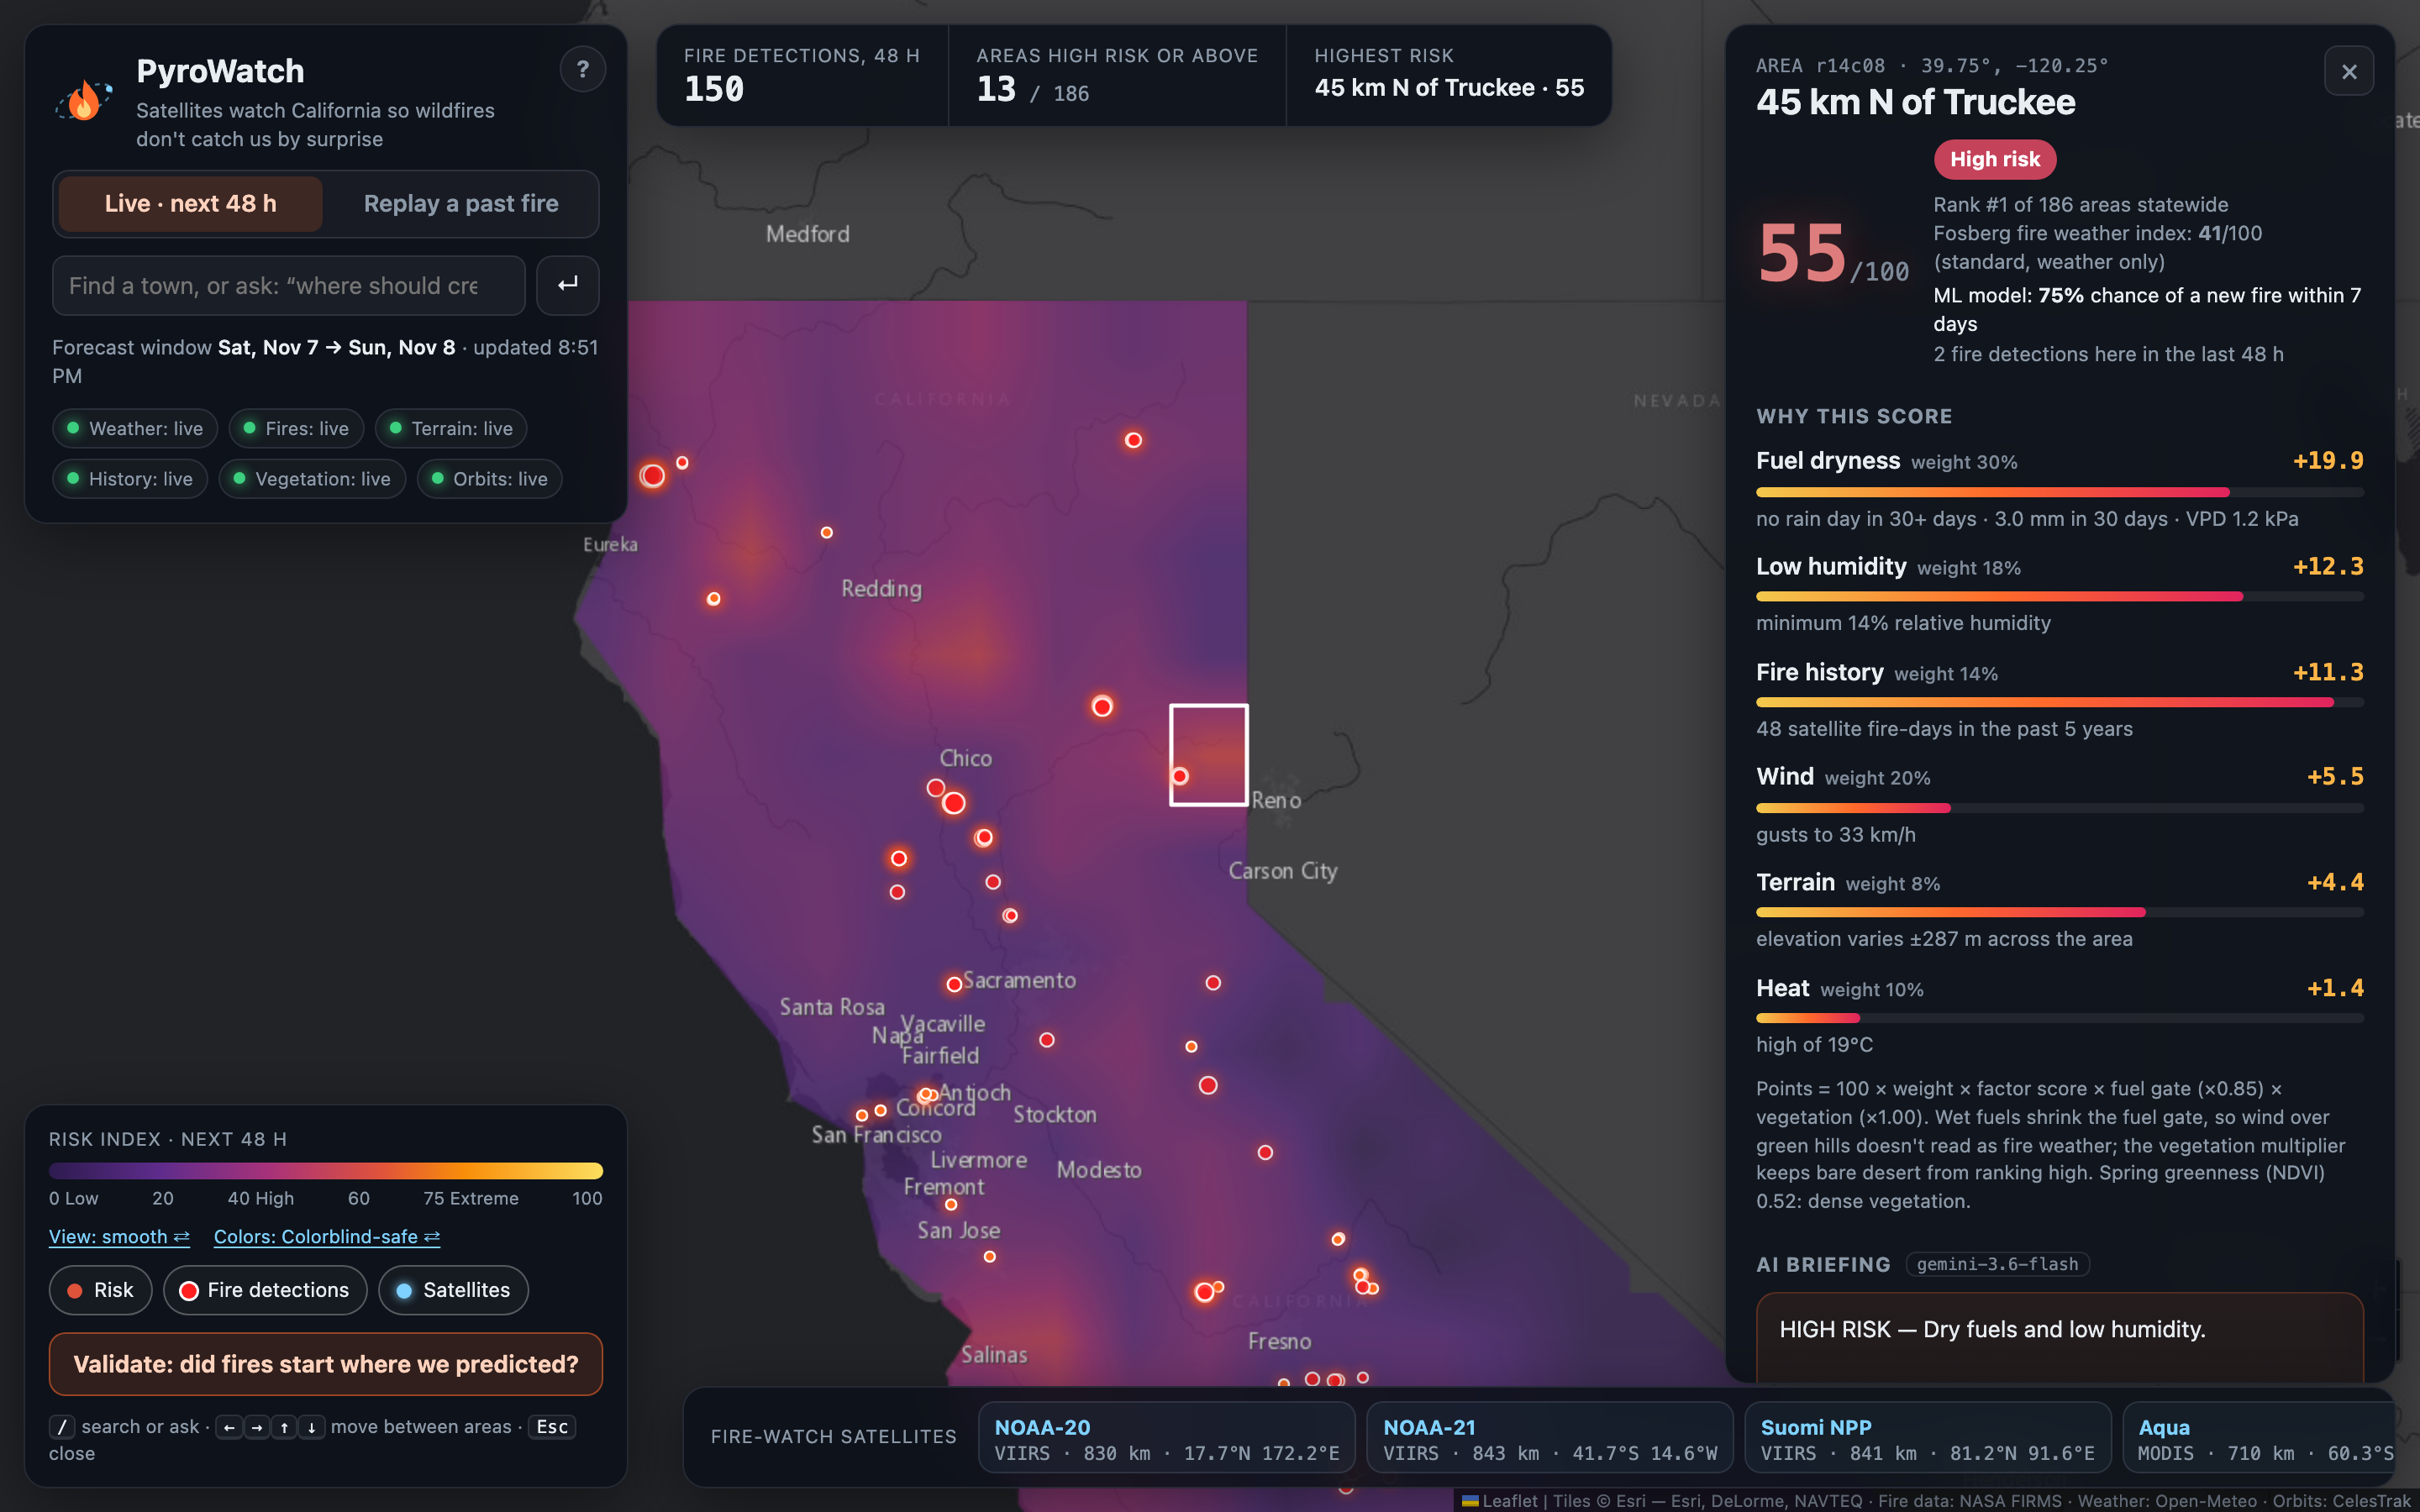
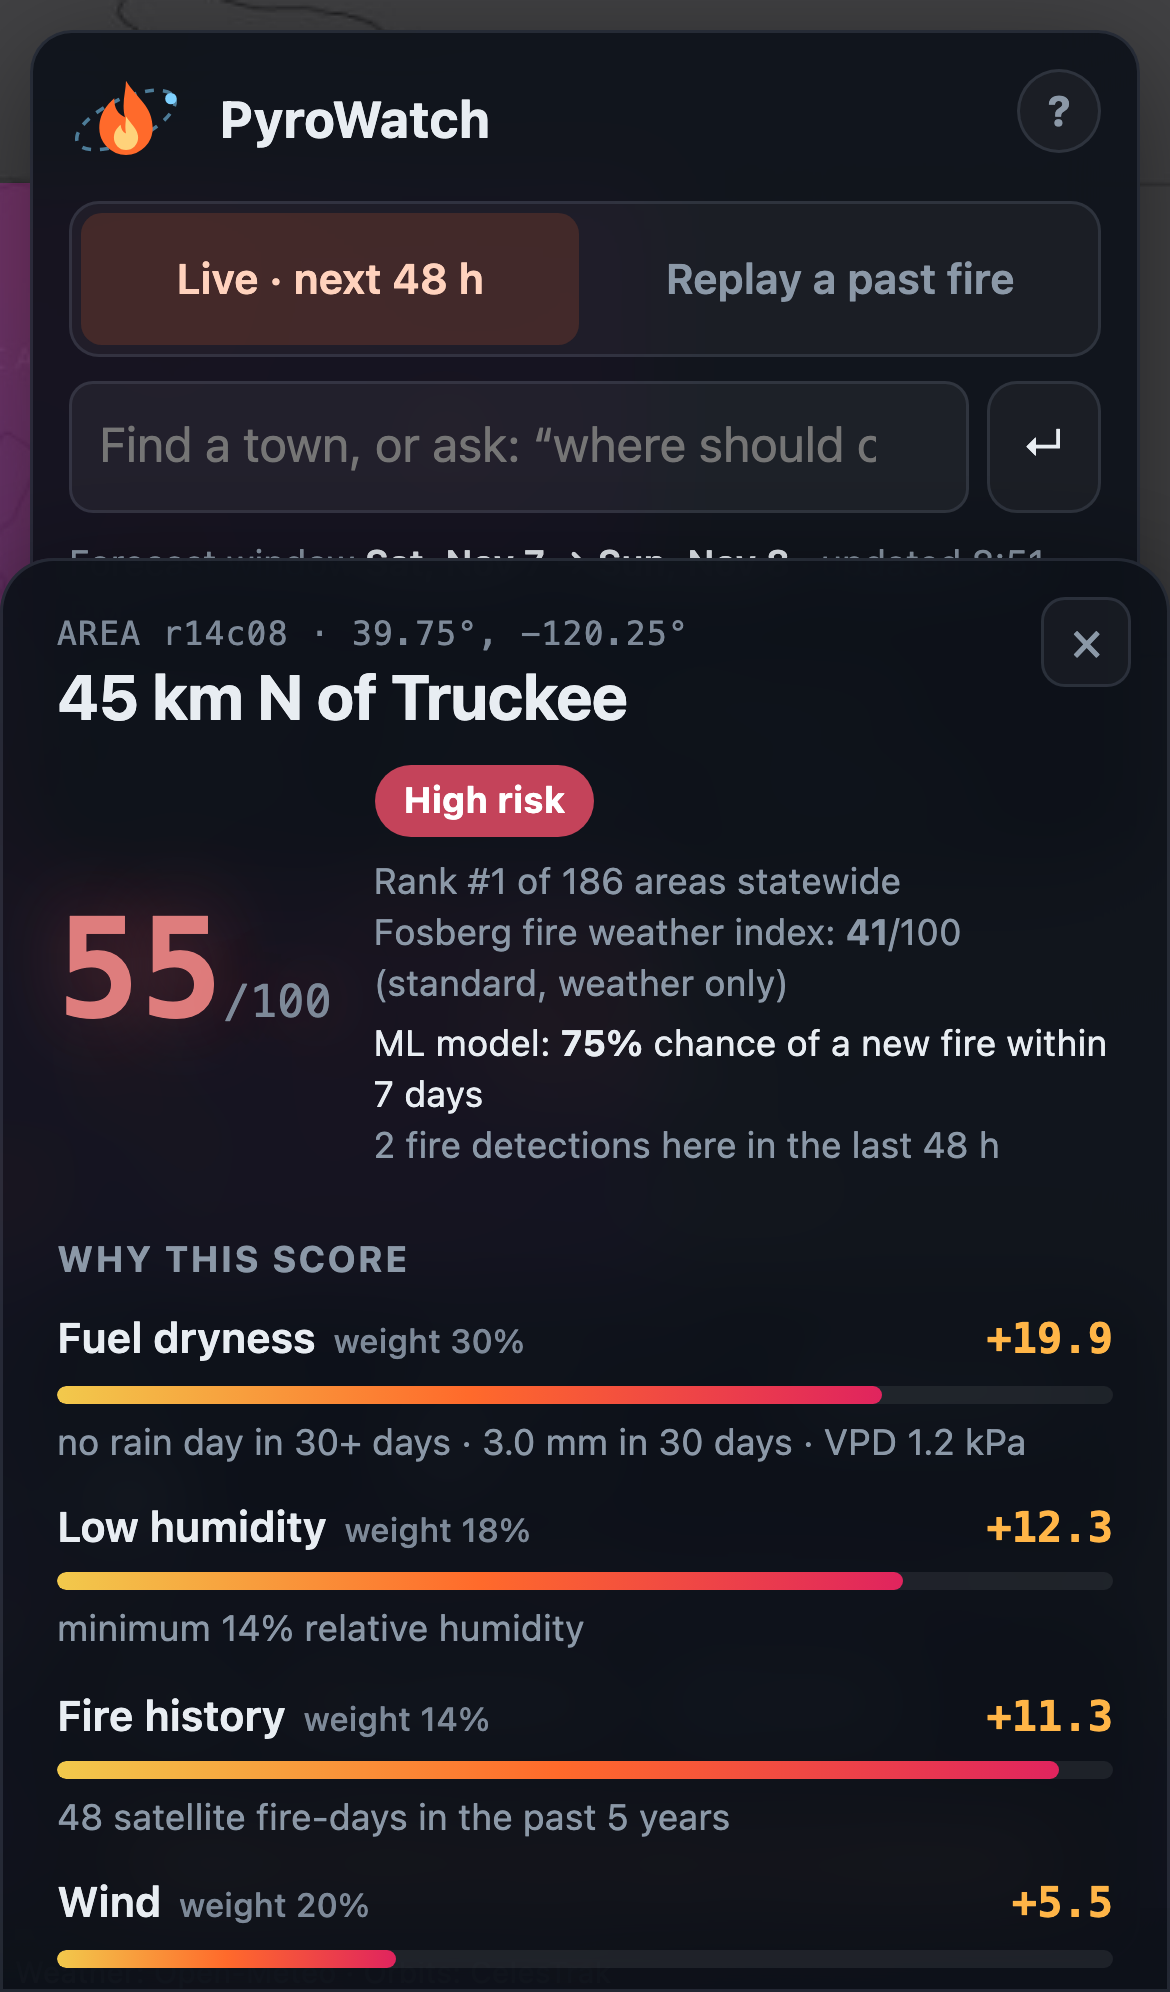
Every score shows its work: points per factor, the Fosberg index, and the trained model’s 7-day fire probability.
-
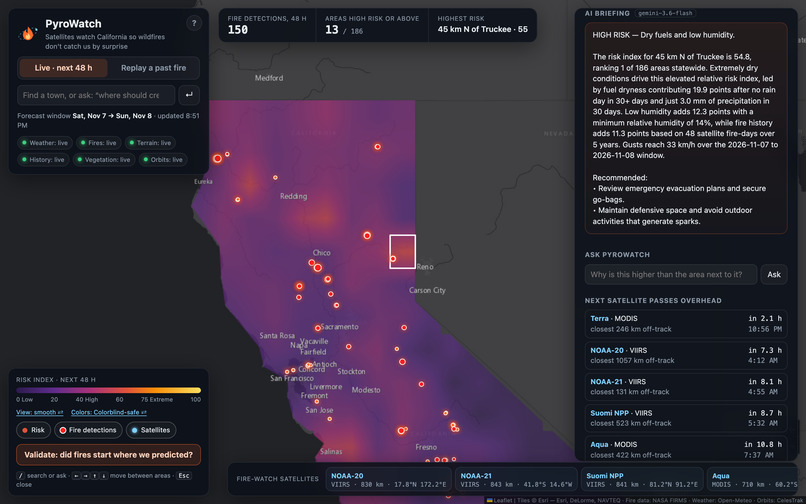
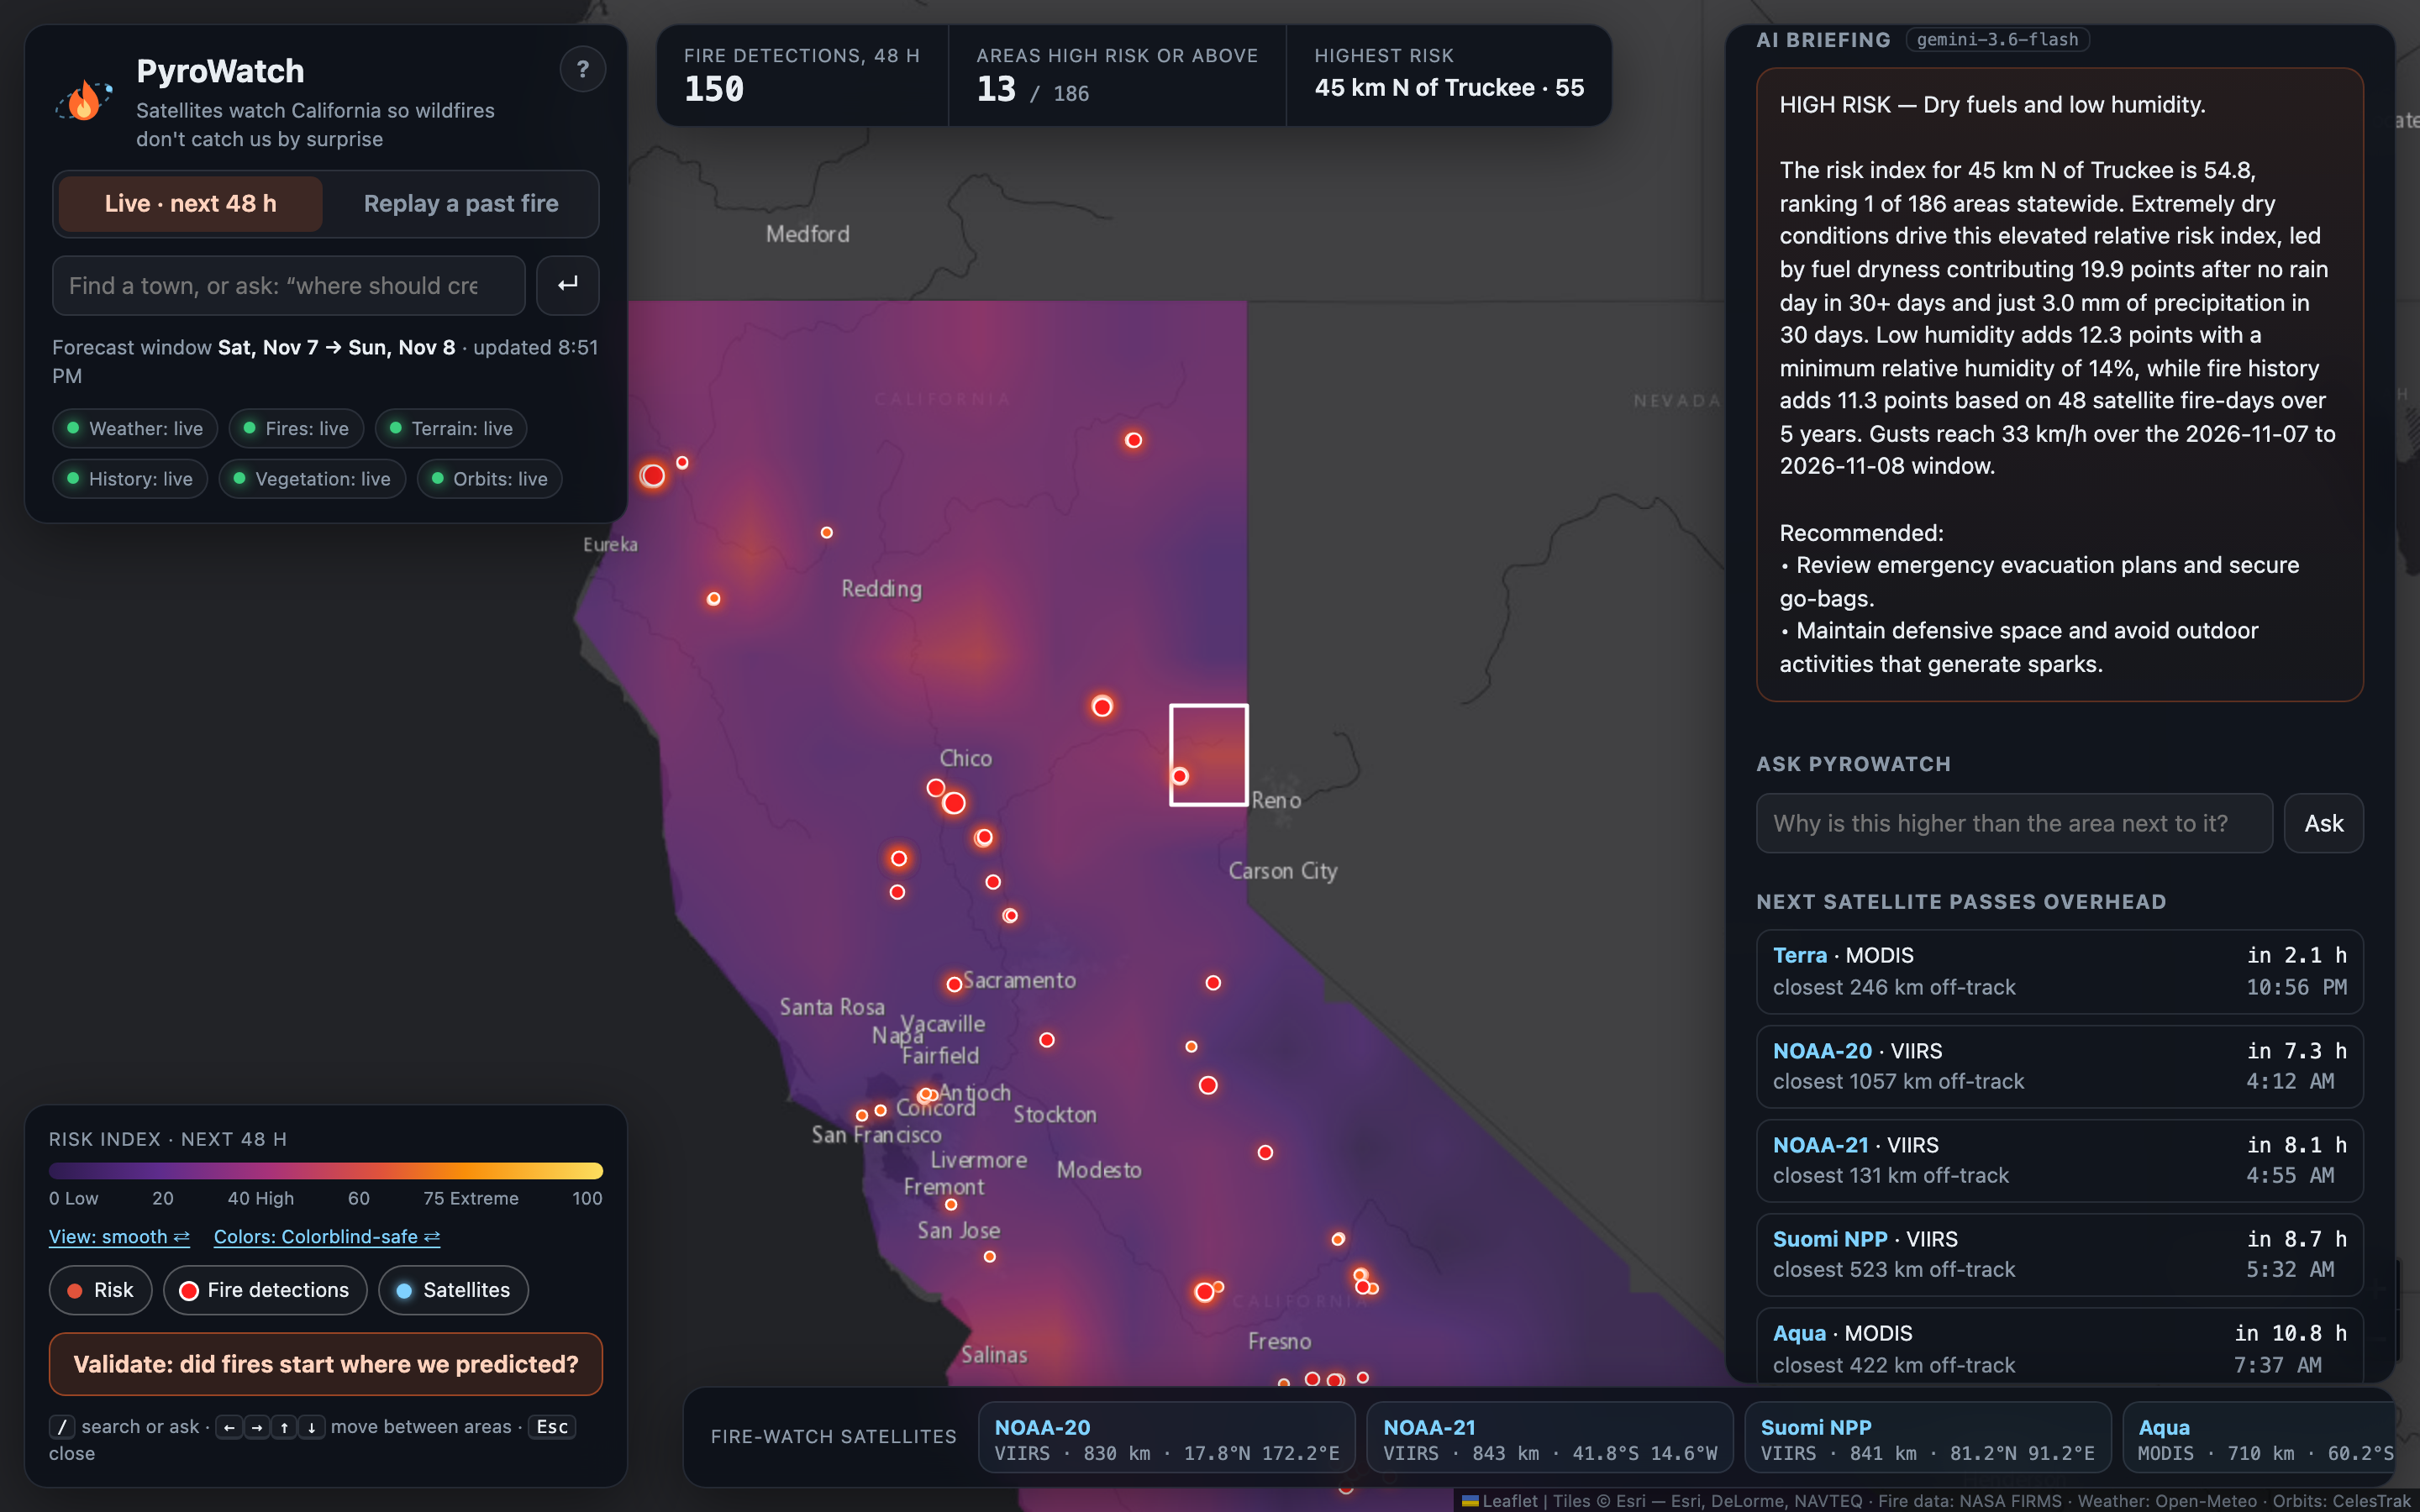
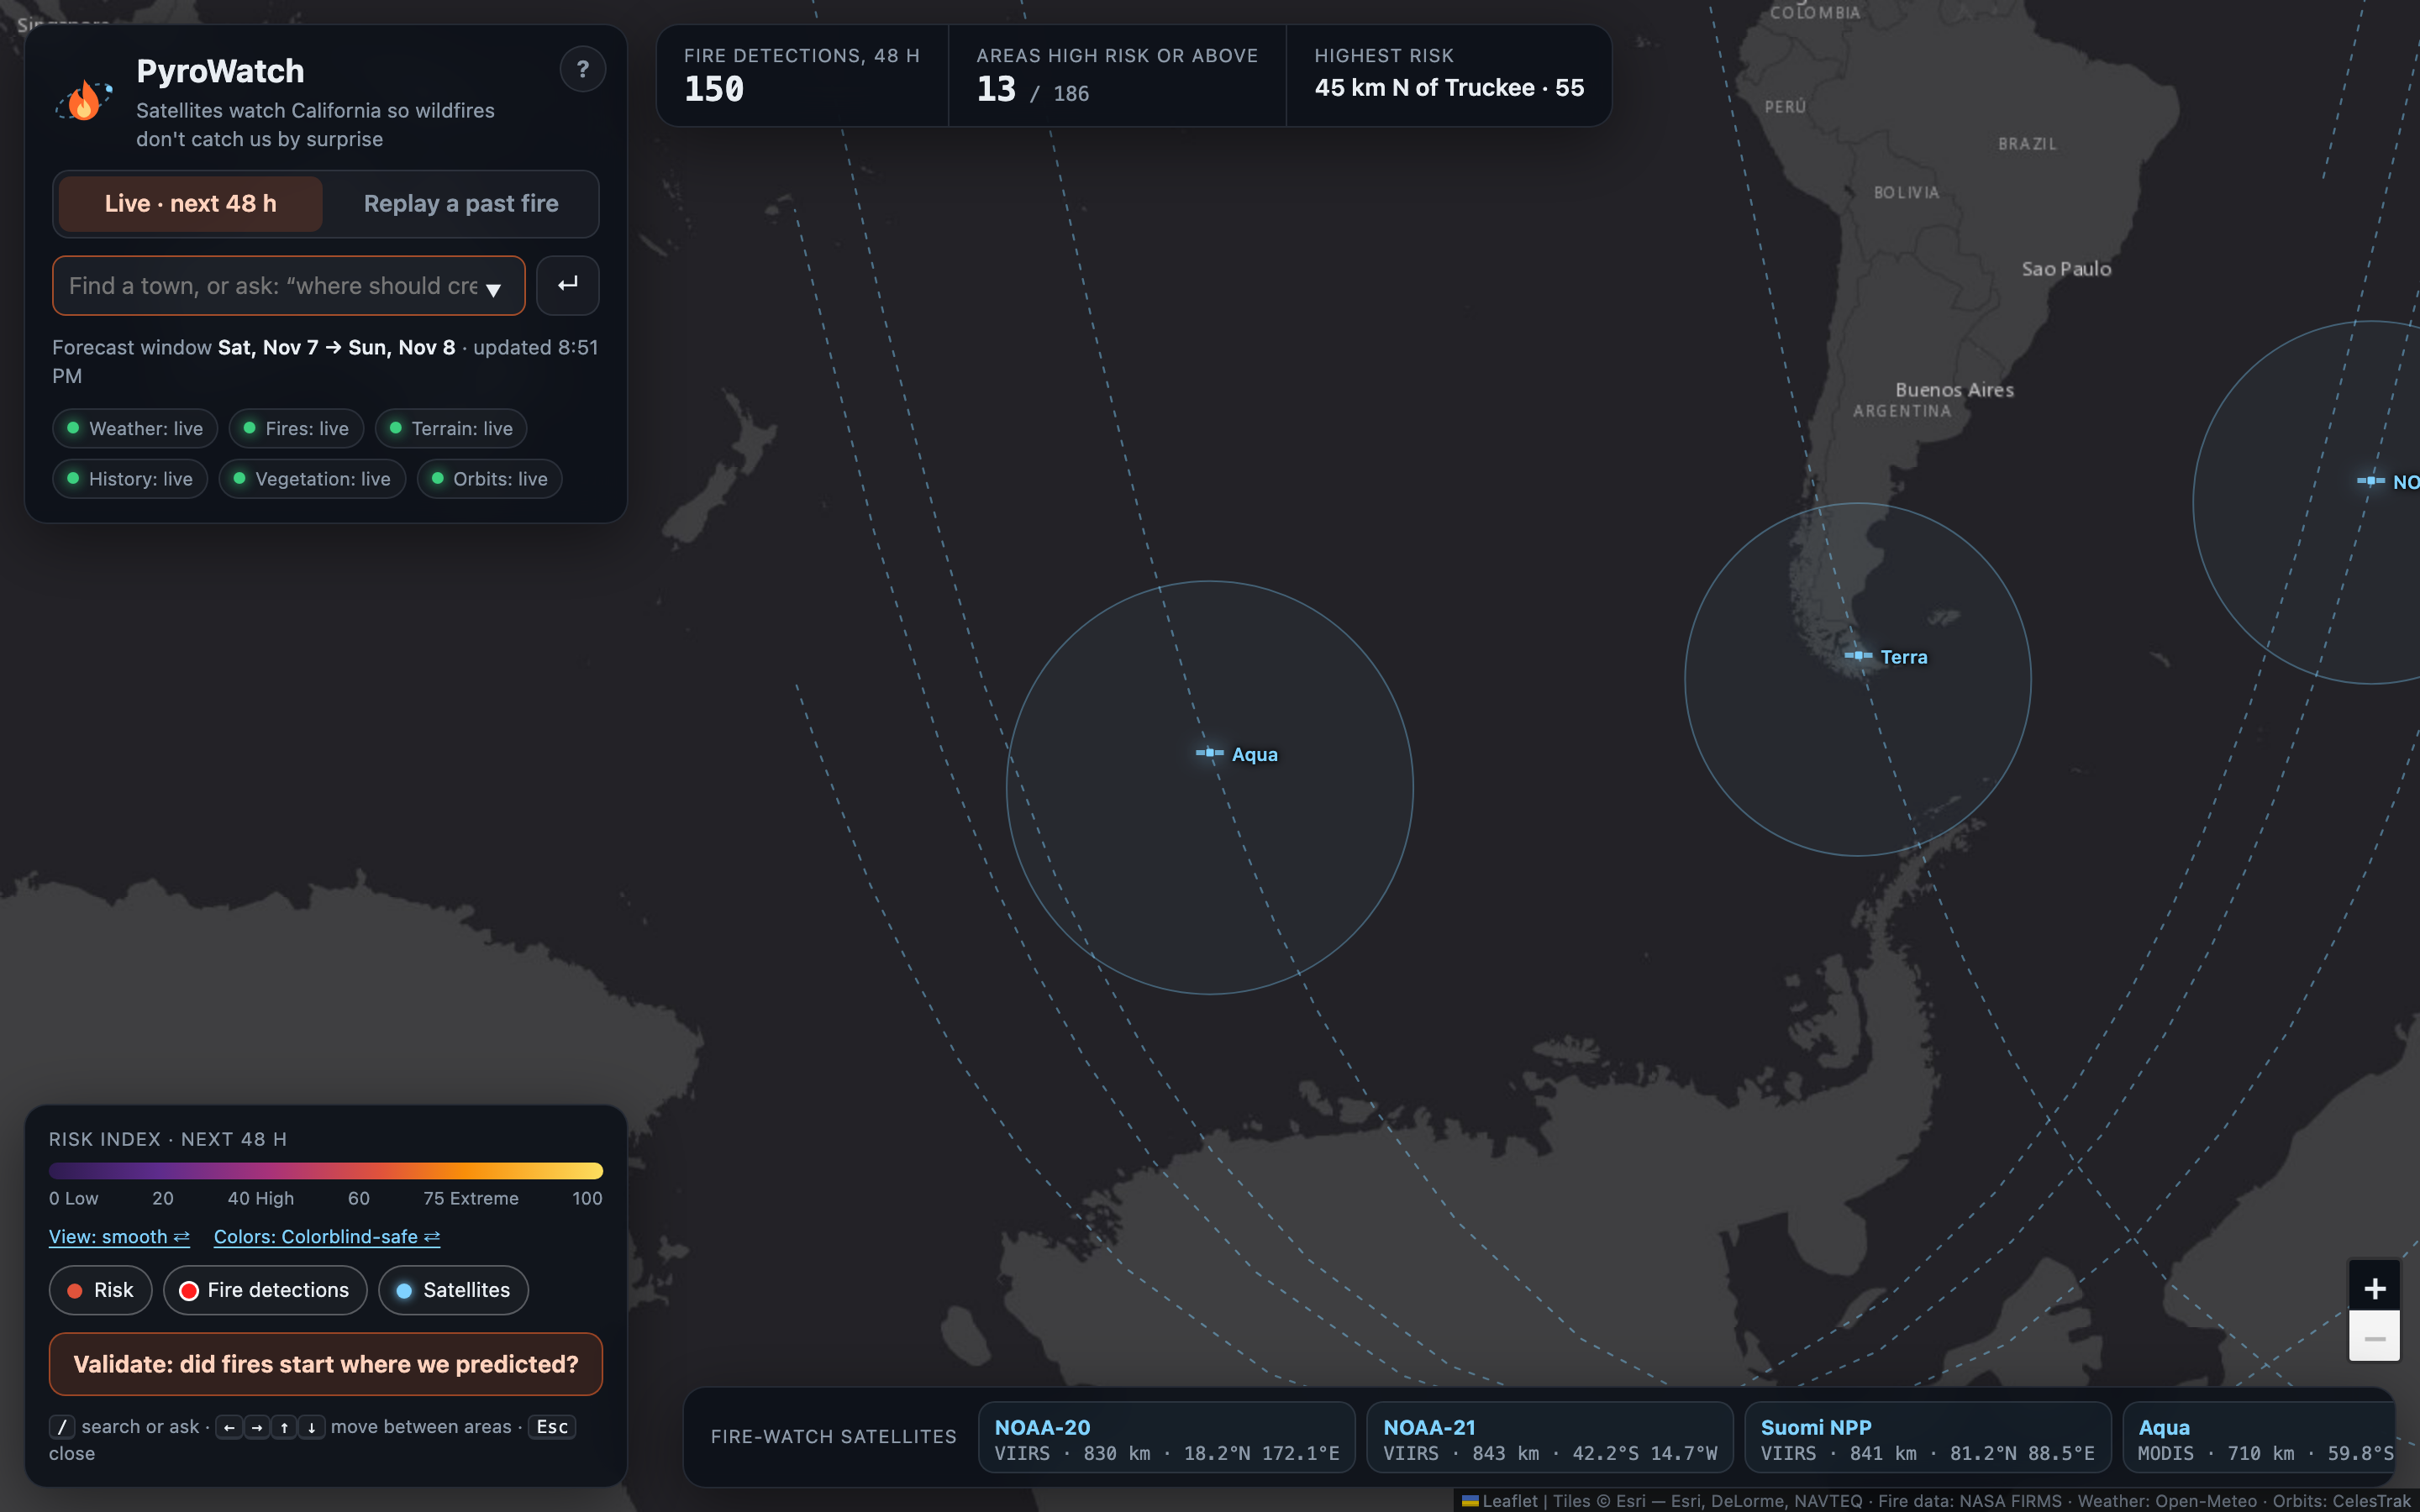
A plain-language briefing written by Gemini (read aloud by ElevenLabs), and when each fire-watch satellite next passes overhead.
-
-
-
Inspiration
On January 7, 2025, the Palisades and Eaton fires tore through Los Angeles. The warning signs were in free public data the day before: no rain in over 30 days, 74 km/h offshore gusts, 13% humidity. We wanted to know whether satellites and weather data could have pointed at the right neighborhoods in advance, and to build a tool that shows its work and checks itself against what actually burned.
What it does
PyroWatch scores wildfire risk for the next 48 hours across all 186 areas of California (about 50 km each), from weather forecasts, fuel dryness, vegetation, terrain and five years of satellite fire history.
- Every score shows its work: the points each factor adds, the standard Fosberg Fire Weather Index next to it, and a trained model's 7-day fire probability.
- Replay, reveal, validate: replay any past date using only data available that day, then reveal what NASA satellites saw burn next, with hit rate, lift over random and ROC AUC.
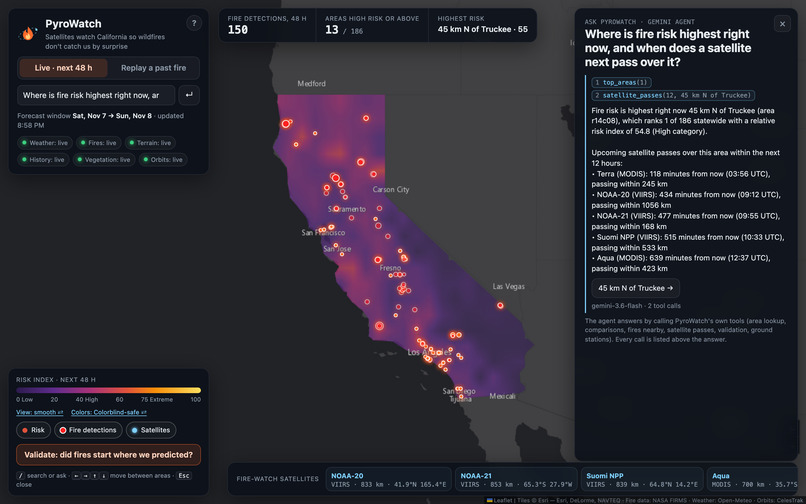
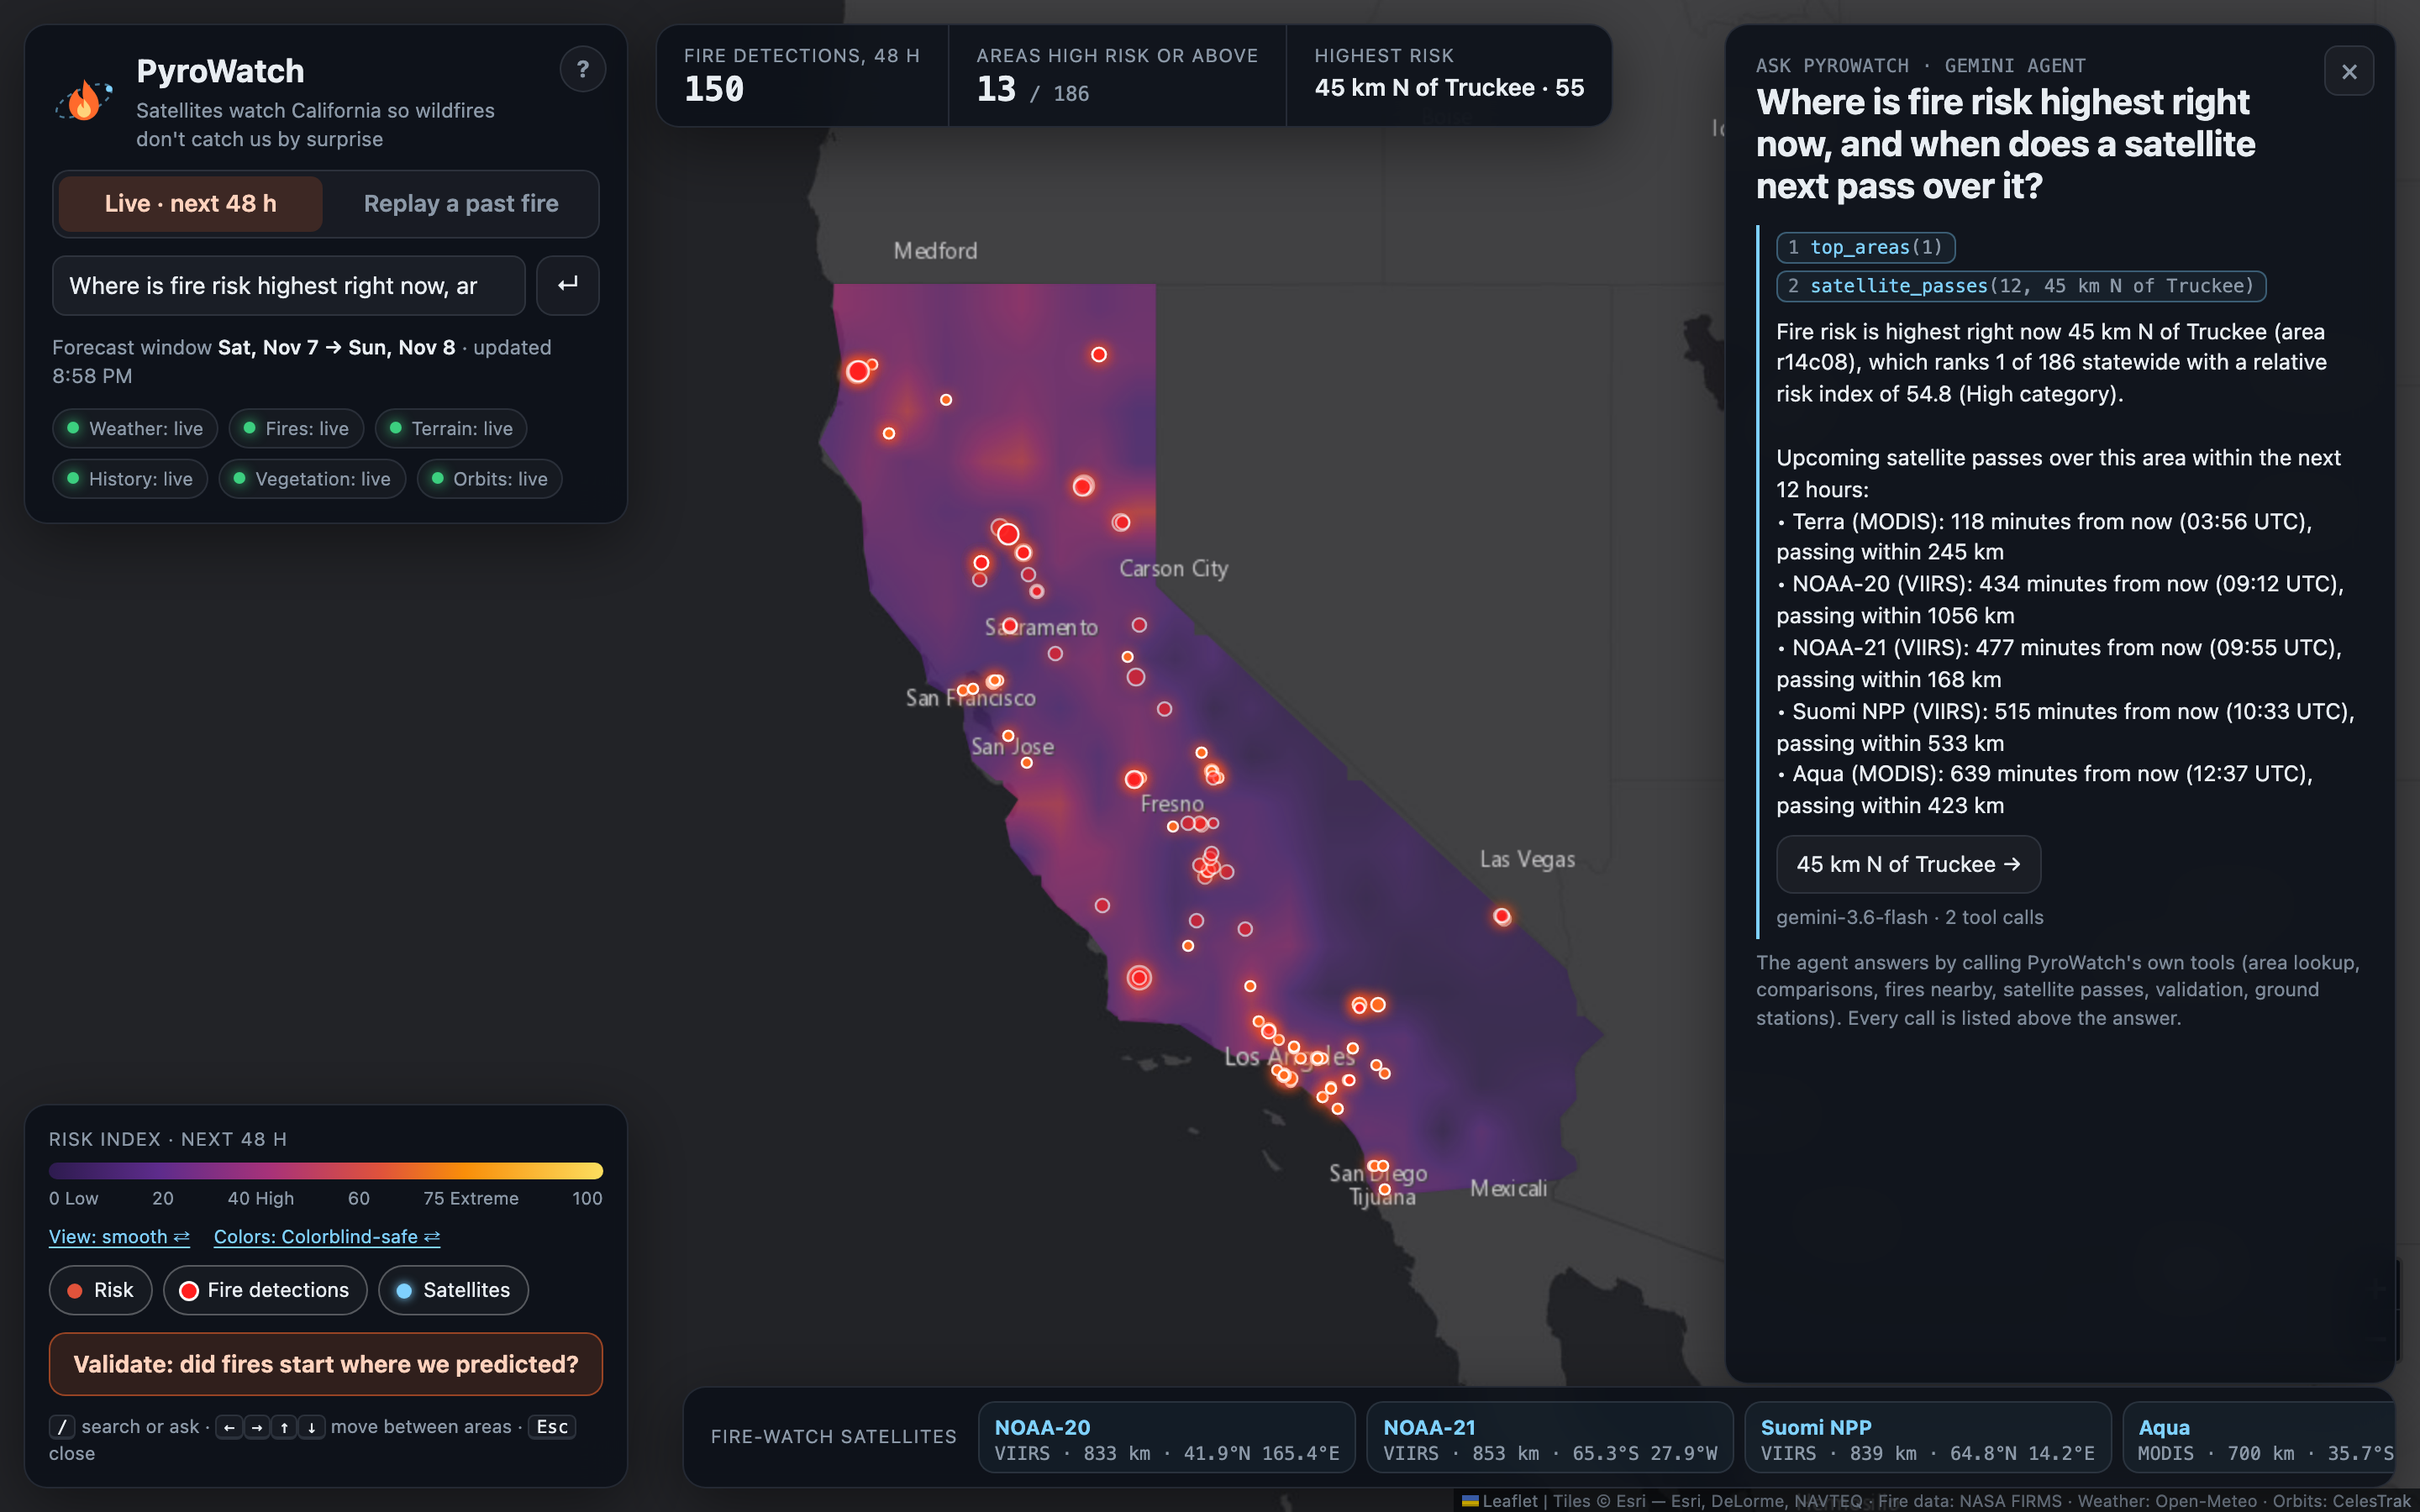
- Ask PyroWatch: a Gemini agent answers questions by calling eight of PyroWatch's own tools and lists every call. ElevenLabs reads briefings and answers aloud.
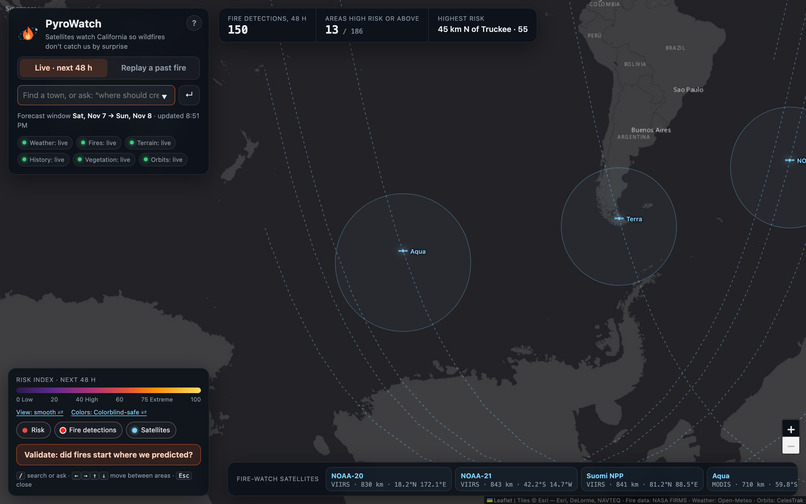
- The satellites doing the watching: NOAA-20, NOAA-21, Suomi NPP, Aqua and Terra, tracked live from their orbital elements, with their next passes overhead.
- Thunderstorm and blizzard outlooks alongside wildfire.
- History in Tiger Data: every refresh is stored as a TimescaleDB time series, so each area shows its last two weeks.
- PyroWatch Beacon: an ESP32 with a servo risk dial, a buzzer and a temperature and humidity sensor that reports back to the map as a ground station.
Results
The day before the LA fires, PyroWatch ranked the areas where the Palisades and Eaton fires started #1 and #2 of 186, using only data available that day.
Across four historical events, 21 of 46 significant new fires (peak intensity above 50 MW) started in our top 20% of areas: 2.3× better than random, and 50% more than the Fosberg index alone (14 of 46). A model trained on the 2021–2022 fire seasons and tested on 2023, a season it never saw, reached ROC AUC 0.70, against 0.61 for our hand-built score and 0.45 for Fosberg.
Where it falls short: lightning-started fires score close to random (1.1×), because we have no lightning input yet.
How we built it
A FastAPI (Python) backend and a Leaflet frontend with no build step. Data comes from NASA FIRMS (active fires), Open-Meteo (forecast, ERA5 history, elevation), NASA MODIS vegetation (via the ORNL DAAC) and CelesTrak (orbital elements). The risk index weights six factors and is gated by fuel dryness and vegetation. The ML model is scikit-learn logistic regression and gradient boosting with a time-based split. The agent uses Gemini function calling over eight tools; the voice is ElevenLabs; the time series are TimescaleDB hypertables on Tiger Data. Satellite orbits use SGP4 on the server and satellite.js in the browser. The beacon runs Arduino firmware on an ESP32.
Challenges we ran into
- Our first validation counted winter farm burns and refinery flares as fires. We switched to fire intensity (above 50 MW) and dropped industrial detections. Because that change came after seeing the data, we always show the all-hotspot numbers next to it.
- Weather alone ranked bare desert as extreme. A vegetation multiplier from NASA MODIS fixed that.
- Gemini models were retired or overloaded mid-hackathon, so the agent now falls back across models and times out gracefully. Without Gemini, a keyword router calls the same tools.
- Shared venue wifi hit API rate limits, so we added caching, retries and a clearly labelled demo mode.
Accomplishments that we're proud of
- Predictions that are checked, not just claimed: replays with no future data, a standard baseline to beat, and our failure cases shown openly.
- The LA result, and a model that holds up on a season it never saw.
- Satellites, weather, an AI agent, voice and hardware working together in one app.
What we learned
Baselines and base rates matter more than a pretty map. Leaking future data into a "prediction" is easy, so every replay only uses what existed that day. Saying where the model falls short is part of the result.
What's next
Lightning and dry-thunderstorm inputs, a finer grid, official Red Flag Warnings as an overlay, more states, and push alerts from the beacon.
Built With
- celestrak
- elevenlabs
- esp32
- fastapi
- google-gemini
- javascript
- leaflet.js
- nasa-firms
- nasa-modis
- numpy
- open-meteo
- postgresql
- python
- satellite.js
- scikit-learn
- sgp4
- tiger-data
- timescaledb
