-
-

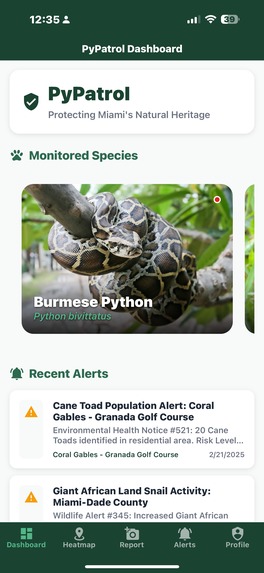
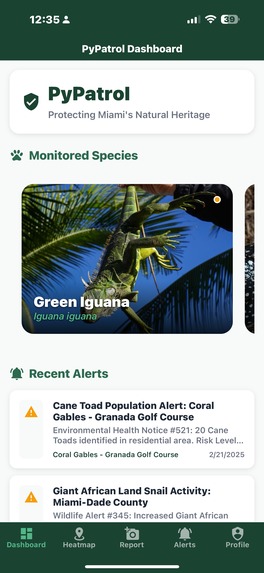
Home Page
-
-
-
-
-
-
-
-


Inspiration
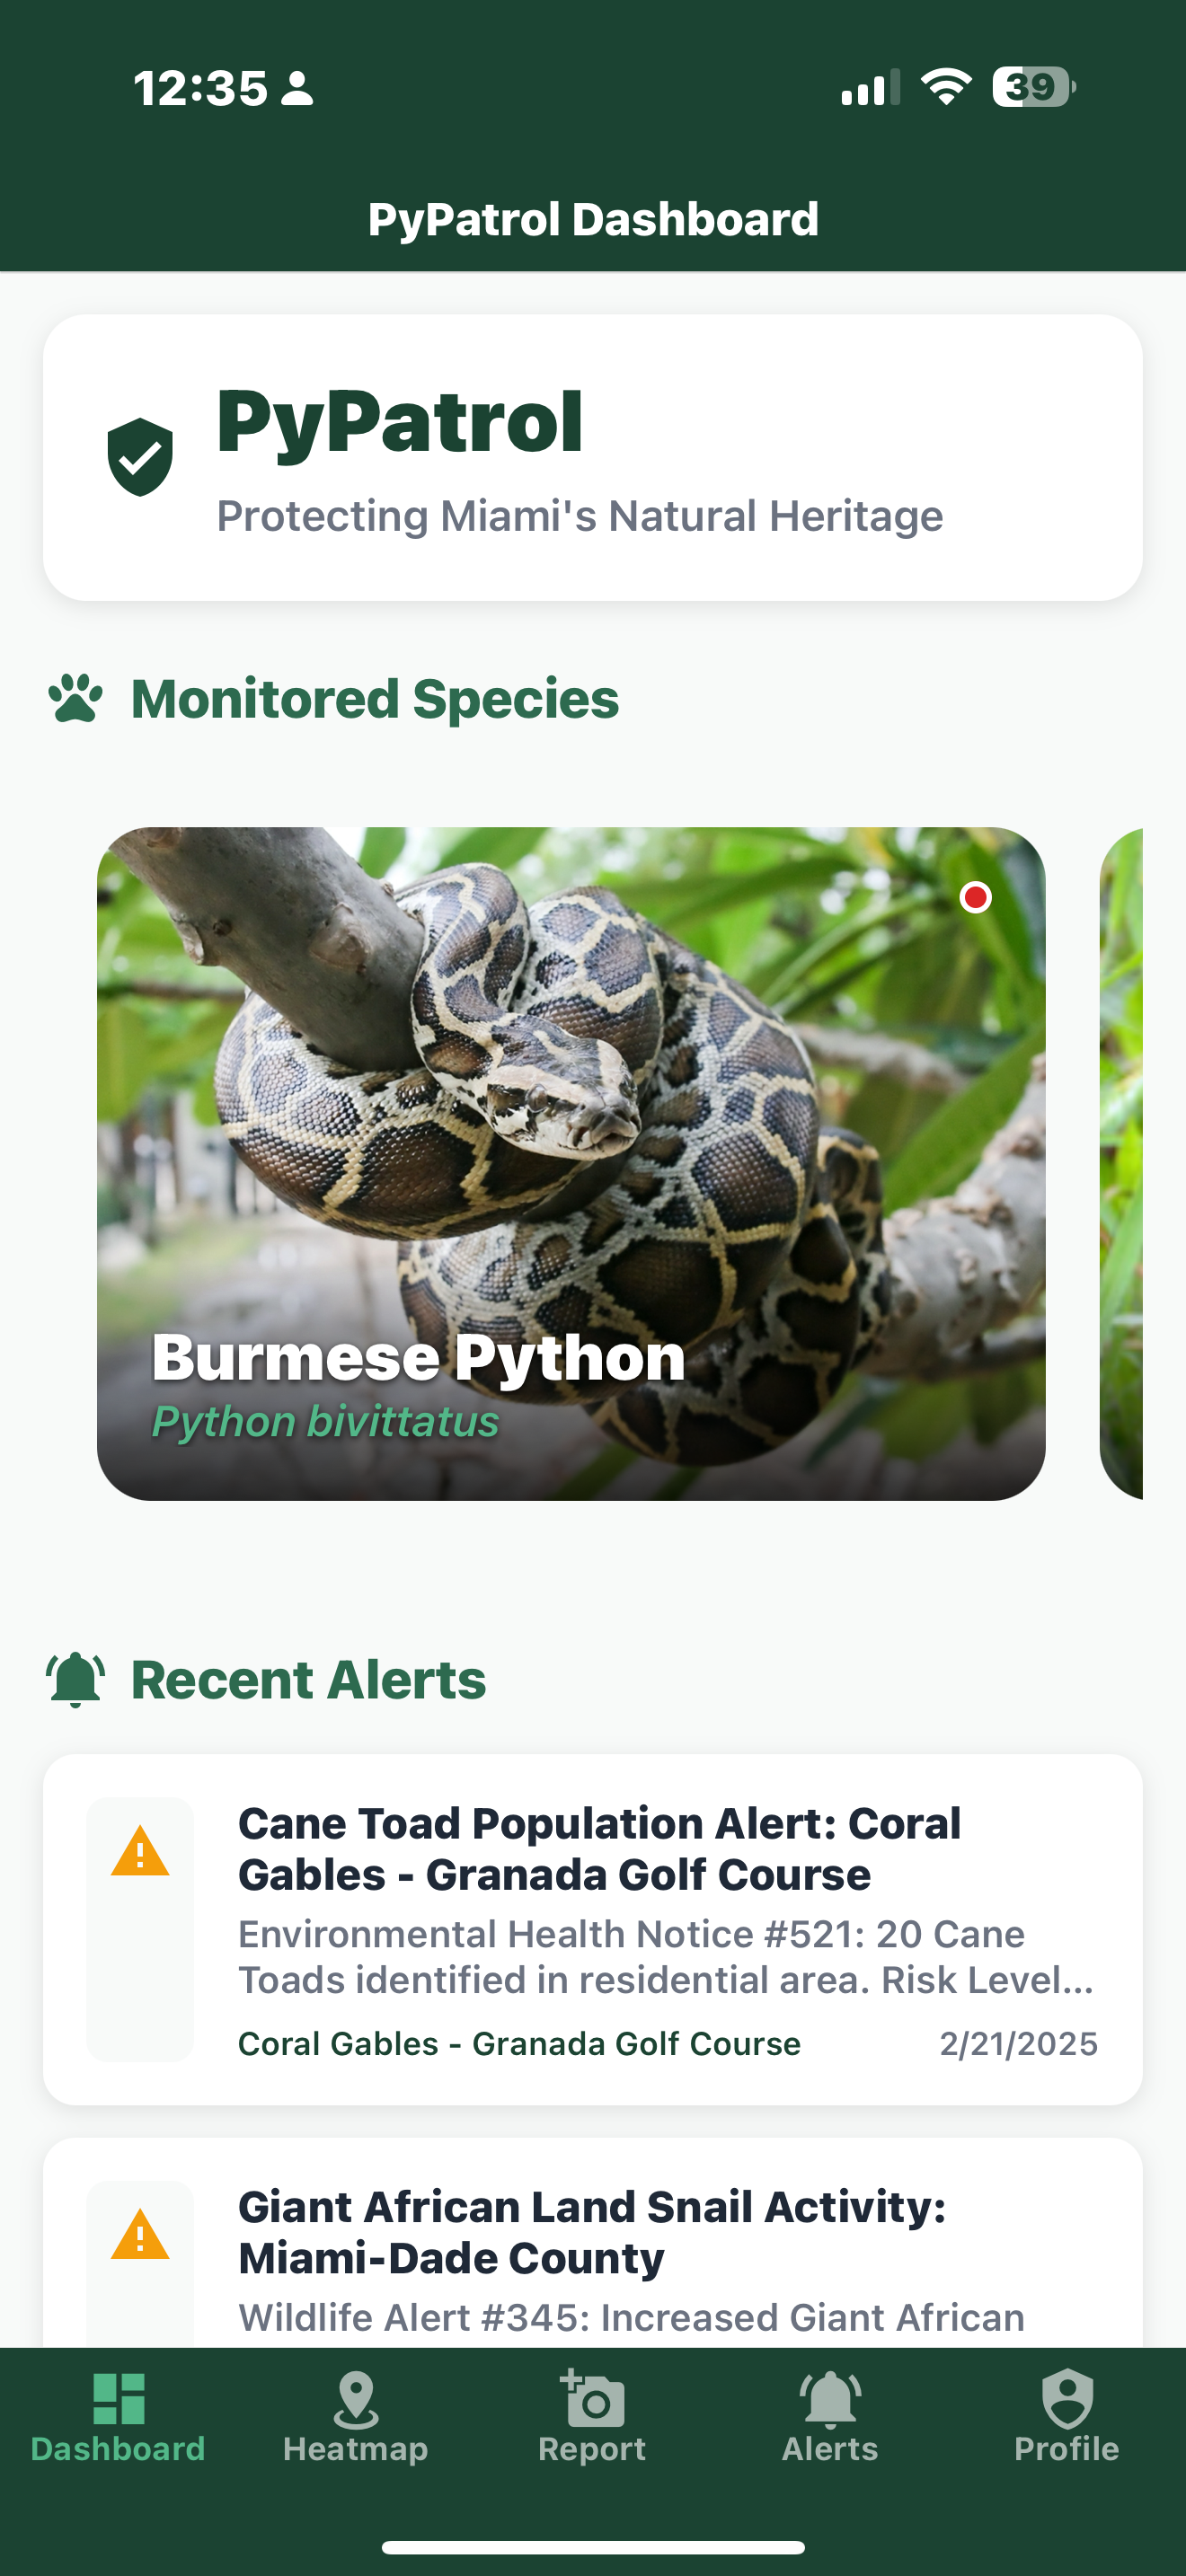
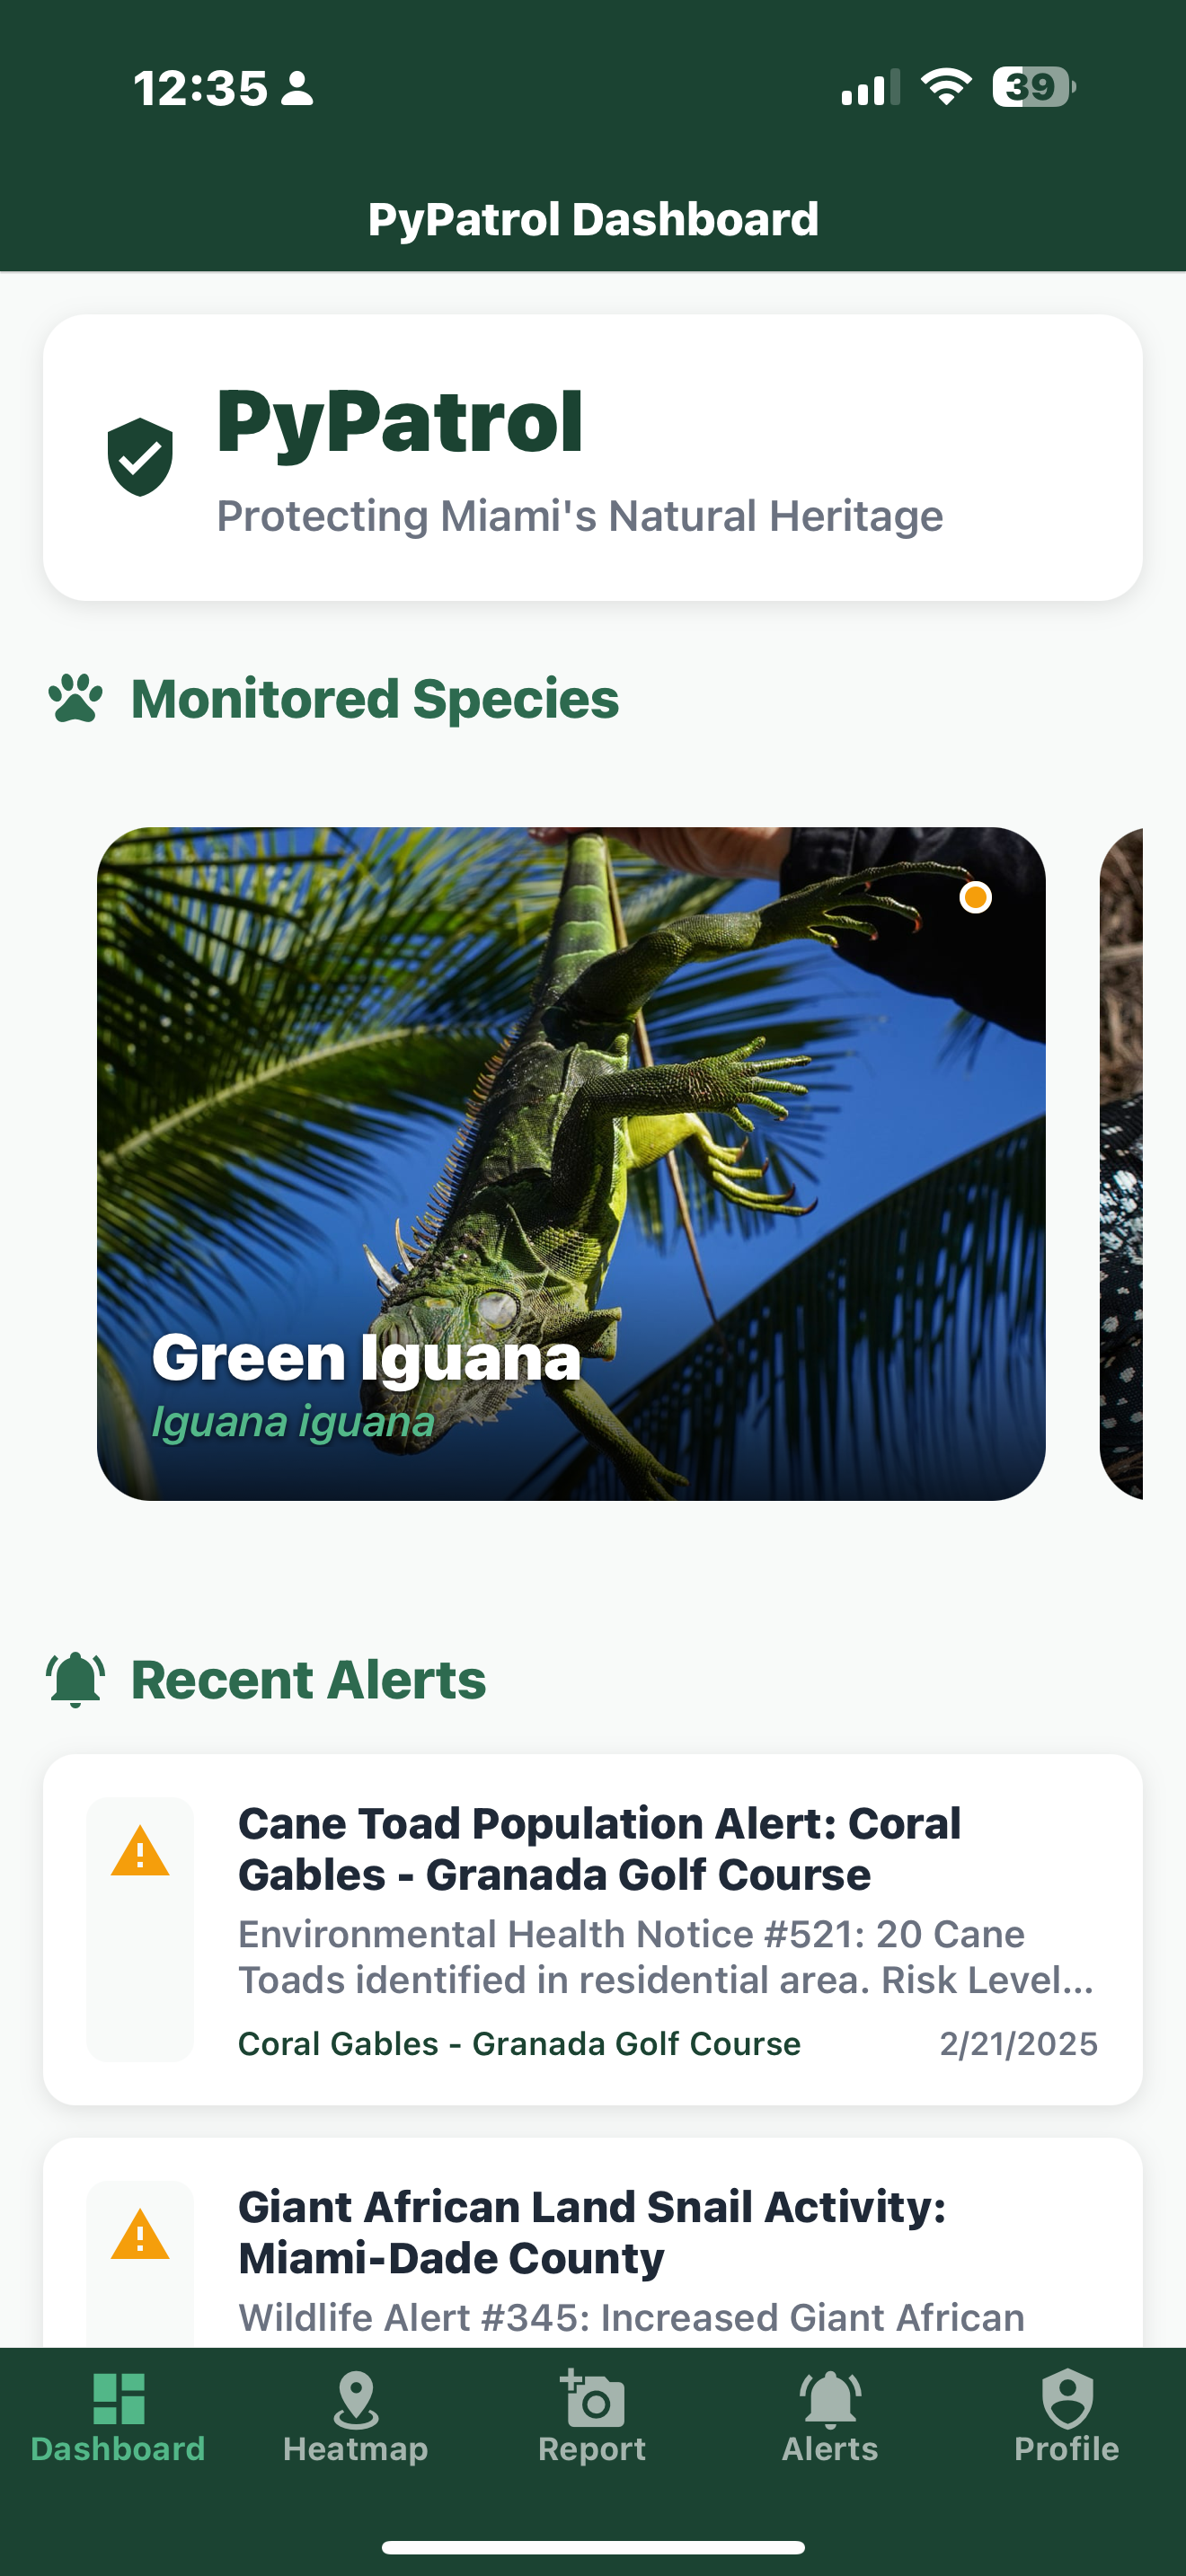
- The Problem: Miami-Dade faces a serious invasive species crisis with Burmese pythons, tegu lizards, green iguanas, African land snails, cane toads, and feral hogs disrupting ecosystems and costing millions.
- My Spark: As a solo founder passionate about tech and the environment, I saw an opportunity to use AI and big data to make sense of scattered data – turning chaos into actionable insights that help protect Miami’s unique ecosystem.
What It Does
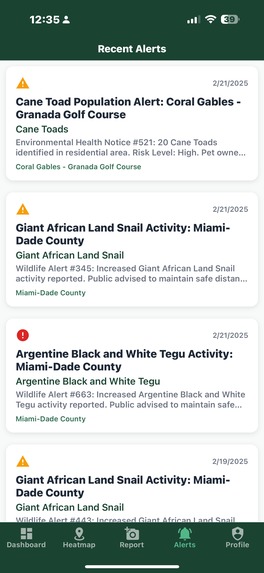
- Data Aggregation: Scrapes data from wildlife databases, social media, and news outlets for real-time sightings.
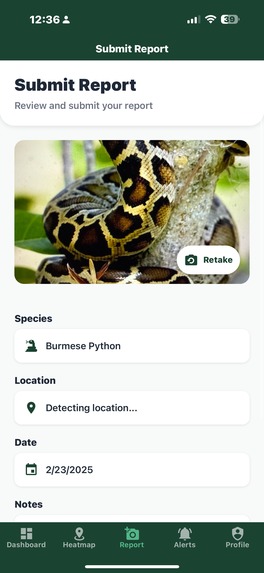
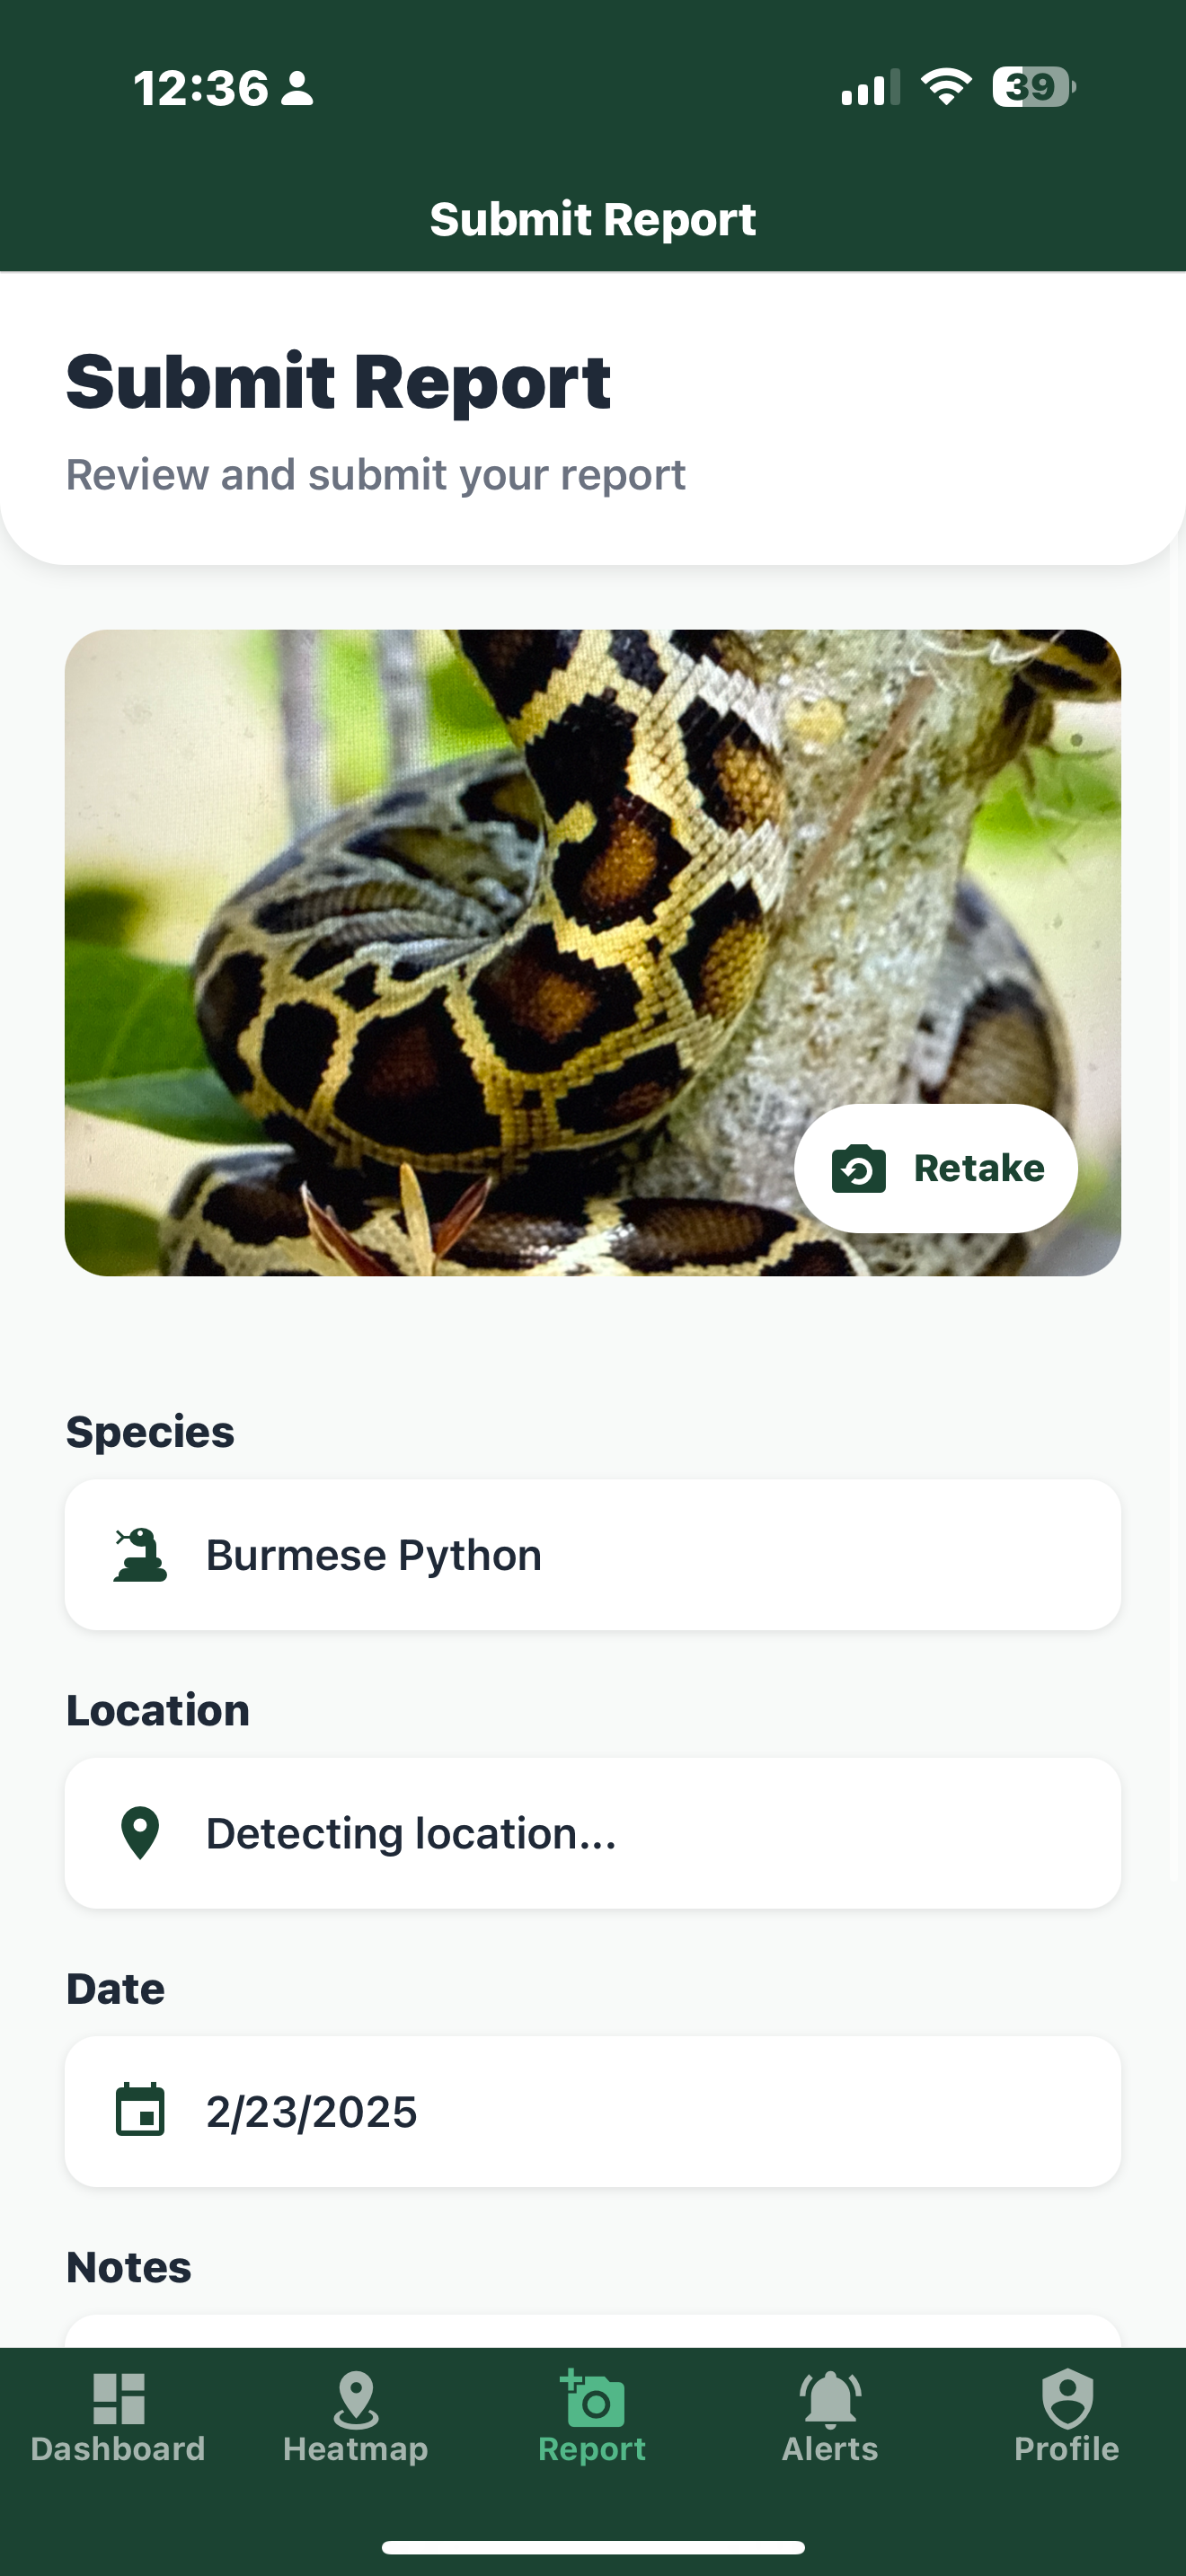
- AI Verification: Uses NLP to process text reports and an image recognition model (which you can plug in later) to confirm sightings.
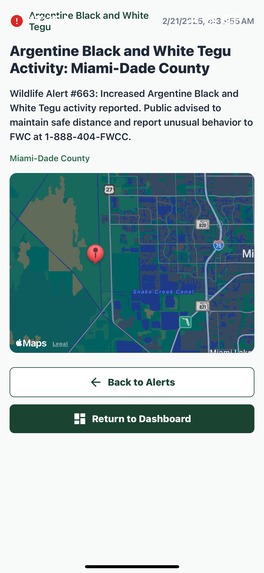
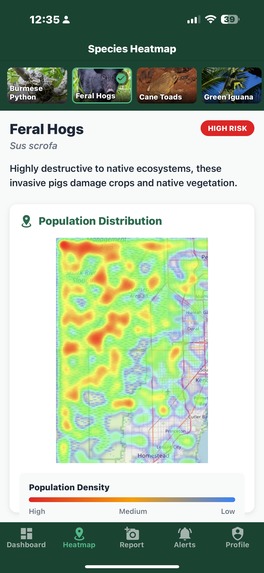
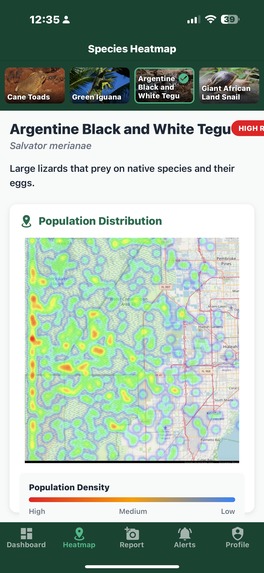
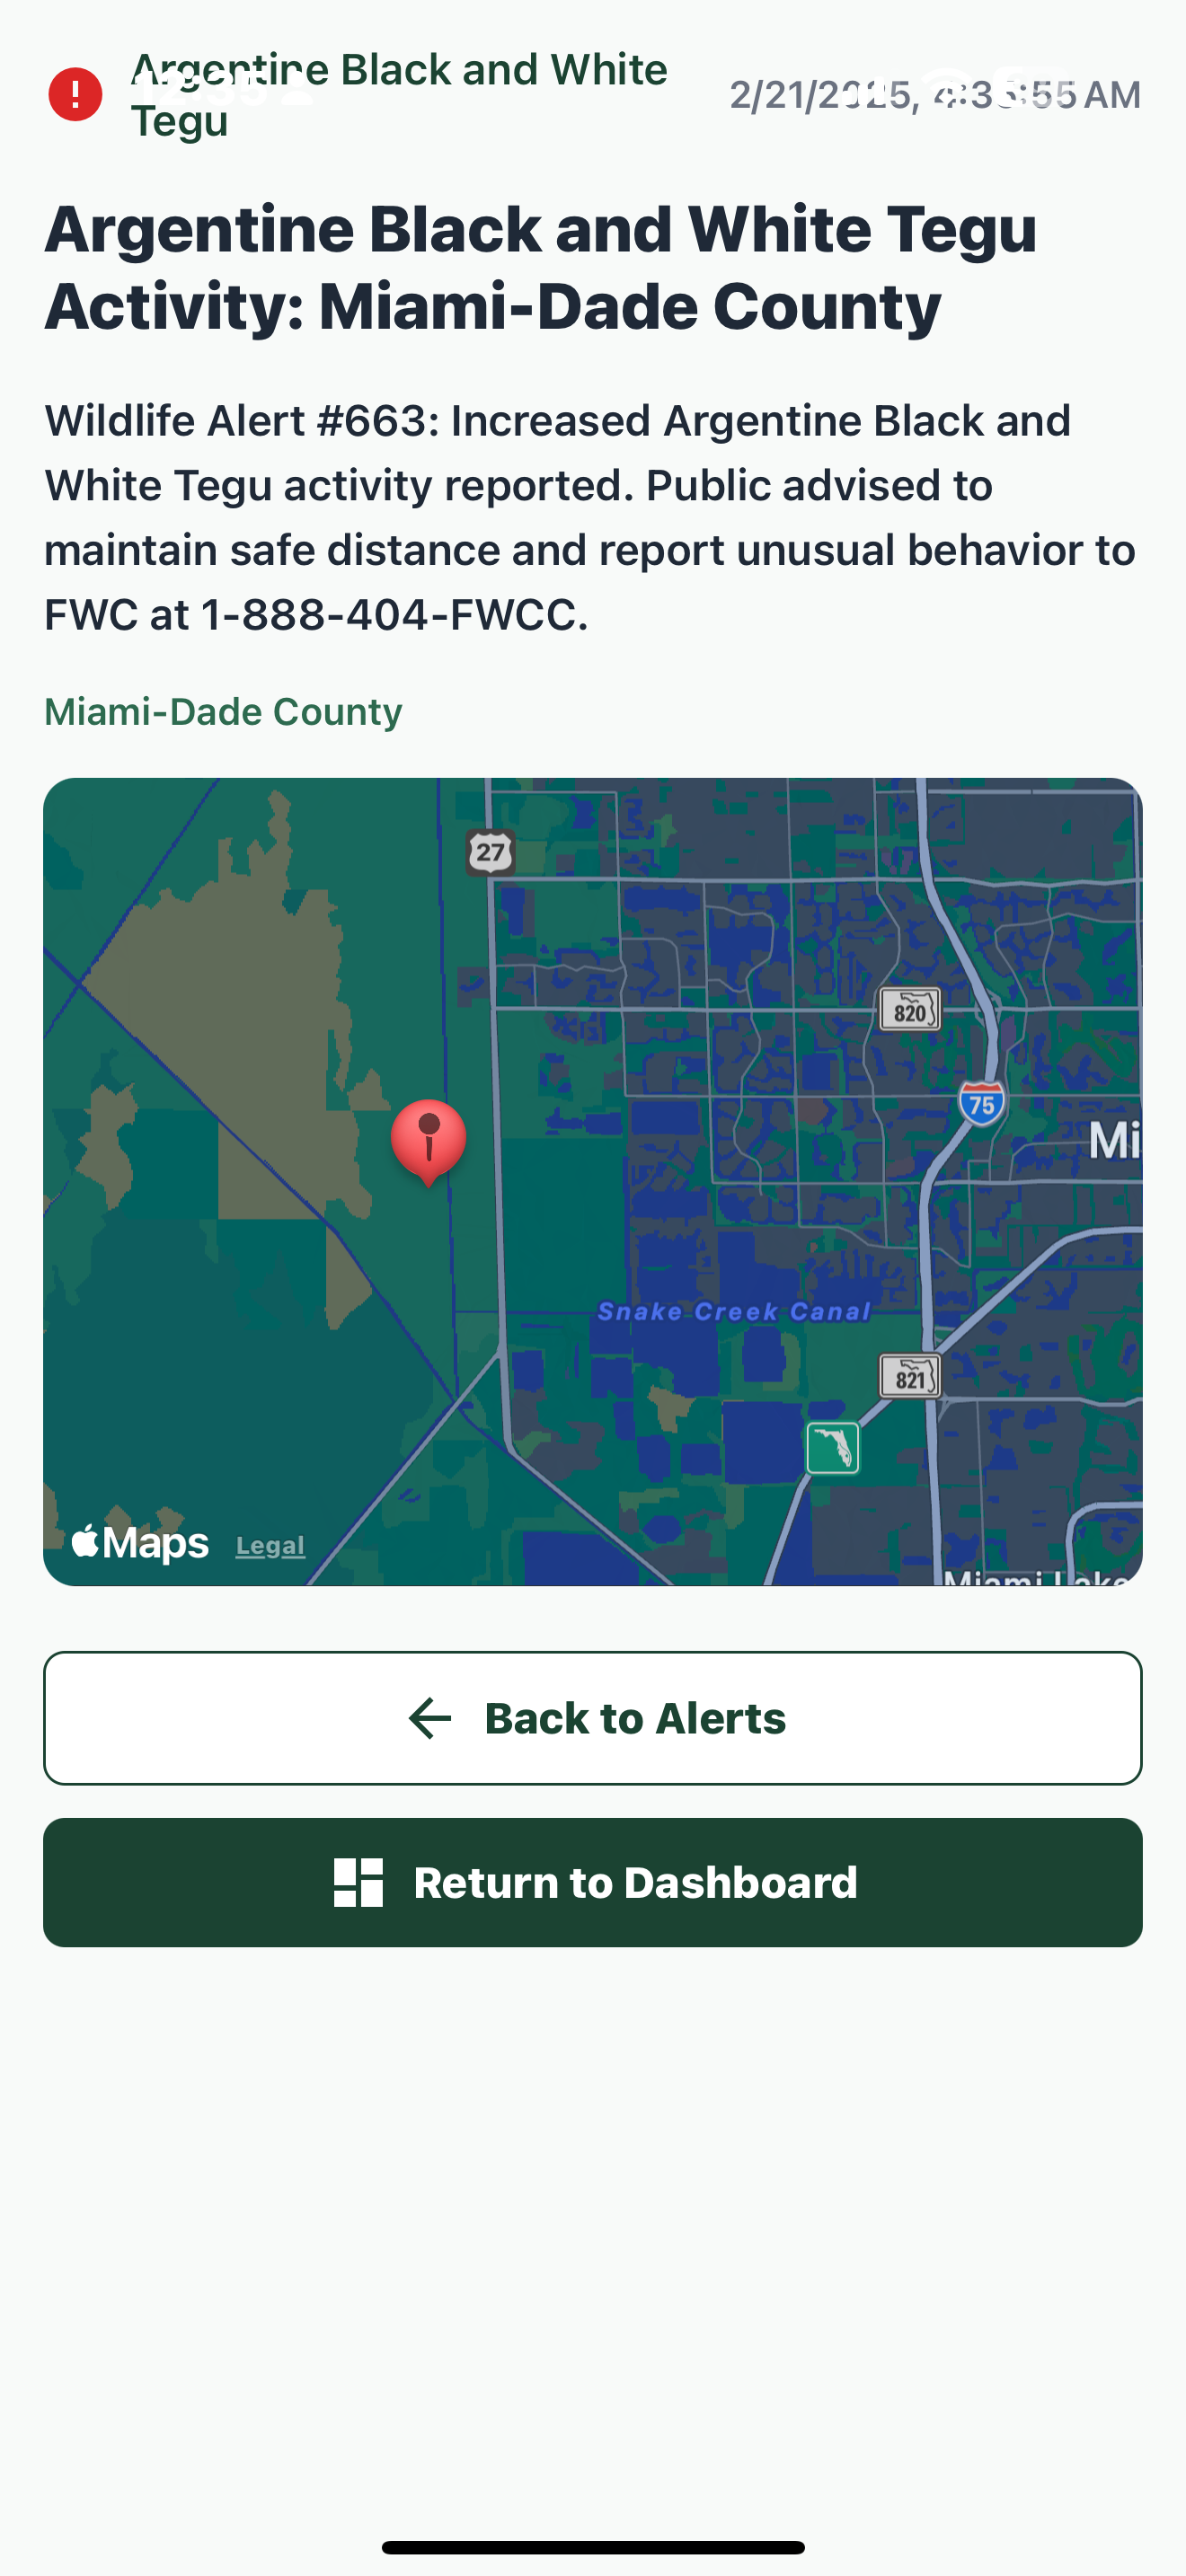
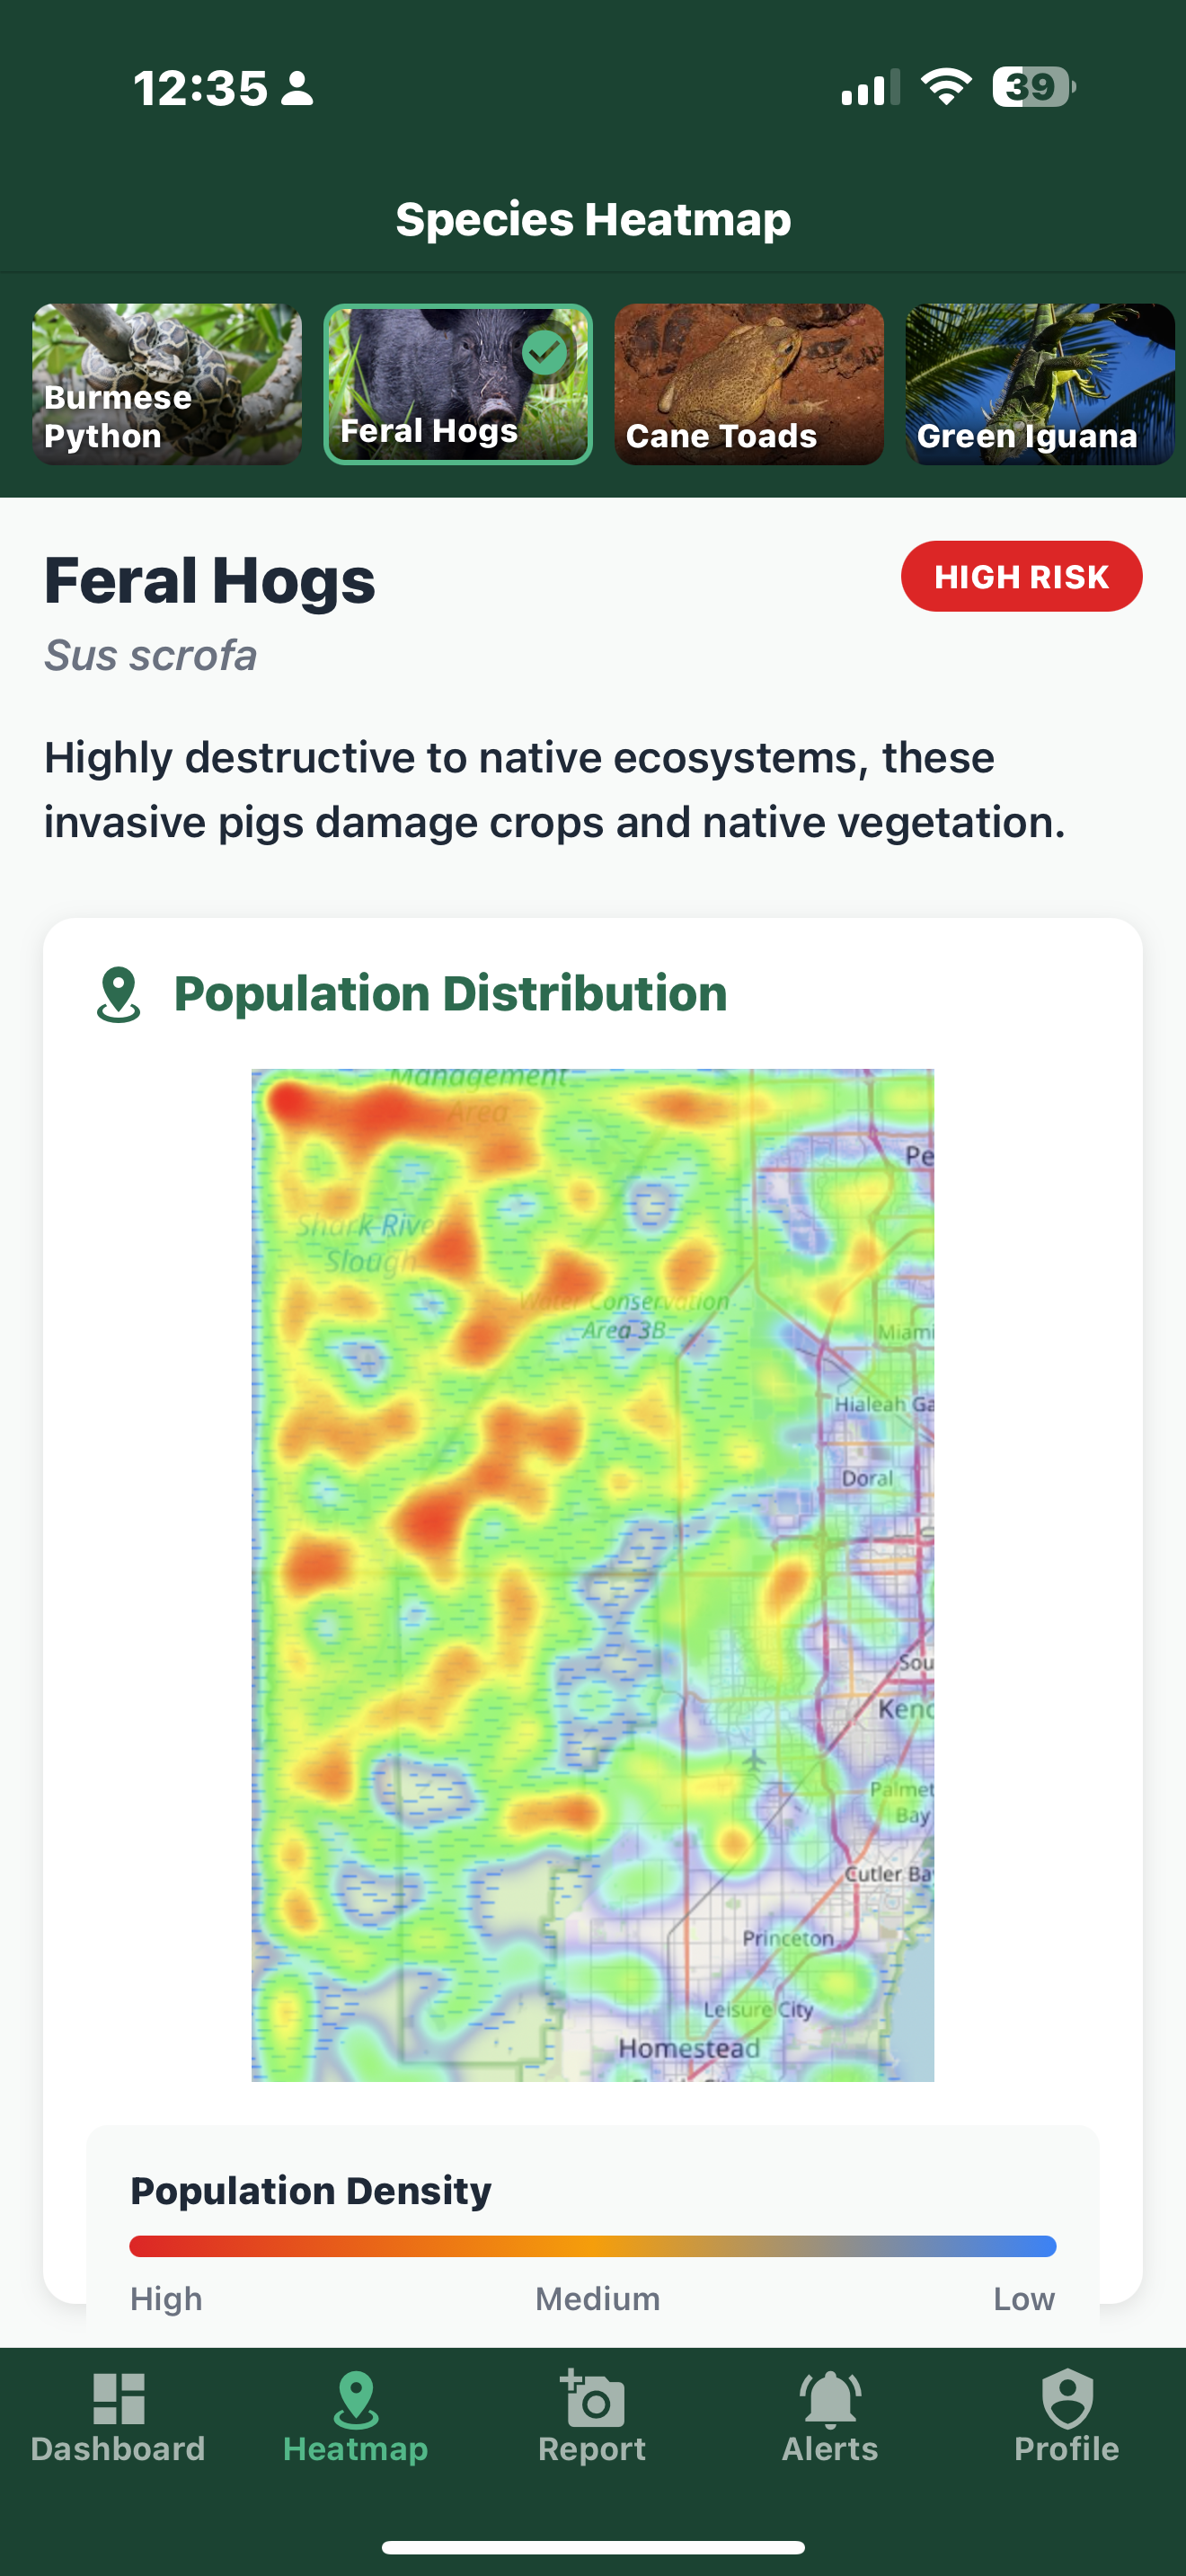
- Geospatial Mapping: Clusters verified sightings to generate interactive maps and heatmaps of invasive species hotspots.
- Actionable Insights: Predicts future spread trends, allowing agencies to focus their mitigation efforts where it matters most.
How I Built It
- End-to-End Pipeline: Developed Python scripts for data scraping from sources like EDDMapS, USGS NAS, and iNaturalist.
- AI Integration: Leveraged spaCy for text analysis and set up a framework for image recognition (currently returning dummy data so I can later drop in my custom .pt model).
- Clustering & Visualization: Implemented DBSCAN clustering for geospatial analysis and built an interactive dashboard using Folium.
- Tech Stack: Entire solution built as a solo project using open-source libraries in Python, with a mobile frontend for visualization.
Challenges I Ran Into
- Data Heterogeneity: Merging data from multiple sources required extensive cleaning and standardization.
- Tech Integration: Combining web scraping, NLP, computer vision, and geospatial clustering in one streamlined pipeline was challenging.
- Performance: Ensuring real-time updates without overwhelming the system demanded careful algorithm optimization.
- Mapping Precision: Accurately overlaying heatmaps on Miami’s actual landmass (especially zooming in on the Homestead–Hollywood area) took some fine-tuning.
Accomplishments I’m Proud Of
- Seamless Data Pipeline: Created a robust, end-to-end solution that aggregates, processes, and visualizes real-time data.
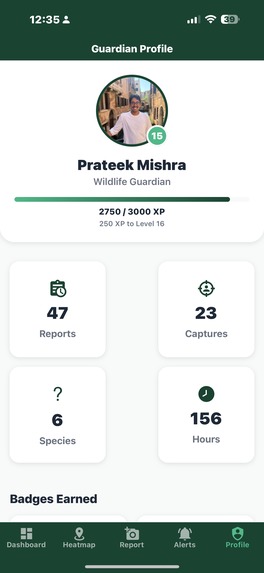
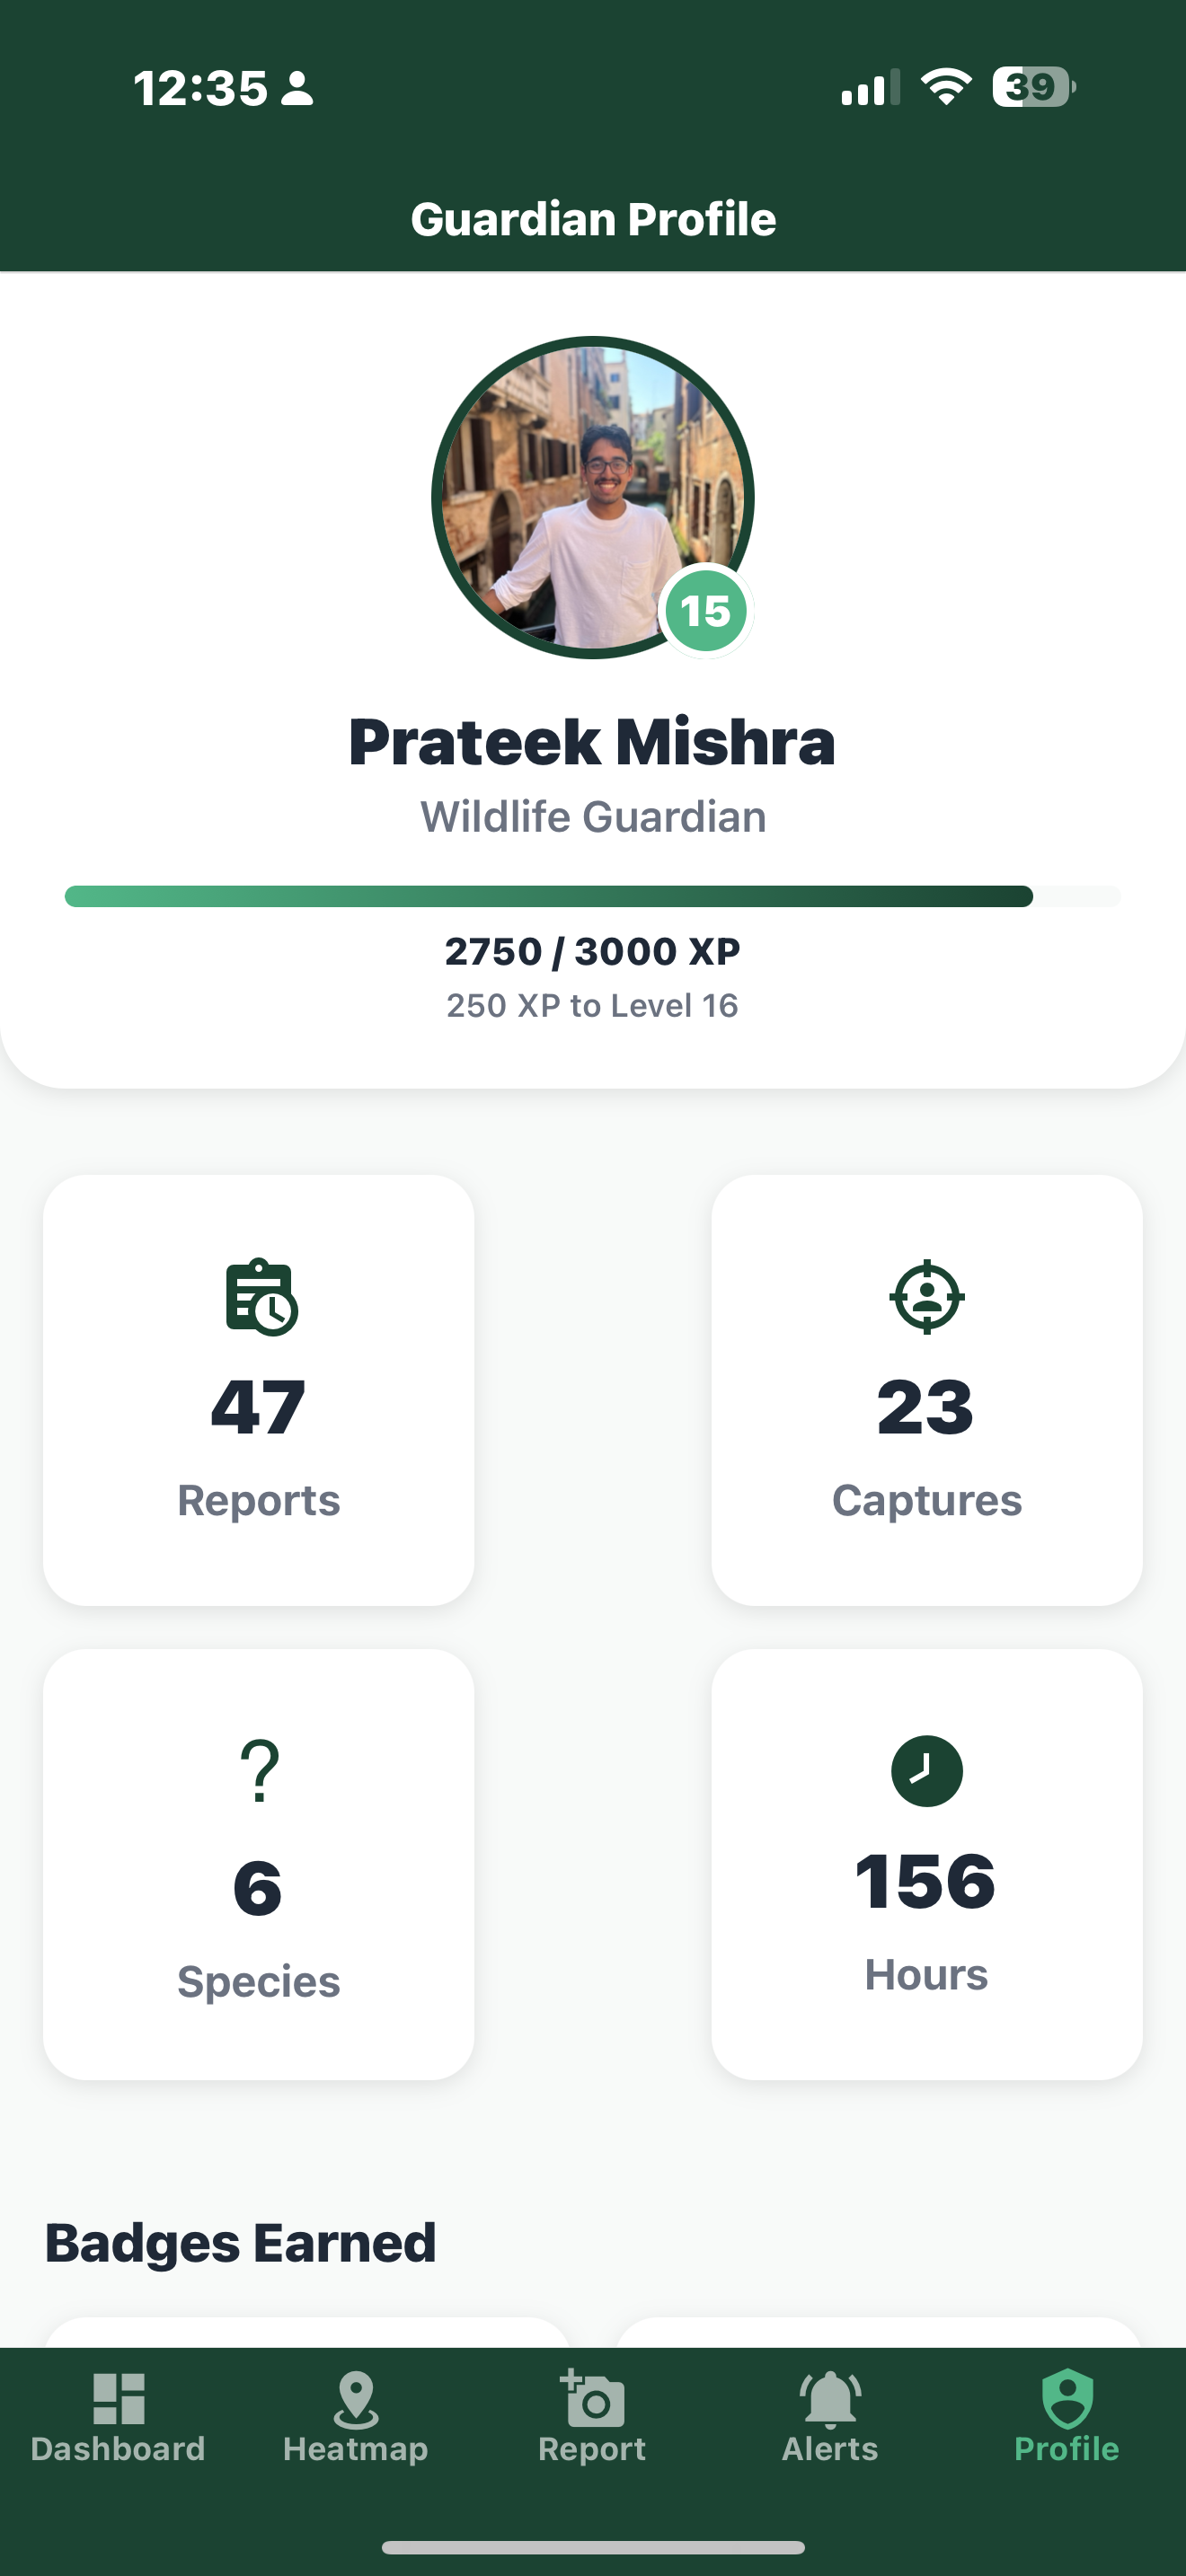
- Interactive Dashboard: Developed an engaging, easy-to-use interface that shows actionable insights at a glance.
- Scalable Architecture: Designed the platform to be extended to other invasive species and regions, proving the concept’s scalability.
- Solo Innovation: As a one-person team, I managed to integrate cutting-edge AI techniques with environmental data – bridging tech and conservation.
What I Learned
- The Power of Data: Clean, well-integrated data is key to turning a complex ecological problem into actionable insights.
- Interdisciplinary Problem Solving: Merging ecology with AI and geospatial analysis opens up new ways to address real-world challenges.
- Resilience as a Solo Founder: Managing all aspects of a project—from coding to design to research—has taught me invaluable lessons in perseverance and resourcefulness.
- User-Centric Design: The importance of a simple, intuitive interface that allows users (from government officials to conservationists) to quickly grasp the data.
What’s Next for PyPatrol
- Refine AI Models: Integrate a fully trained object detection model and fine-tune NLP pipelines with more domain-specific data.
- Expand Data Sources: Incorporate additional public and private datasets to improve accuracy and coverage.
- Real-Time Alerts: Develop a real-time notification system (using web sockets or push notifications) to alert agencies as new hotspots emerge.
- Platform Expansion: Extend PyPatrol to monitor other invasive species and even explore partnerships with local governments and startups to scale the solution statewide.

Log in or sign up for Devpost to join the conversation.