Inspiration
When we train a neural network it is not very intuitive to understand what the neural network is learning underneath or how each layer in the neural network is representing the data on which it is trained on. One way to a better comprehension of the network is to visualise the feature maps. So, if we can visualise the layers/ feature maps during the training process, we can have a more clear picture of what the network is learning and which layer parameters needs to be fine-tuned. Furthermore, by having a peek through the features maps of various layers we will be able to get a notion of whether a layer is biasing at some set of examples or not.
Hence a package that can help envision the feature maps of the desired layers of a model, can help us train our network more efficiently.
What it does
PyLaymon is a python based package, which is used to visualize the features maps of a given model or a set of layers of a model.
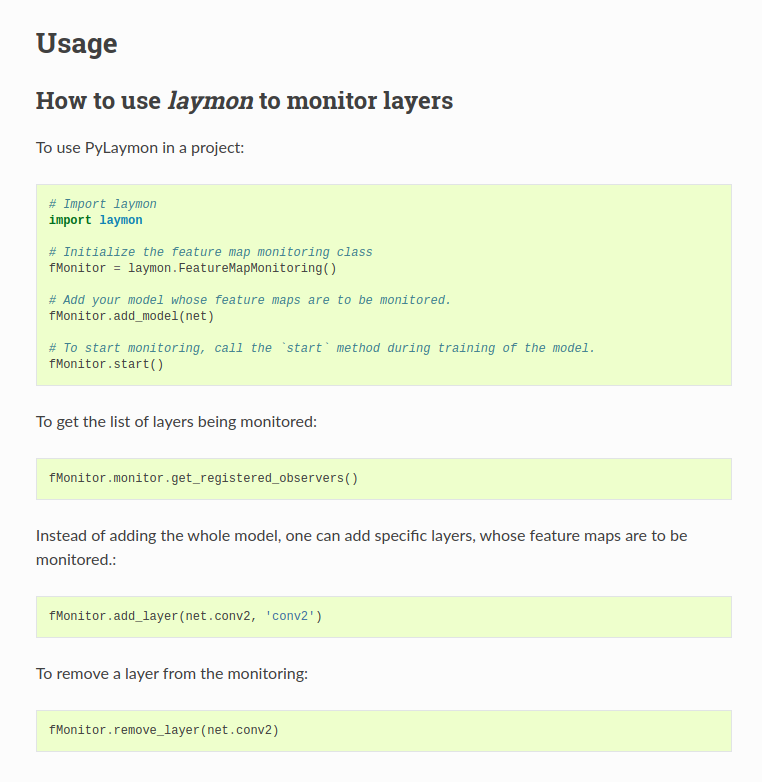
It consists of a feature map monitor that maintains a list of layer observers objects (layers whose feature maps need to be visualised). The monitor notifies these layer observers to update their display objects when the state of the activation maps corresponding to each of the layer changes.
One can refer to the documentation page of the project to view more details about the package and how to use it in a project.
How I built it
The package has been built in python using the PyTorch framework to create hooks into the layers that are being monitored/visualised. It uses matplotlib to display the feature maps, although one can create custom display classes of their choice and hook them into the corresponding layer observer.
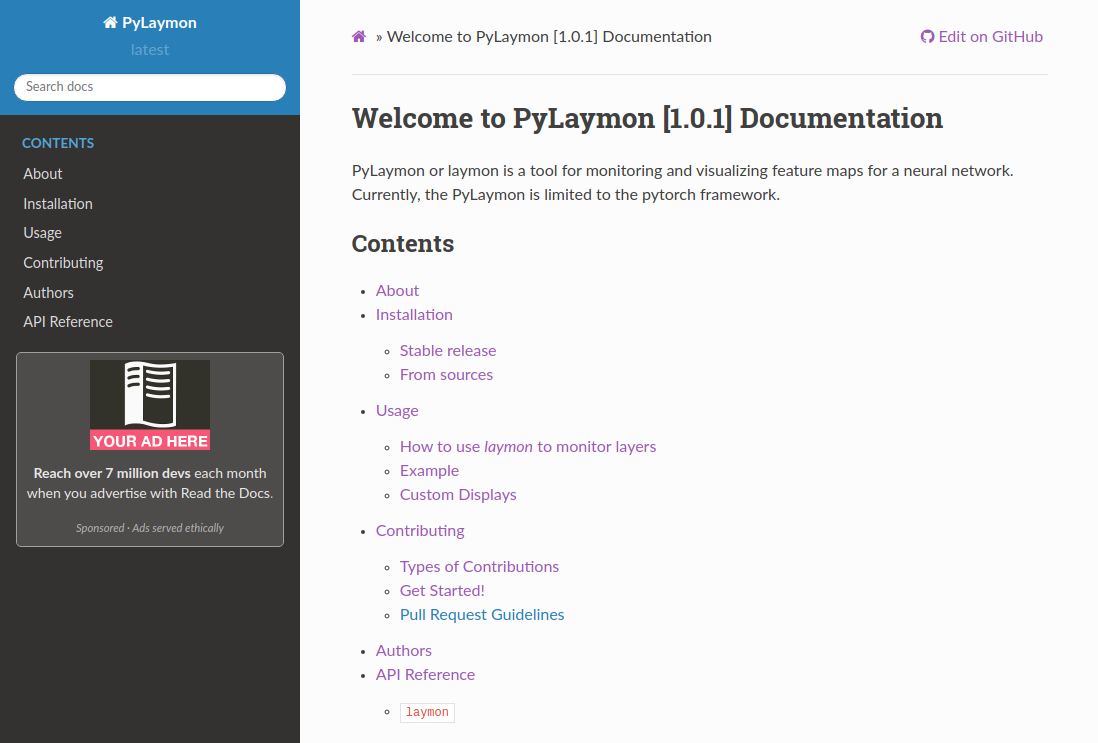
The project maintains documentation that is hosted using readthedocs. The documentation follows the sphinx format with the ability of automatic API/ class documentation. The package is versioned and maintained on PyPi. The project also follows coding best practices and uses flake8 and black libraries as pre-commit hooks.
Challenges I ran into
The main challenge of the project was to define an architecture through which one can easily add or remove layers that need to be monitored or visualised. Also, the architecture should be abstracted to a level such that a developer can define his/her custom displays, monitors, or observers.
Finally, creating a display to visualise the feature maps using matplotlib was quite challenging, as one has to maintain a mapping of which display/plot held data to which layer and update those plots when new data arrived.
Accomplishments that I'm proud of
Designing, developing, and deploying an end to end solution to a problem in a mere 20 days is the proudest accomplishment for me.
What I learned
I learned a lot in the process, from exploring different design patterns to understanding PyTorch's internal code and finally, building, hosting, and documenting a PyPi package from scratch.
What's next for PyLaymon
The journey does not end here, its just a beginning for PyLaymon. I have already started drafting the road-map for the next version. For example, the updates to the plots in the current version happen synchronously which affects the training time of the model. In the future release, these updates would be async with more inbuilt displays and monitors to capture other aspects of the network such as total loss function or loss at each layer. Also, I have made the project open-source, so contributions are most welcomed.


Log in or sign up for Devpost to join the conversation.