-
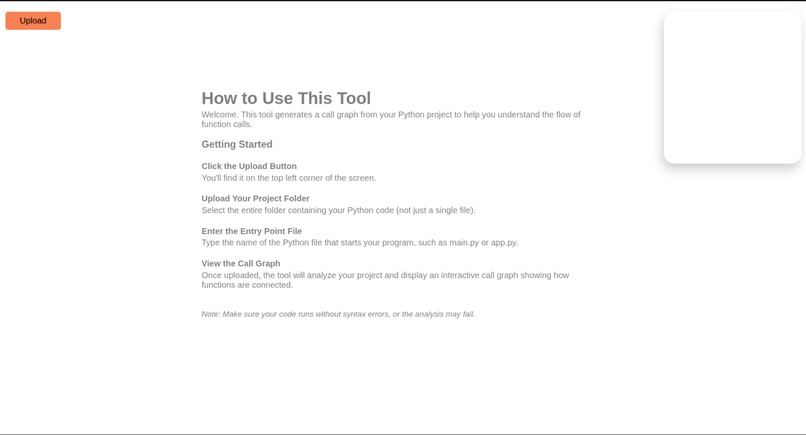
this is the main page
-

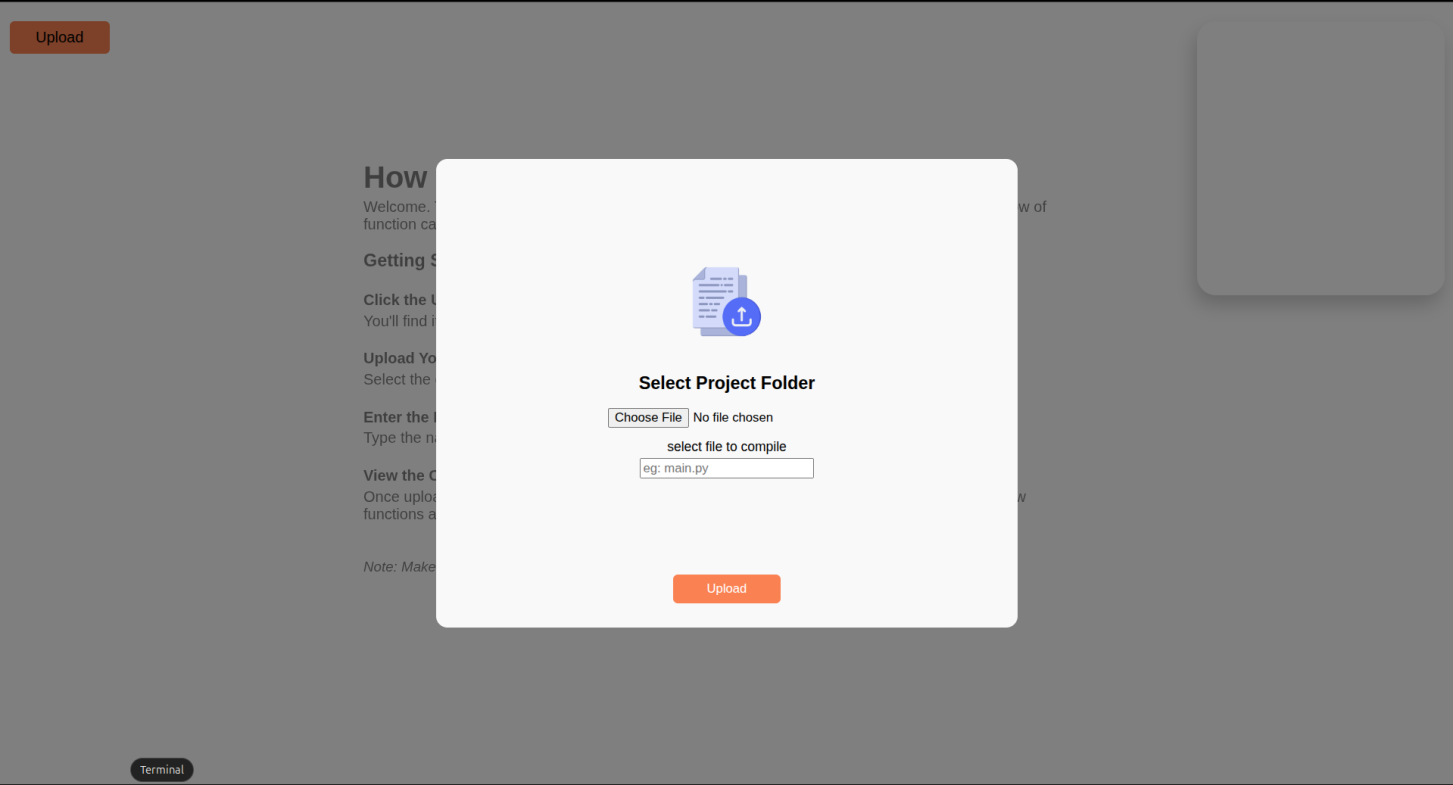
this is the page where the user uploads the folder and chooses the enrty file
-
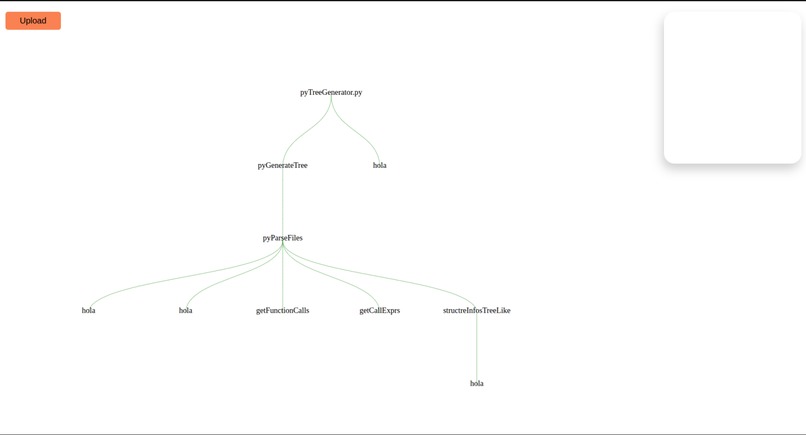
this is the result
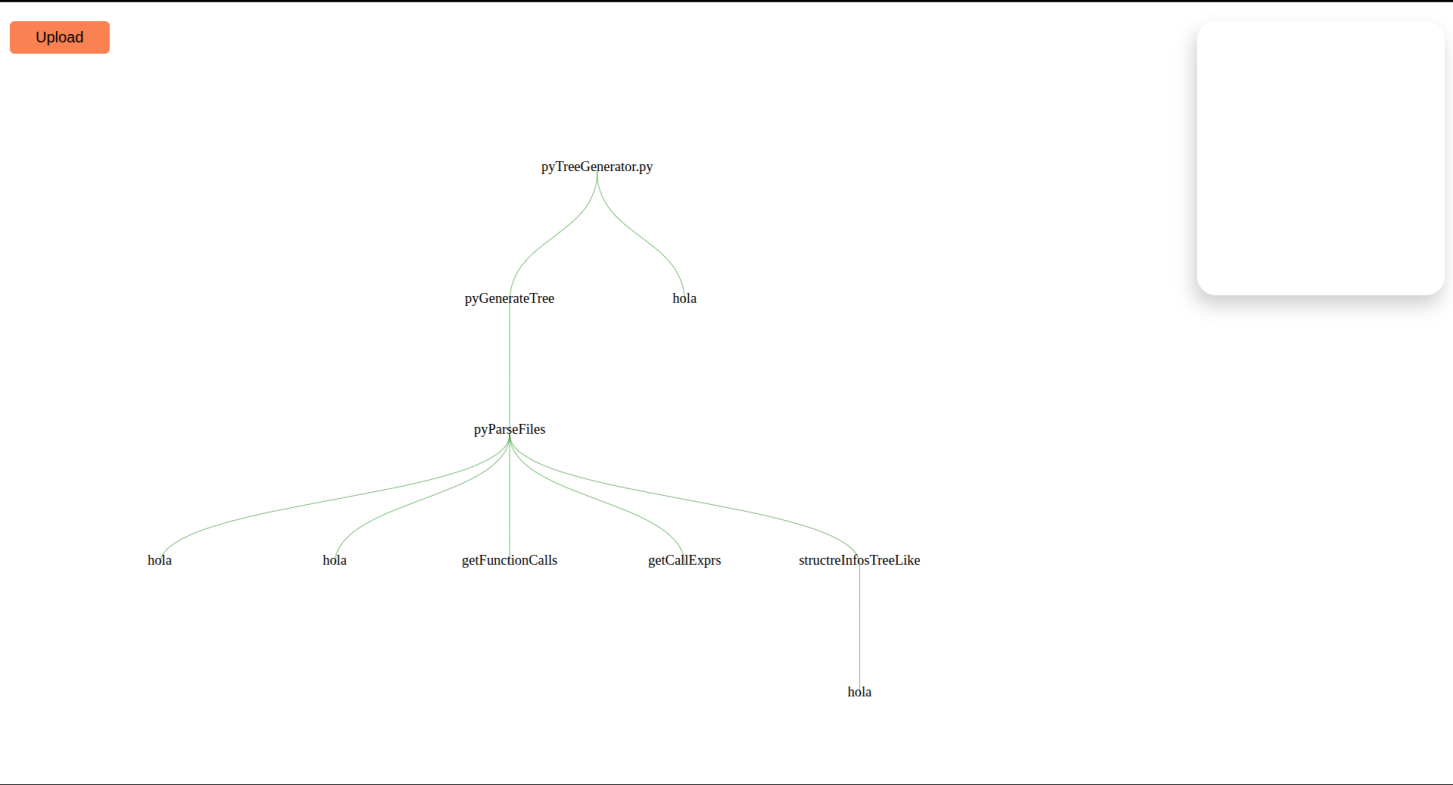
What Inspired It
As developers, understanding the flow of a codebase—especially in large Python projects—can be time-consuming. I wanted to build a tool that makes it easier to visualize how functions call one another, helping users get a high-level view of their program’s structure quickly. This tool is especially useful for onboarding, refactoring, or debugging.
How It Works
The web application allows users to upload a Python project folder and specify the entry point (e.g., main.py). The backend then analyzes the codebase to generate a call graph, which is rendered interactively in the browser. Users can click on nodes to inspect function details and better understand the code flow.
Tech Stack
Frontend: D3.js to render interactive SVG-based call graphs Backend: FastAPI, a modern Python web framework Parsing: astroid, a powerful library to statically analyze Python code and extract function relationships Deployment: Docker, to isolate and manage the environment and analysis process cleanly and securely
Challenges Faced
Handling complex Python code structures and maintaining accuracy when parsing function calls Preserving responsiveness and interactivity in large graphs with many nodes Managing user uploads and file processing securely and efficiently inside Docker containers Designing an intuitive UI that balances technical detail with usability
What I Learned
Through this project, I deepened my understanding of Python’s AST (Abstract Syntax Tree) tools, Dockerized development workflows, and how to combine data visualization with backend logic. I also gained practical experience in architecting a full-stack tool for a very technical and specific use case.
(note: i am still working on it i just need to include more details about the each function node and that pretty much it)
Built With
- d3.js
- fastapi
- python
- typescript

Log in or sign up for Devpost to join the conversation.