Project
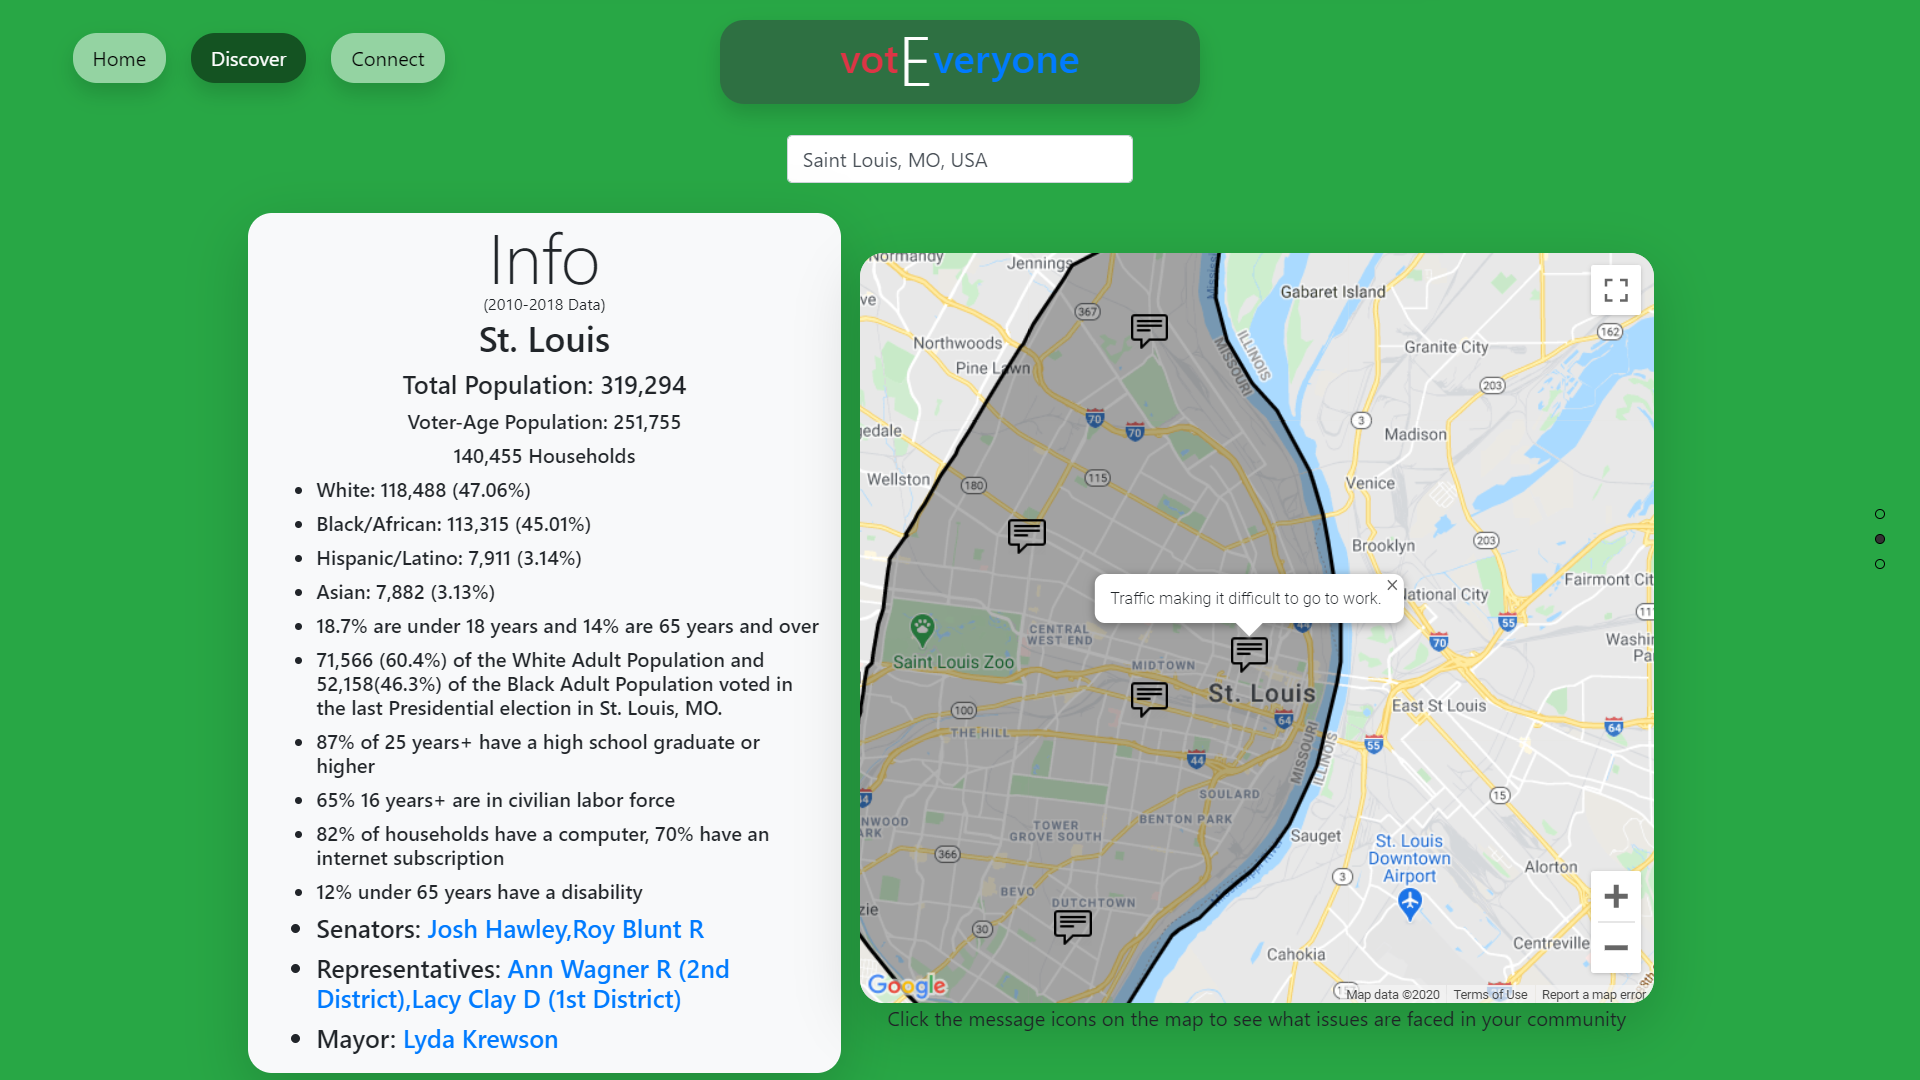
Connecting voters by presenting issues in their community from anyone and everyone to include everyone's perspective when a voter votes. The project uses US Census data, google maps, and other public voter data to inform voters with visual graphs and information. Users are able to enter their city and view detailed demographics, issues, and current political information of their community. Users can also submit their own issues for others to see in their community.
Inspiration/How this relates to Inclusivity
"The ballot is stronger than the bullet” - Abraham Lincoln
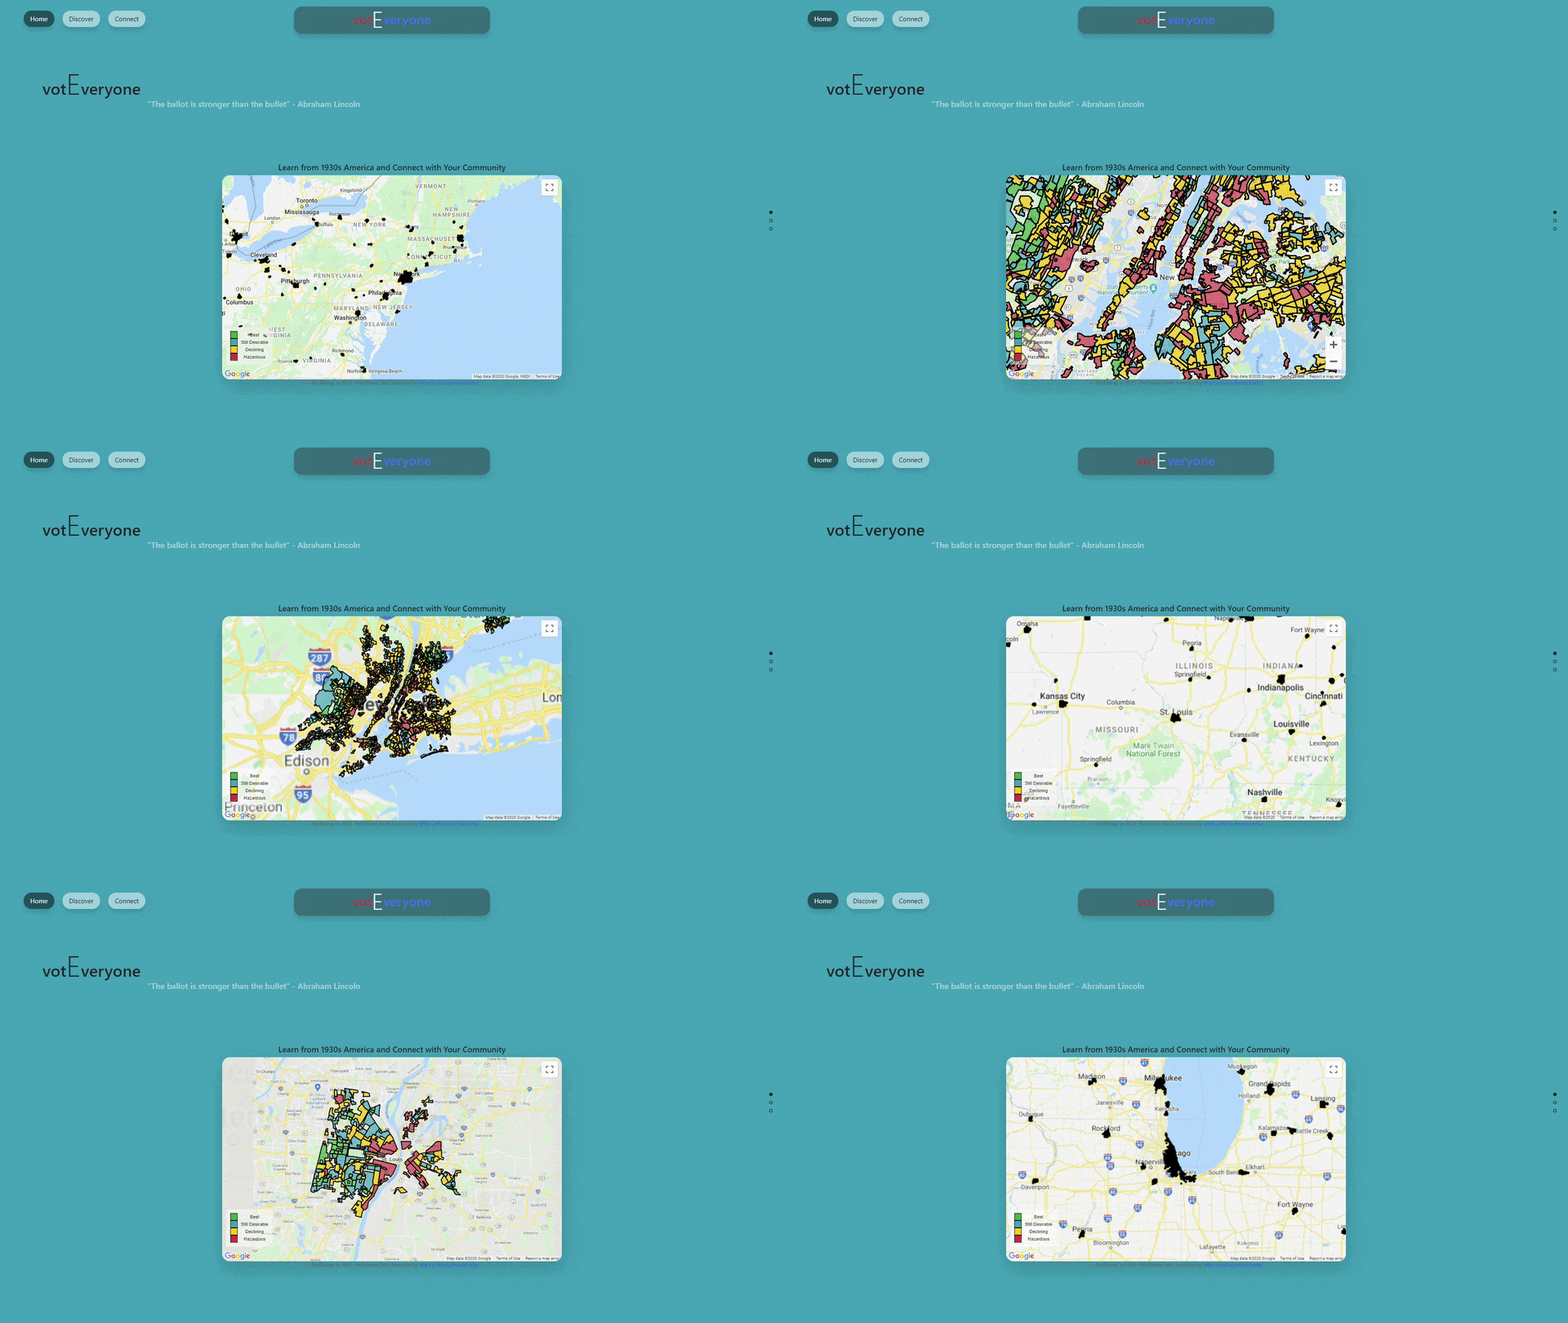
We were inspired by this map of inequality due to redlining in 1930-1940. Redlining disenfranchised and belittled minority voters, and there is strong evidence that redlining still affects communities today. So we want to connect voters as much as possible in communities with a variety of perspectives on current issues.
How we built it
- Setup node.js web app using Express
- Created simple elagent page using Bootstrap css and Pagepiling.js
- Access US Census data through CitySDK
- Obtain locations and display US Census data with Google Maps API
Built With
- citysdk
- css
- google-places
- javascript
- node.js
- pug

Log in or sign up for Devpost to join the conversation.