PyDinsky
PyDinsky team repository for McGill Physics Hackathon 2020
Why Pydinski
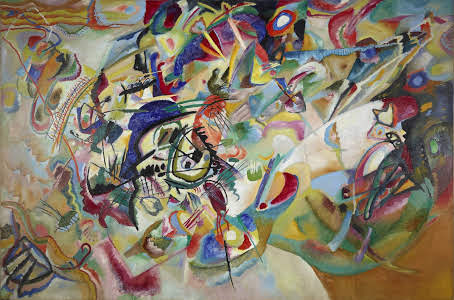
We're creating generative art with user input and elements of randomness. Our name is a play on Wassily Kandinsky, a Russian painter who pioneered abstract art and used bold colors liberally in his work. Prior to Kandinsky's contributions to mainstream aesthetic theories, what we now call abstract art was rejected as a true art form. To this day, there is a stigma around abstract art.

"What is up with that painting?", you might have heard, or "My three-year-old nephew could have painted this rubbish." This perspective misses a key aspect of art: what emotions do you feel when looking at a piece? Kandinsky argued that abstract art could be equally emotionally impactful as more representative works. He drew comparisons to other art forms, such as music, to argue that simple colors arranged in non-representative ways could move the viewer. Fortunately, paradigm shift has promoted the creation of abstract pieces all over the world, in a diverse and inclusive way. PyDinsky is our modest attempt to be part of this movement and hopefully, you, the viewer, will be moved by what you see here.
The Concept
The phenomena of heat diffusion is somewhat familiar to all. Indeed temperature fluctuations and "movement" is part of our everyday experience. A phenomena inheretly linked to temperature and diffusion is that of random walks. This is NOT a concept trivially known to all. With our project, we chose to represent artistically those aforementioned random walks on the stage of the earth. Their trajectories are based on the live local temperatures at different cities in the world.
The "Physics"
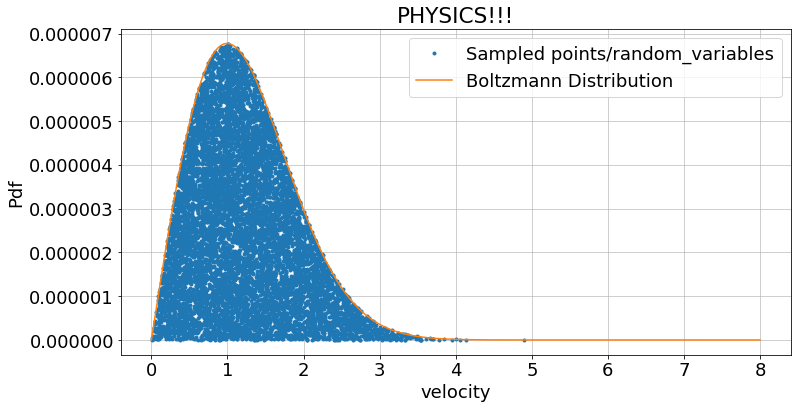
The Physics of our project is based around the velocity for a given temperature following Boltzmann distribution. Every image you generate will be different because we implement random walk methods that follow this Boltzmann distribution and are seeded with actual temperature from a given city.

Random variables are sampled from this distribution, with the step size at each iteration depending on the temperature of the city.

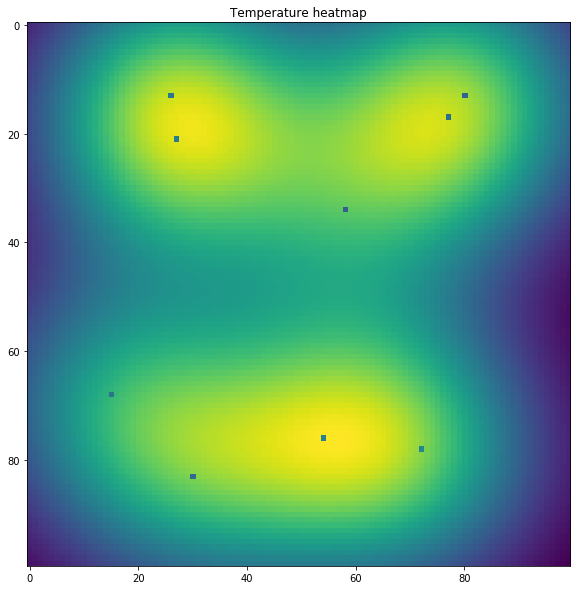
Additionally, we implement a routine to approximately extrapolate temperatures over the entire x-y range to obtain temperature at each position on the walk and use this to modify the distribution during run. We then plot the trace of the walkers using a custom-designed color scheme that accords with the given temperature ranges.
Use Your Favorite Cities to Generate Images
The color schemes used for the walkers are generated using the current temperature of the cities of your choice, pulled from the OpenWeather API. A cold scheme for a colder day, a warm scheme for a blazing hot day, and a medium scheme for everything in between.
We used the Bokeh python package to generate an interactive web app. You can pick from a list of cities and the weather API is queried for the current temperature. The website is the deployed using Heroku. You can now add as many cities as you like!
Welcome to the paartyyy


Log in or sign up for Devpost to join the conversation.