-
-
Overview
Inspiration
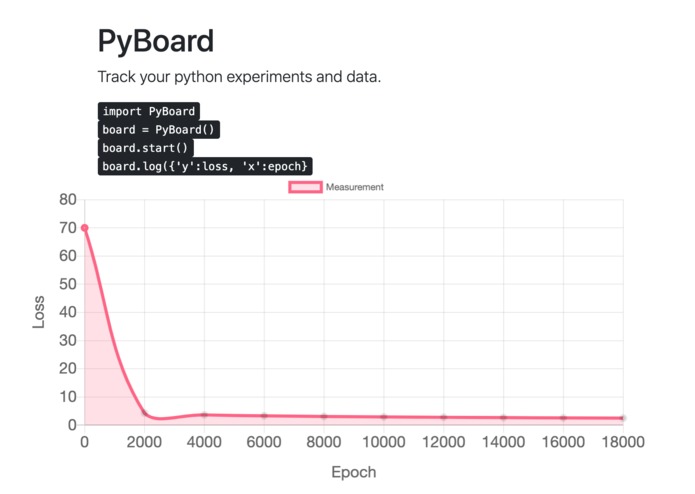
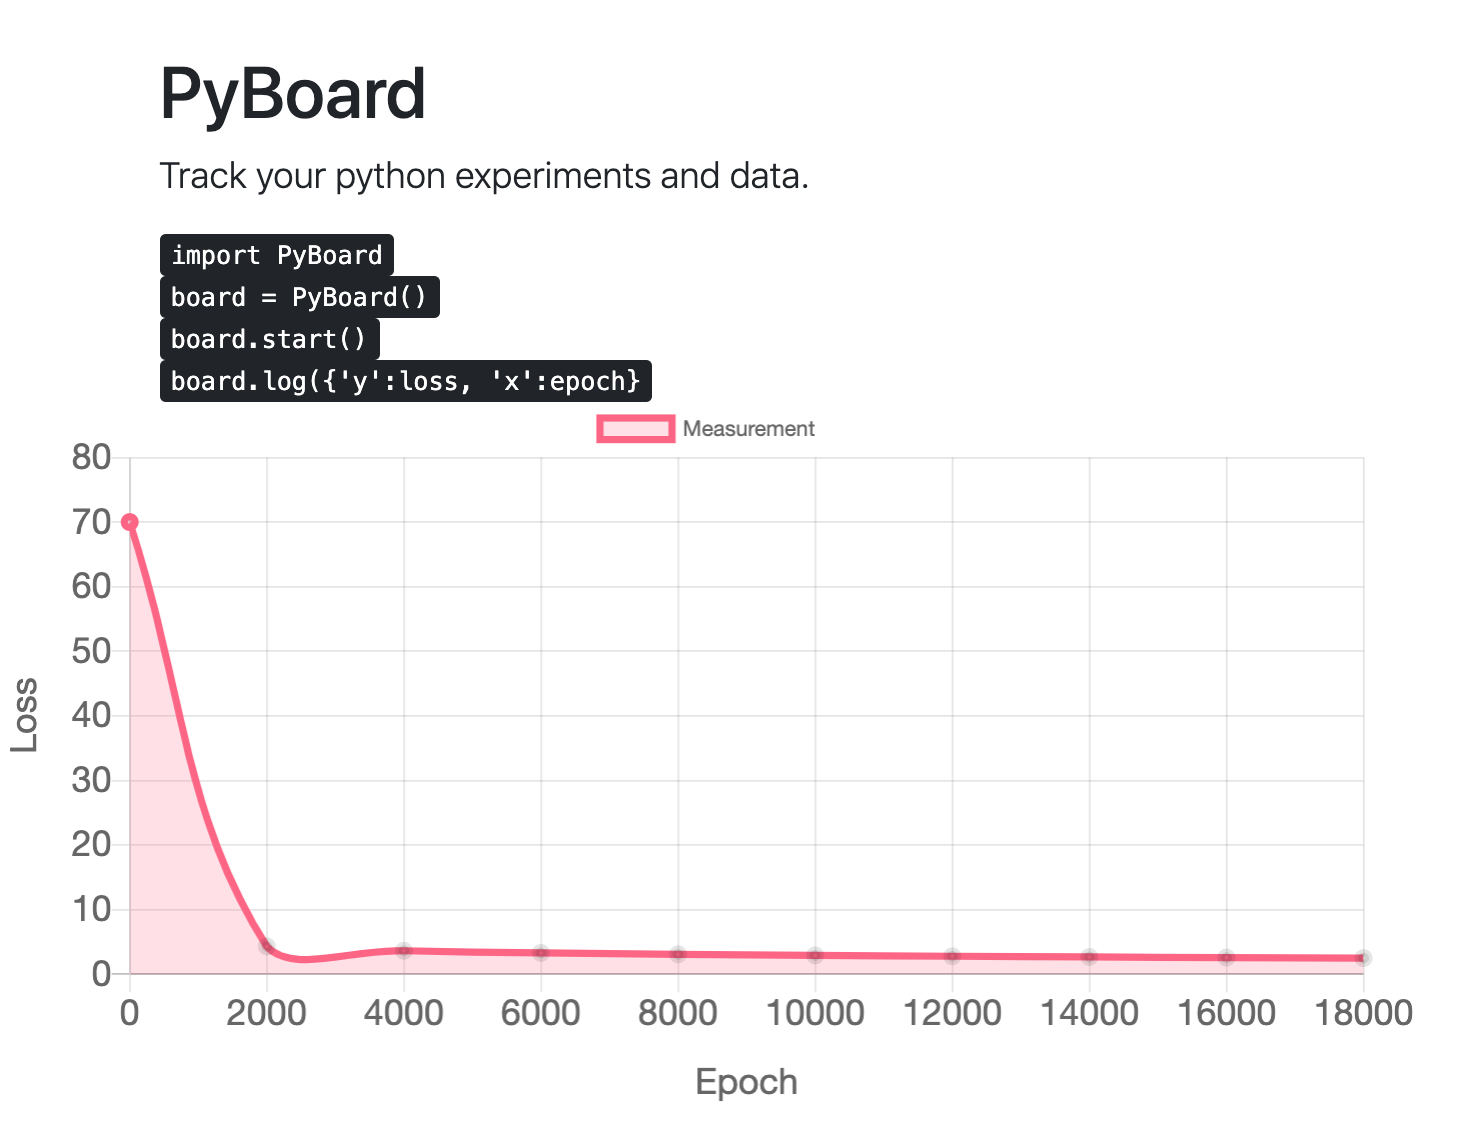
In Python, using print() statements to output information quickly in the terminal is very popular. However, reading from the terminal is most often an unappealing and even flow corrupting approach. The terminal also only provides textual interpretation, whereas nowadays much more appealing visuals can be made. These painpoints motivated us to come up with a simple but effective solution, particularly appliccable for situations where long and extensive print() sequences are to be avoided.
What it does
Passing on log/debug data easily and graphically to the web browser. The main focus is now on graphically representable numerical data, which is very nice to picture in a graph rather than in a terminal. Examples are applications in Machine Learning (demo is provided), Temperature monitoring and Healthcare prototyping. Our approach runs completely locally, so all data remains on your machine and nothing is passed on to the cloud. Despite this locality, it is accessible through the internet (and mobile) via the free ngrok service.
How we built it
Flask backend, Chart.js frontend, sockets.io.
Challenges we ran into
How to have Flask web server not terminate while running our regular script (Machine Learning).
Accomplishments that we're proud of
In very short time, very practical too to use. Easy, simple monitoring of a single variable. Easy to extend.
What we learned
How to make the Flask server initiate updates on a javascript front-end (vs vice-versa which is more common), using sockets.io. Becoming better at constructing a REST api and making salient visualizations.
What's next for PyBoard
Extension to multi-meter graphs/information. Going after big brother TensorBoard, but more general than that: enabling more insightful development and testing for all pythonians!


Log in or sign up for Devpost to join the conversation.