-

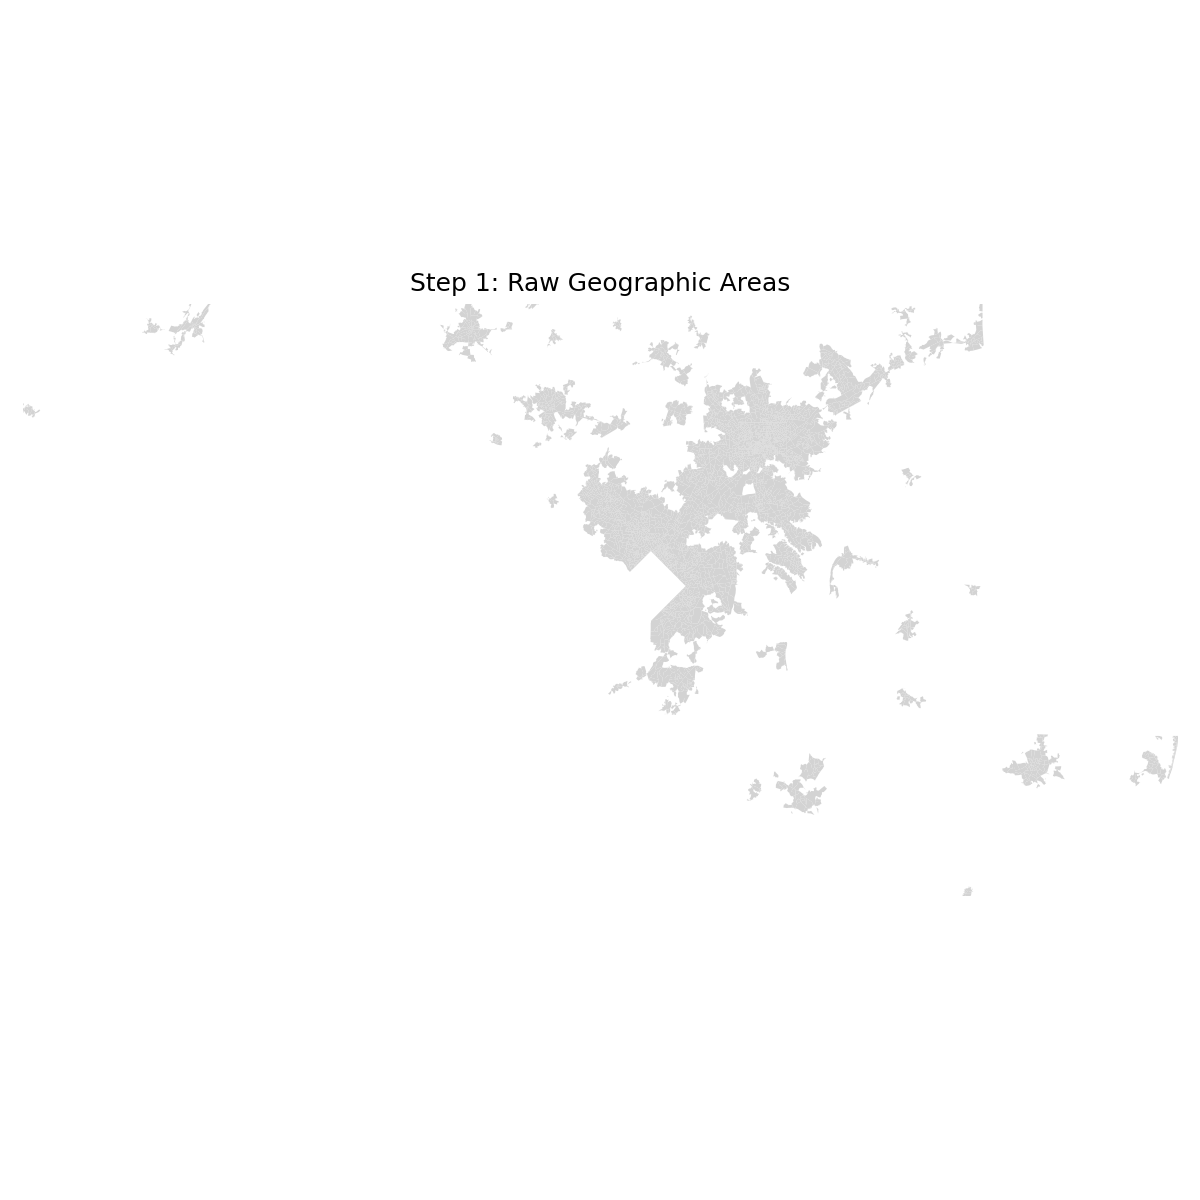
Reading the data, collecting raw geographic points
-

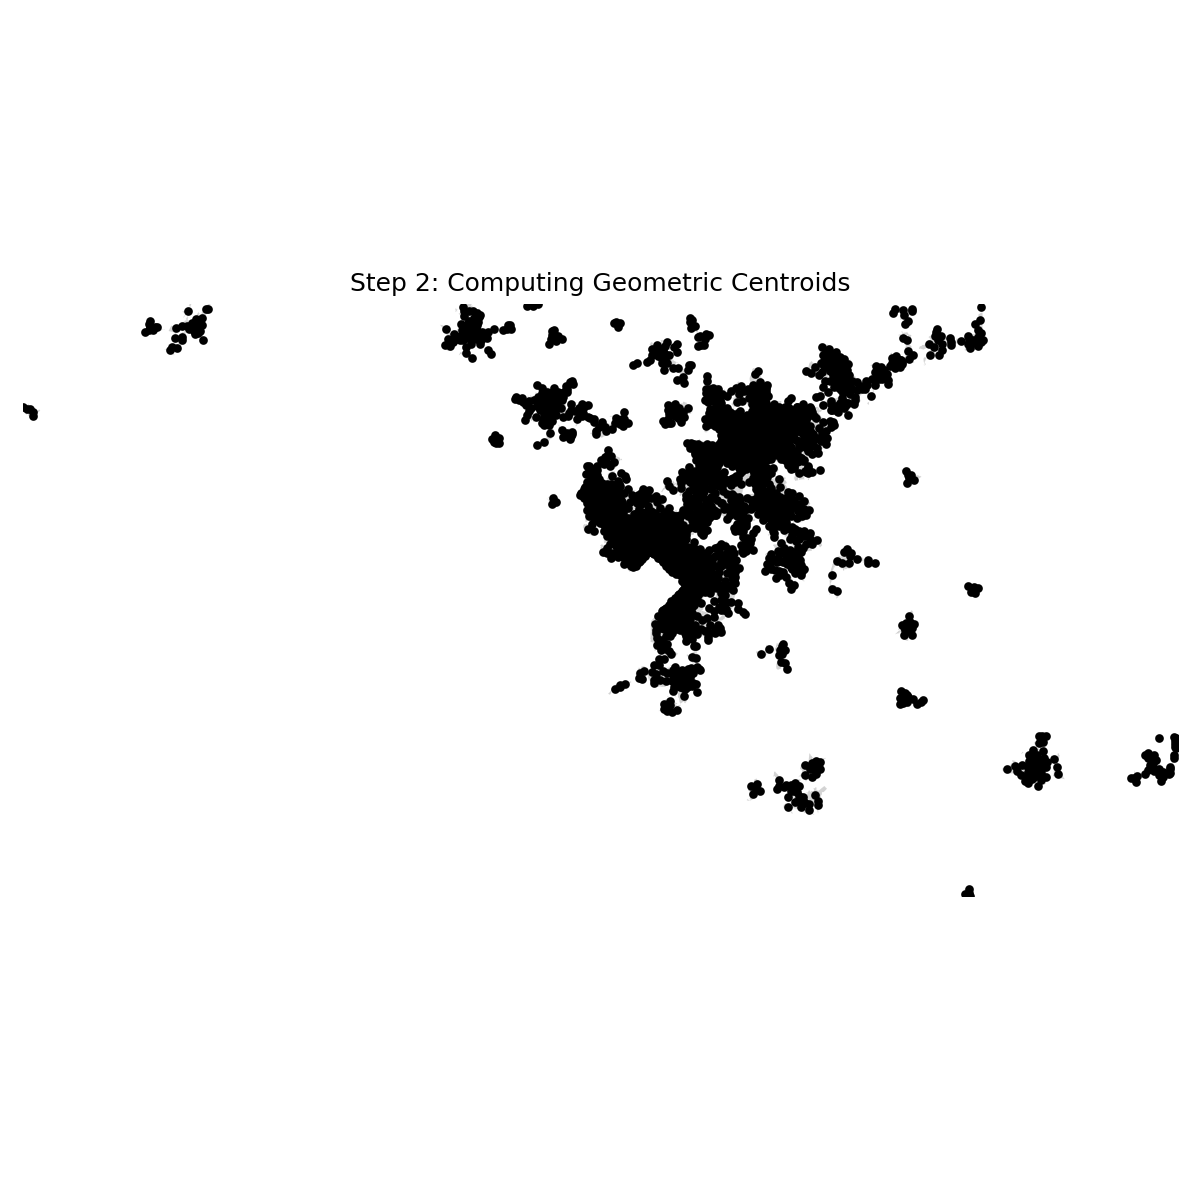
Computation of geometric center given many geographic points
-
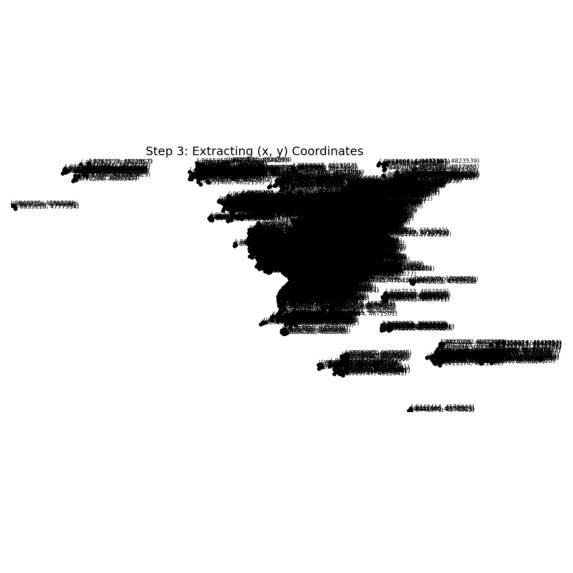
Extracting the (x,y) coordinates of points of interest
-
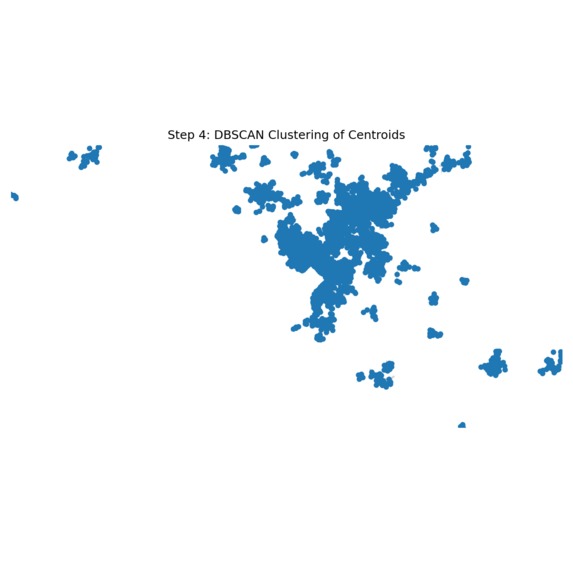
DBSCAN clustering to determine ideal points
-
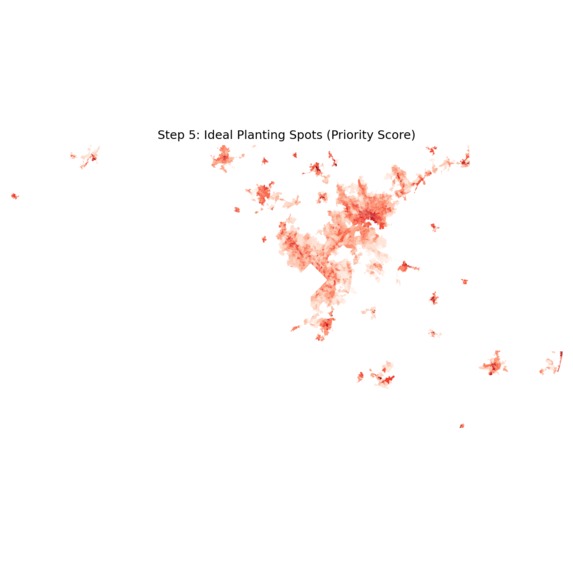
Showing found ideal points for planting
-

TES graph of Maryland, showing the raw data visually
-

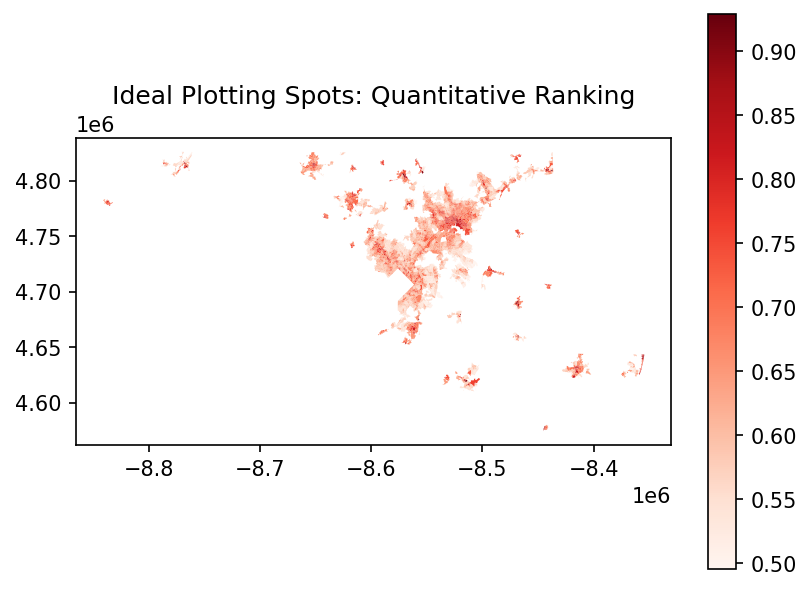
After calculations, shows the ideal places for planting
-
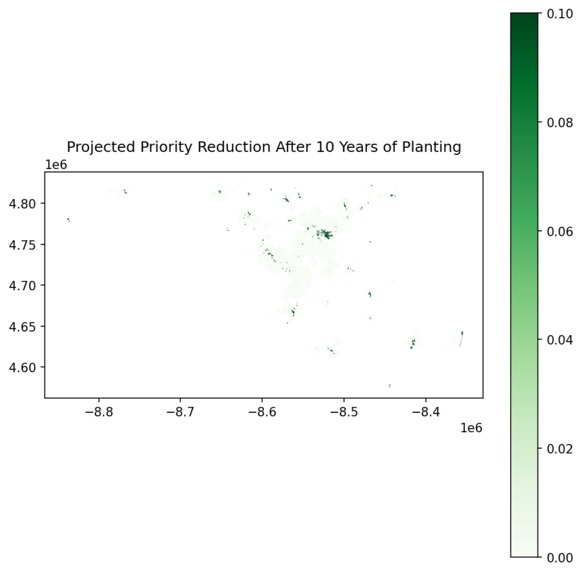
Predicted change of environment through TES score if followed through


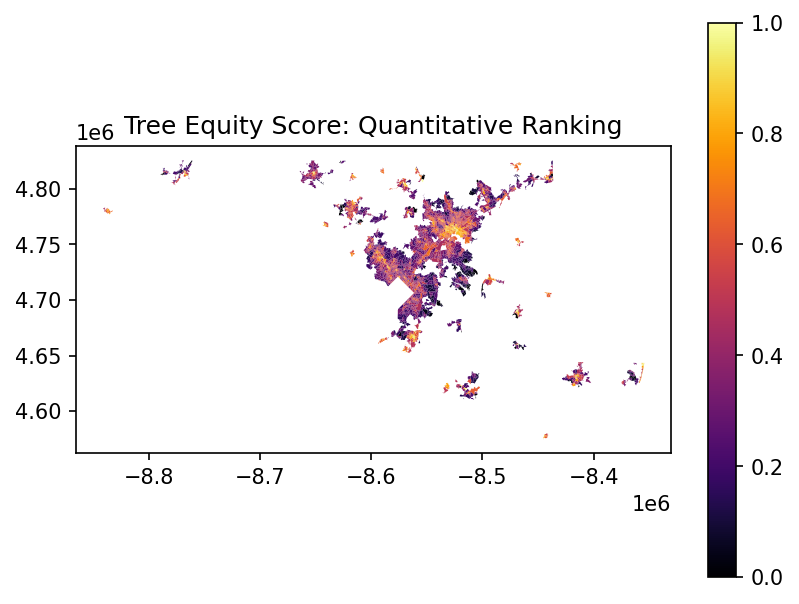

Quantitatively, trees are essential, and the Tree Equity Score (TES) measures percent-wise the efficacy of tree presence, with lower numbers dignifying areas, often urbanized or lower income, that would benefit from an increase in tree planting; a variety of social and individual benefits arise from this uptick, such as better health and thrive of ecosystem.
My project takes the data available on the TES official site and geometrically calculates ideal places for planting trees, prioritizing efficiency rather than relying on individual 'guess-work'. A third plot predicts the began resolution if the marked points are successfully planted on over a ten year period, and the greatest decrease would be around 10%.
Users can also visit a 'game mode' of viewing the data, which formats the same plot representing ideal planting spots as a 3x3 puzzle. When complete, a small pixelated cat appears and jumps up and down. This cat is inspired by my pet cat at home in North Carolina :)
The data and map are on a smaller scale because the code only references data from the state of Maryland.


Log in or sign up for Devpost to join the conversation.