-
-
PulseU Strain Score and Plan
-
PulseU Dashboard Baseline
-
PulseU Auth0-login
The problem
Most productivity apps treat every hour as equal. They'll happily tell a student running on five hours of sleep, who hasn't eaten since breakfast, to knock out four more hours of studying. They have no idea what kind of day you've had, and no idea what a normal day looks like for you specifically.
What PulseU does
You sign in and fill out a ten-second morning check-in: hours slept, current energy, current mood, and what's on your plate today. No AI involved — just what you already know.
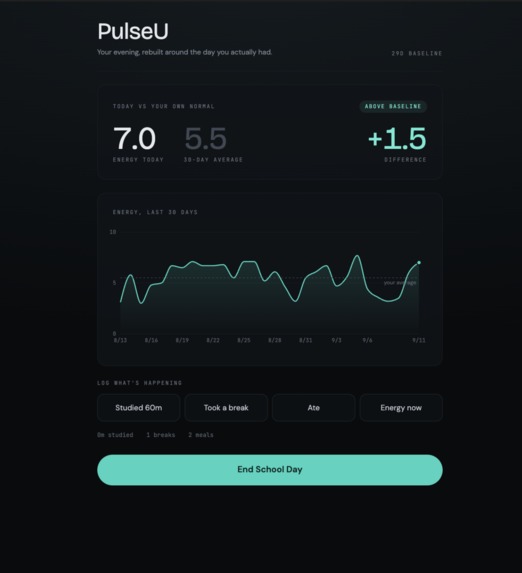
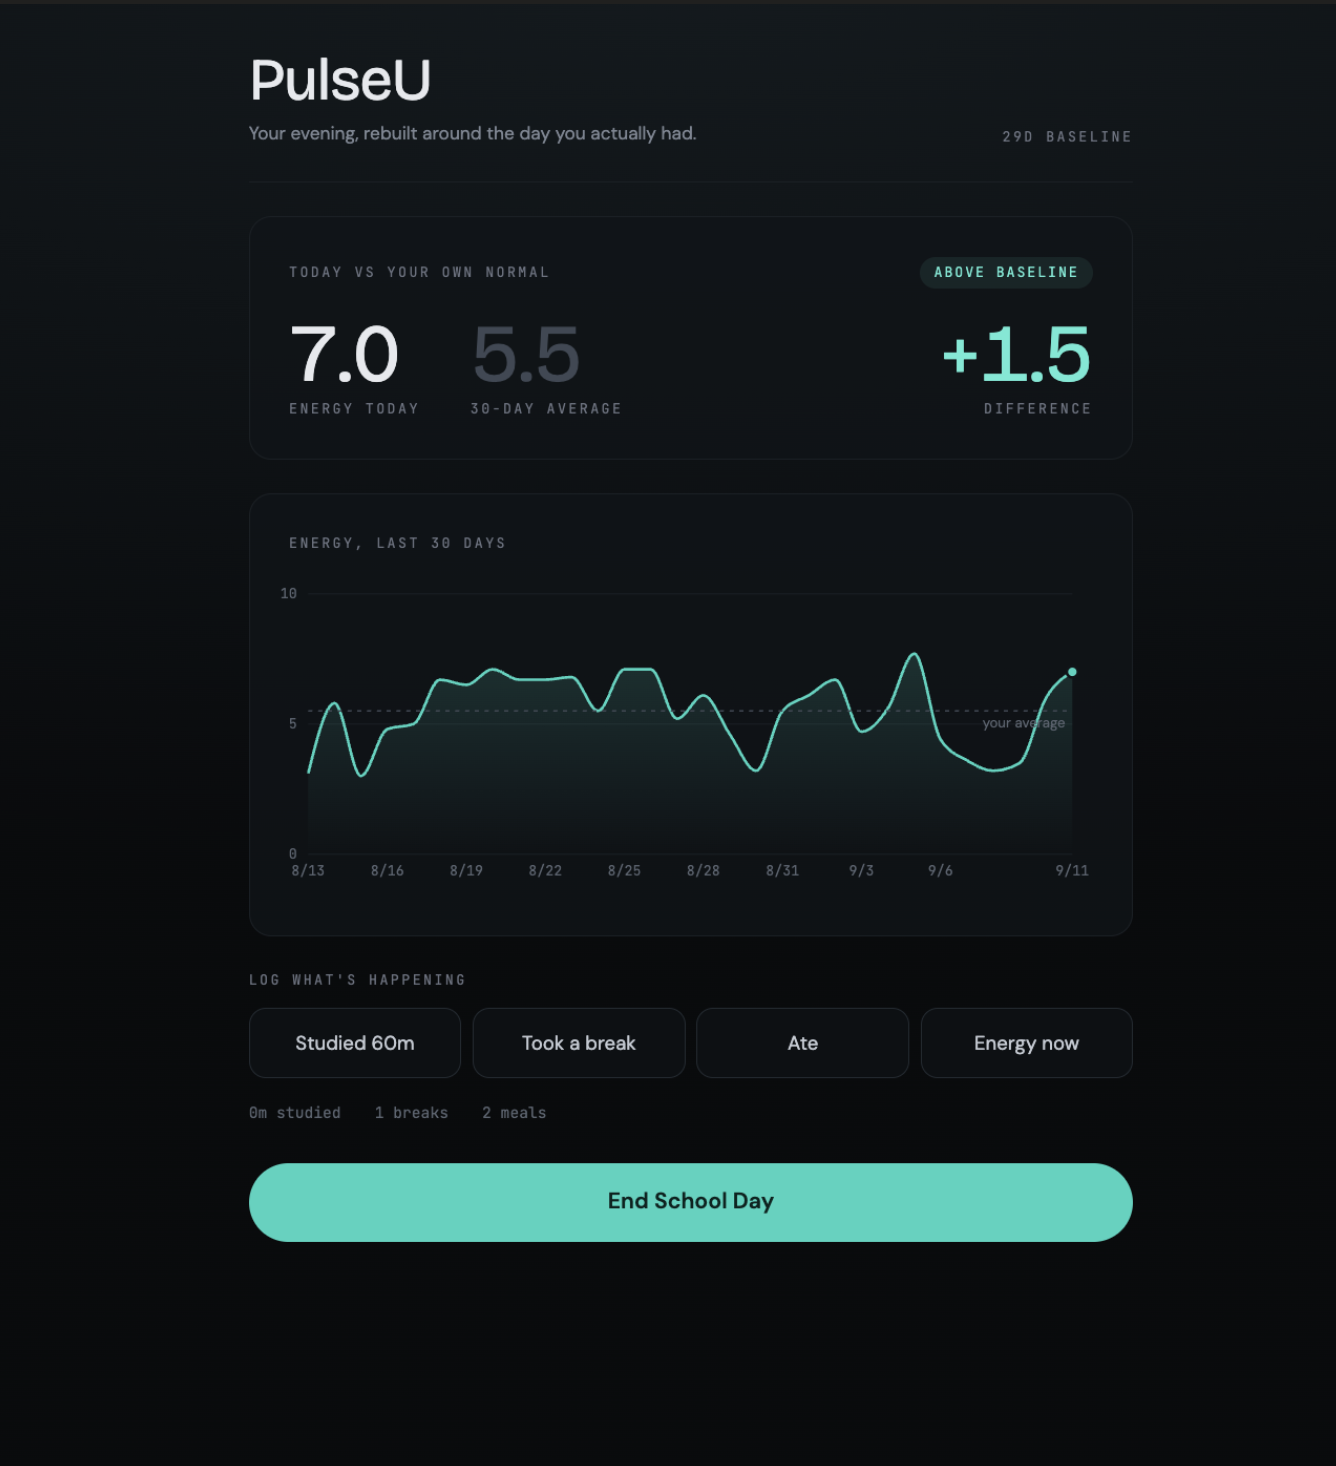
Through the day you tap four buttons as things happen: studied, took a break, ate, energy check-in. Every tap is timestamped and stored. The dashboard shows today's energy against your own 30-day average, plus a chart of that history.
When classes end, you hit End School Day.
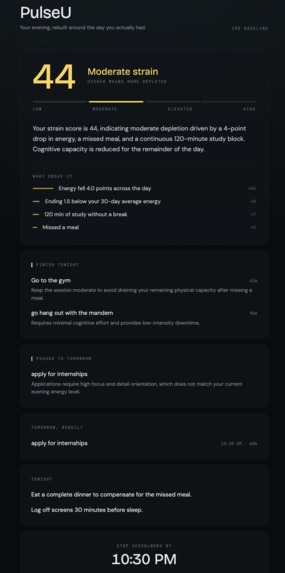
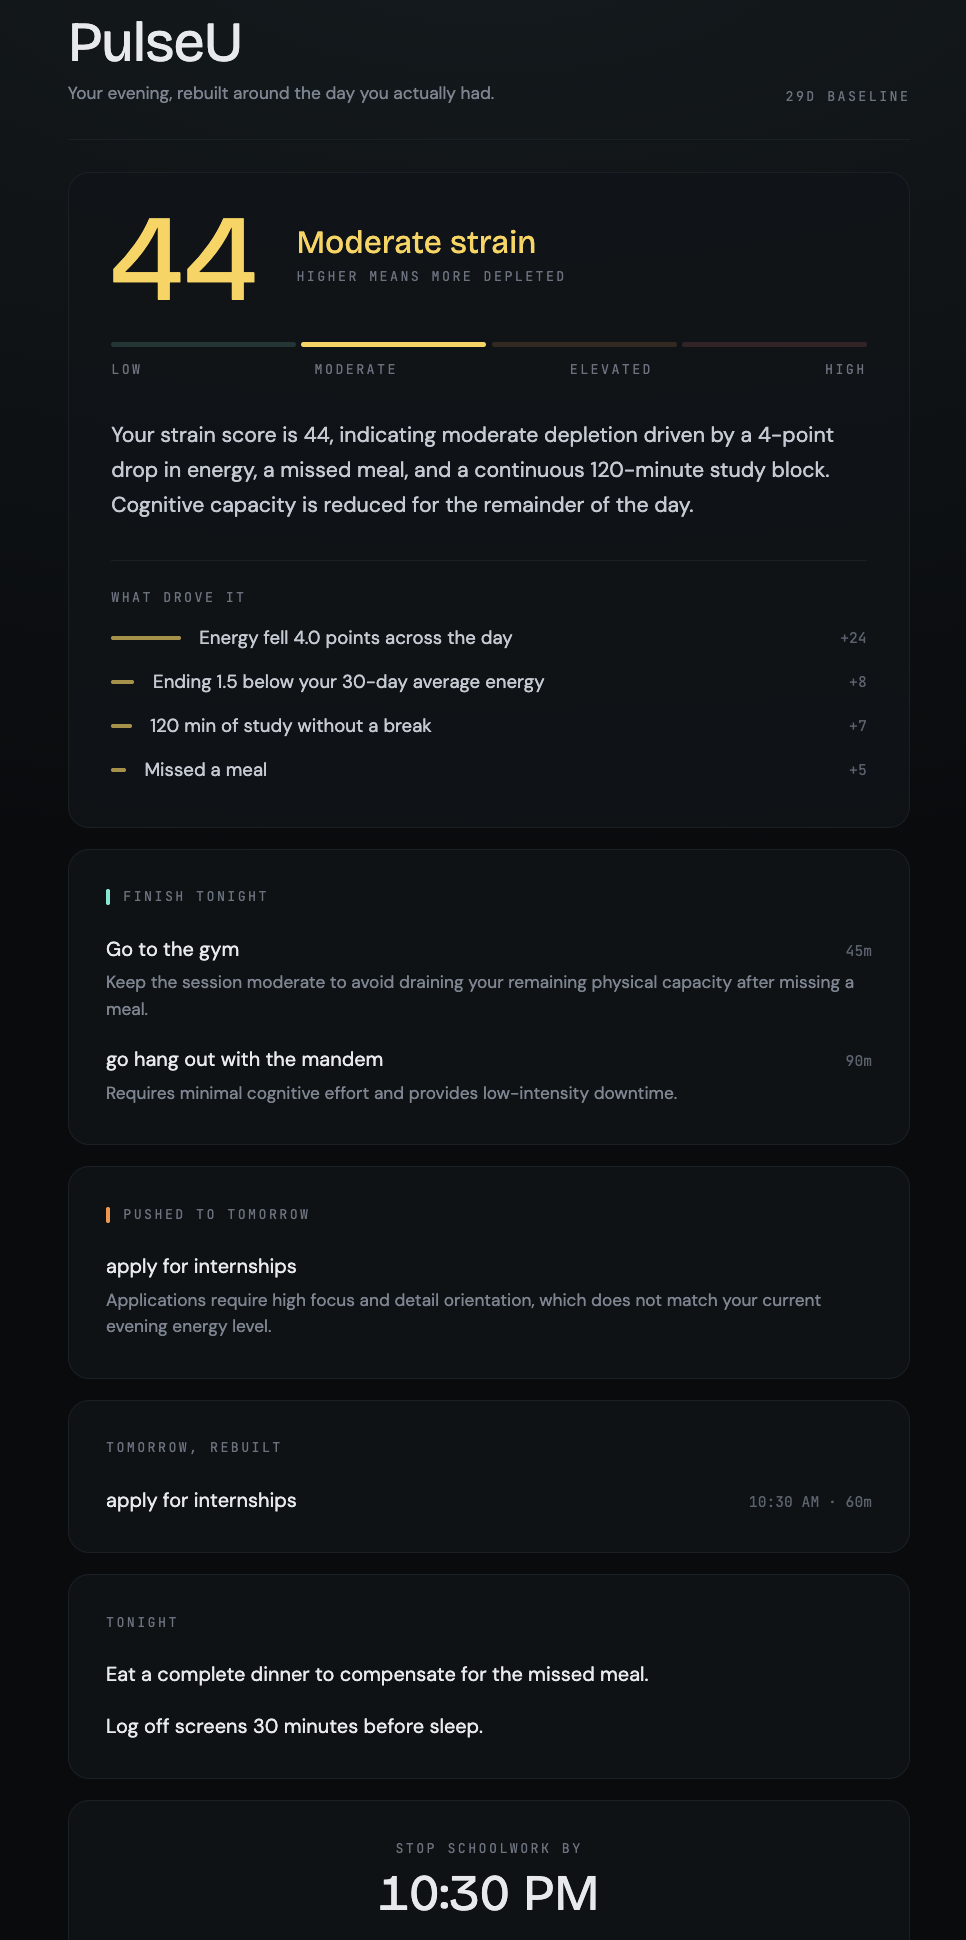
A strain score appears — 0 to 100, where higher means more depleted — with the specific factors that produced it, weighted and visible. Below that: your evening rebuilt. What to actually finish tonight, what to push, concrete recovery actions, a stop time, and tomorrow already reorganized around whatever got deferred.
In our own test run, PulseU didn't cancel the gym session — it shortened it to 45 minutes because we'd logged zero meals, and moved "apply for internships" to 10:30 AM the next morning because that task needs focus we no longer had. That nuance is the point.
How it works
The score is math, not a model. About thirty lines of arithmetic weighing sleep deficit, energy decline across the day, longest study stretch without a break, missed meals, total workload, and how far below your personal baseline you're ending. It's deterministic and auditable — you can see exactly how the number was assembled.
Only then does the AI speak. Gemini receives the computed score, the contributing factors, the day's events, and your task list, and returns structured JSON. It explains and reorganizes. It never produces the number, so it cannot hallucinate a risk level.
The baseline is the point. Every event lands in a TimescaleDB hypertable. A continuous aggregate rolls those events into daily statistics automatically, which makes the headline query cheap: today measured against this student's own 30-day rolling average, not against a generic standard. That comparison is why PulseU knows a 7.0 energy day is good for you — and it's why this needed a time-series database rather than plain Postgres.
Sponsor challenges
TigerData — student_events is a hypertable holding every timestamped
action. daily_stats is a continuous aggregate rolling those into per-day
averages with a refresh policy. The core query cross-joins today's live events
against the 30-day aggregate to produce the personal baseline comparison shown
at the top of the dashboard. This is the foundation of the product, not a
storage layer bolted on.
Gemini API — One call per Recovery Mode run, using structured output with an enforced response schema so the app gets valid JSON every time. A system prompt constrains it: explain the deterministic score, never recalculate it, never use clinical language, only reference tasks the student actually listed. The call has automatic retry with exponential backoff, model fallback, and serves the last saved plan if the API is unavailable.
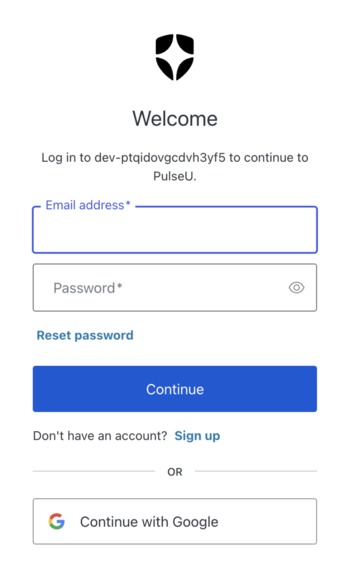
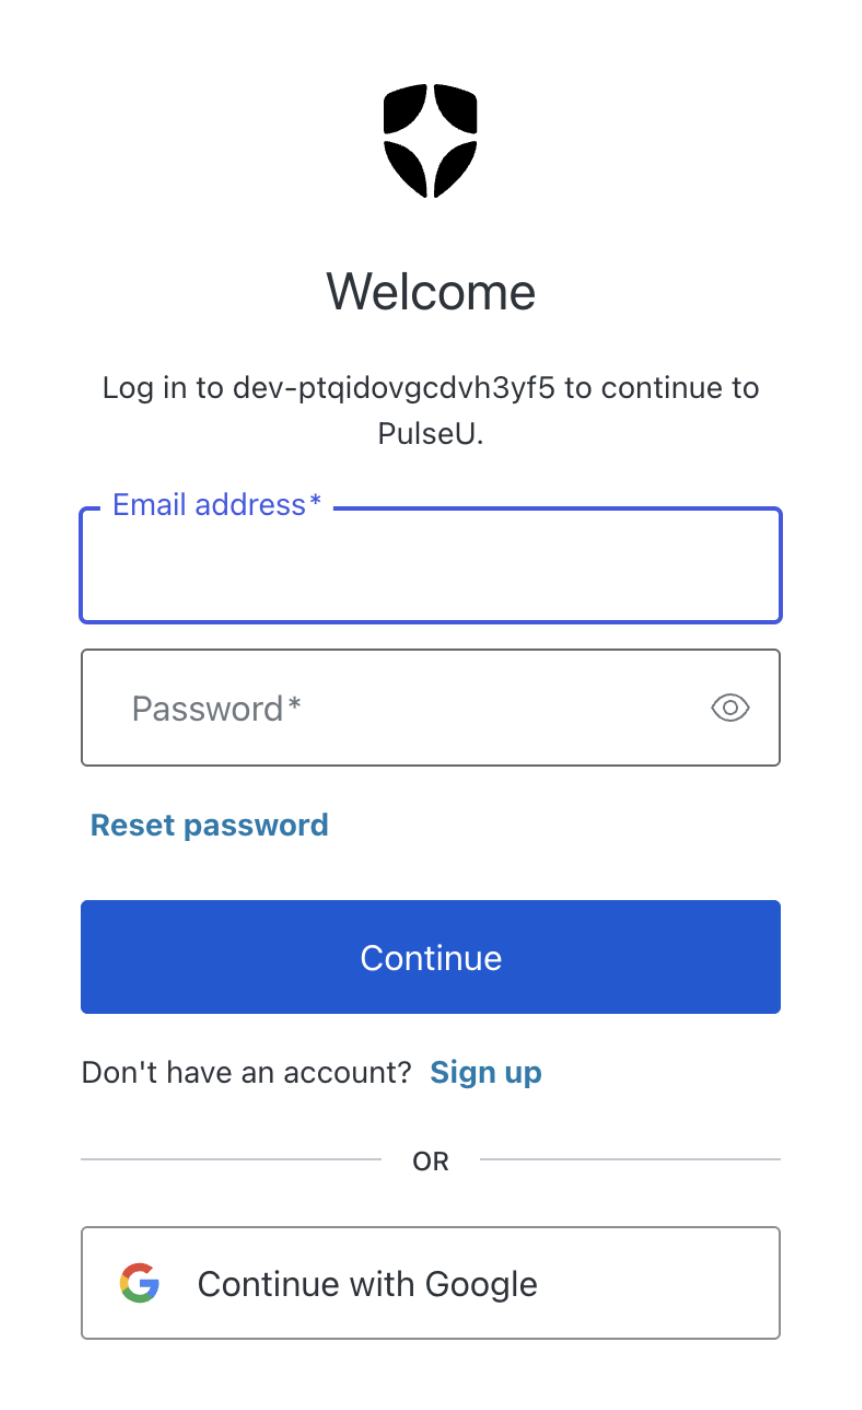
Auth0 — Hosted login with email/password and Google. Every database query is scoped to the validated Auth0 subject; the client never supplies a user ID. Sessions handled through Next.js middleware.
Vultr — Single Cloud Compute instance running the Next.js app behind Caddy for automatic HTTPS.
.Tech Domain — Live at pulseu.tech.
Best First-Time Hack — Two of our three team members had never been to a hackathon before this weekend.
Built with
Next.js, TypeScript, Tailwind CSS, Recharts, TimescaleDB (TigerData Cloud), Google Gemini, Auth0, Vultr, Caddy, Python.
Challenges we ran into
Gemini's newest model was heavily rate-limited all weekend — hackathon traffic. We handled it three ways: automatic retry with exponential backoff, falling back across model versions to a more stable one, and caching the last successful plan so the app degrades gracefully instead of showing an error.
We also hit a subtle framework issue where Next.js 16 deprecated the middleware convention Auth0's SDK expects, which silently prevented auth routes from mounting at all.
Honest notes
The 30 days of history in the demo is generated by a seed script. A personal baseline can't be demonstrated on day one, so we simulated a month of realistic student behavior — including deliberately rough days with poor sleep and no breaks — so the baseline comparison has something to compare against. The pipeline handles real events identically.
The strain score is transparent and auditable, not clinically validated. The interface calls it a "daily capacity indicator," never a diagnosis. PulseU is a wellness and productivity tool; it does not diagnose or treat anything.
What's next
Manual event logging was the right scope for 24 hours, but it's the obvious limitation. Calendar integration, wearable data, and campus systems would remove the tapping entirely. Tomorrow's plan is currently read-only; making it editable is the natural next step.
Built With
- auth0
- caddy
- google-gemini
- next.js
- node.js
- postgresql
- python
- react
- recharts
- tailwindcss
- tigerdata
- timescaledb
- typescript
- vultr


Log in or sign up for Devpost to join the conversation.