-
-
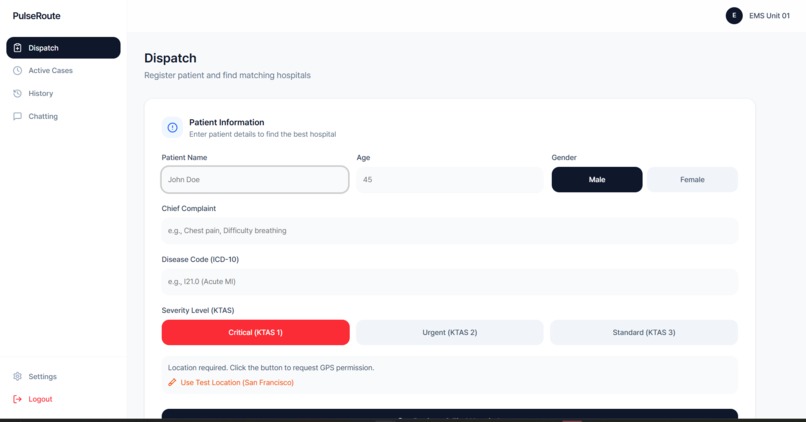
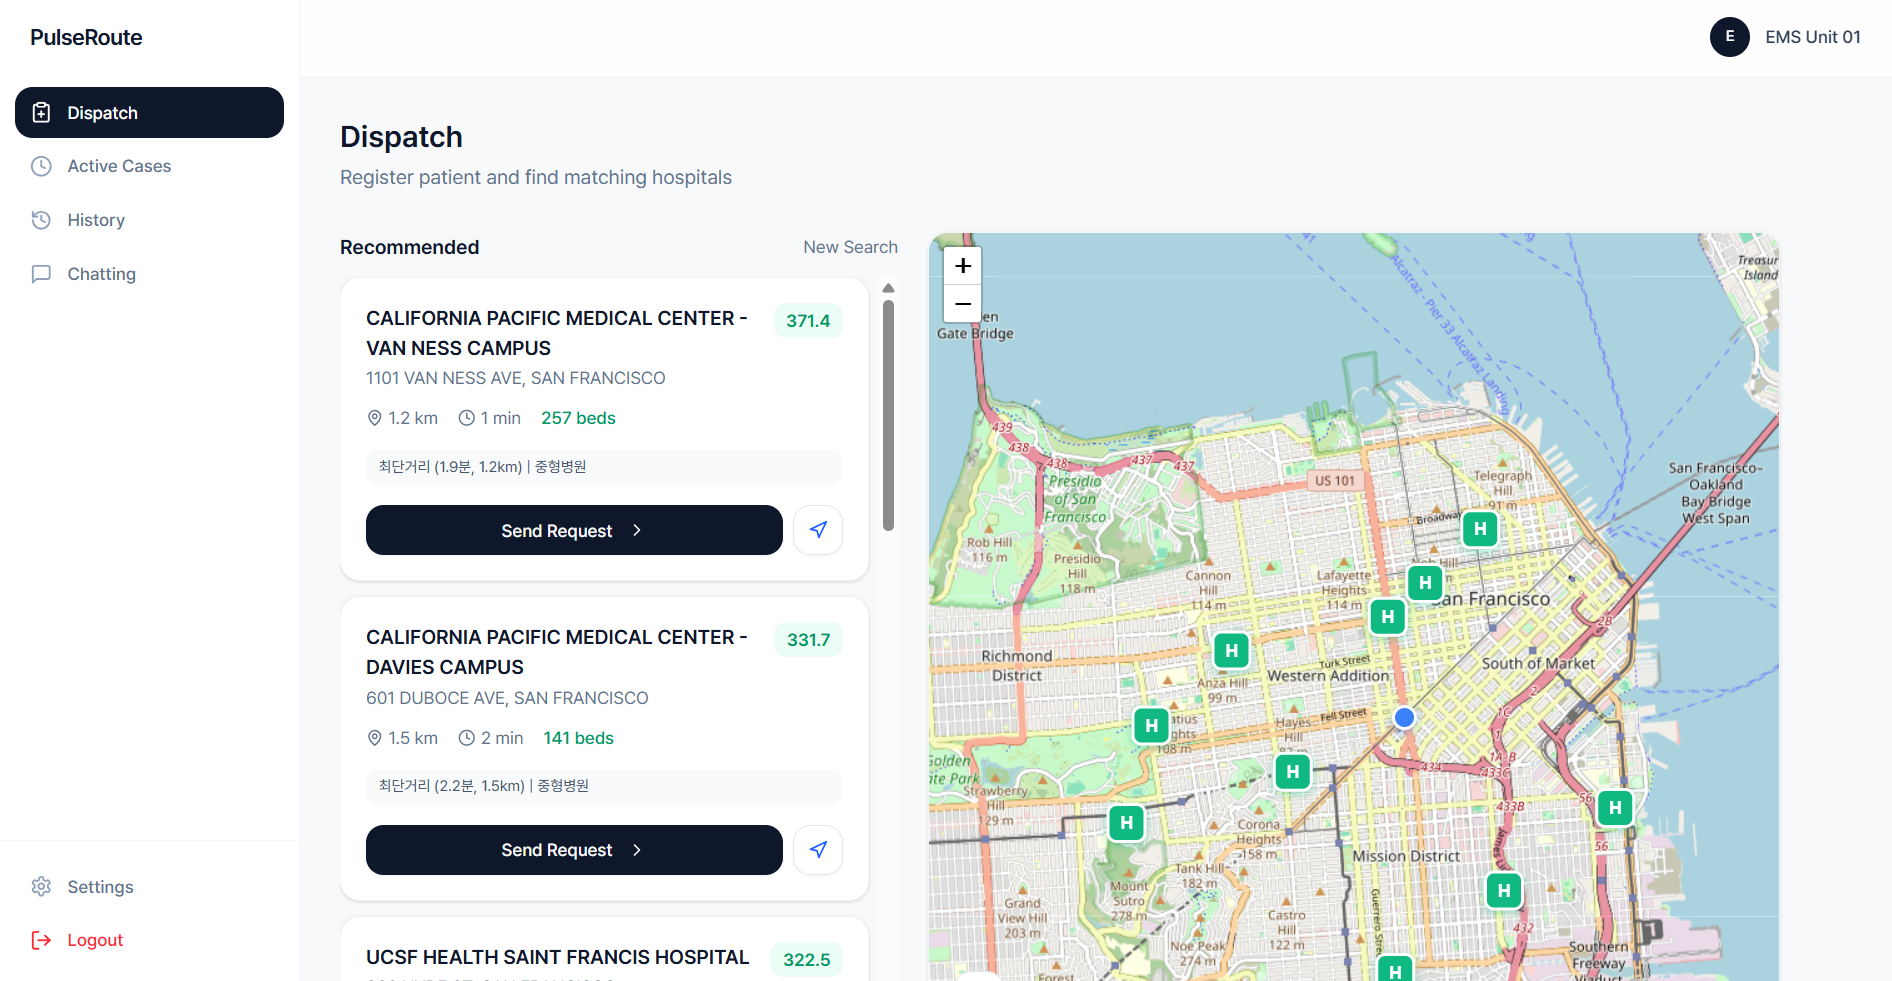
Patient Information Dashboard
-
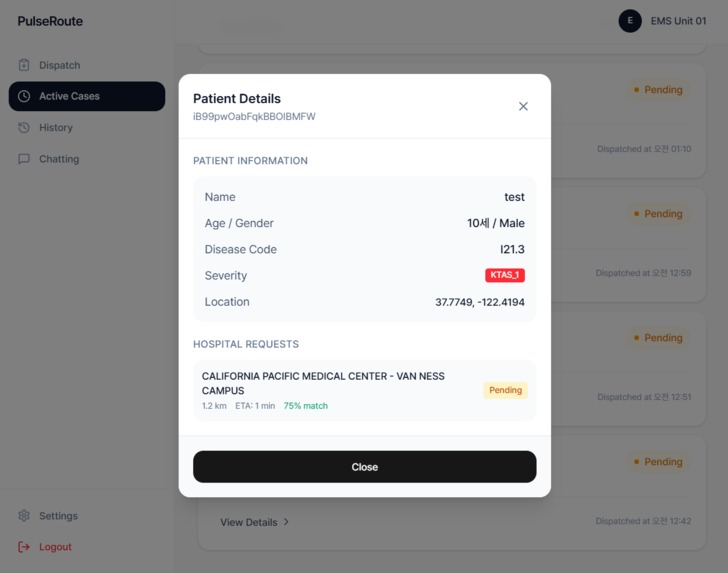
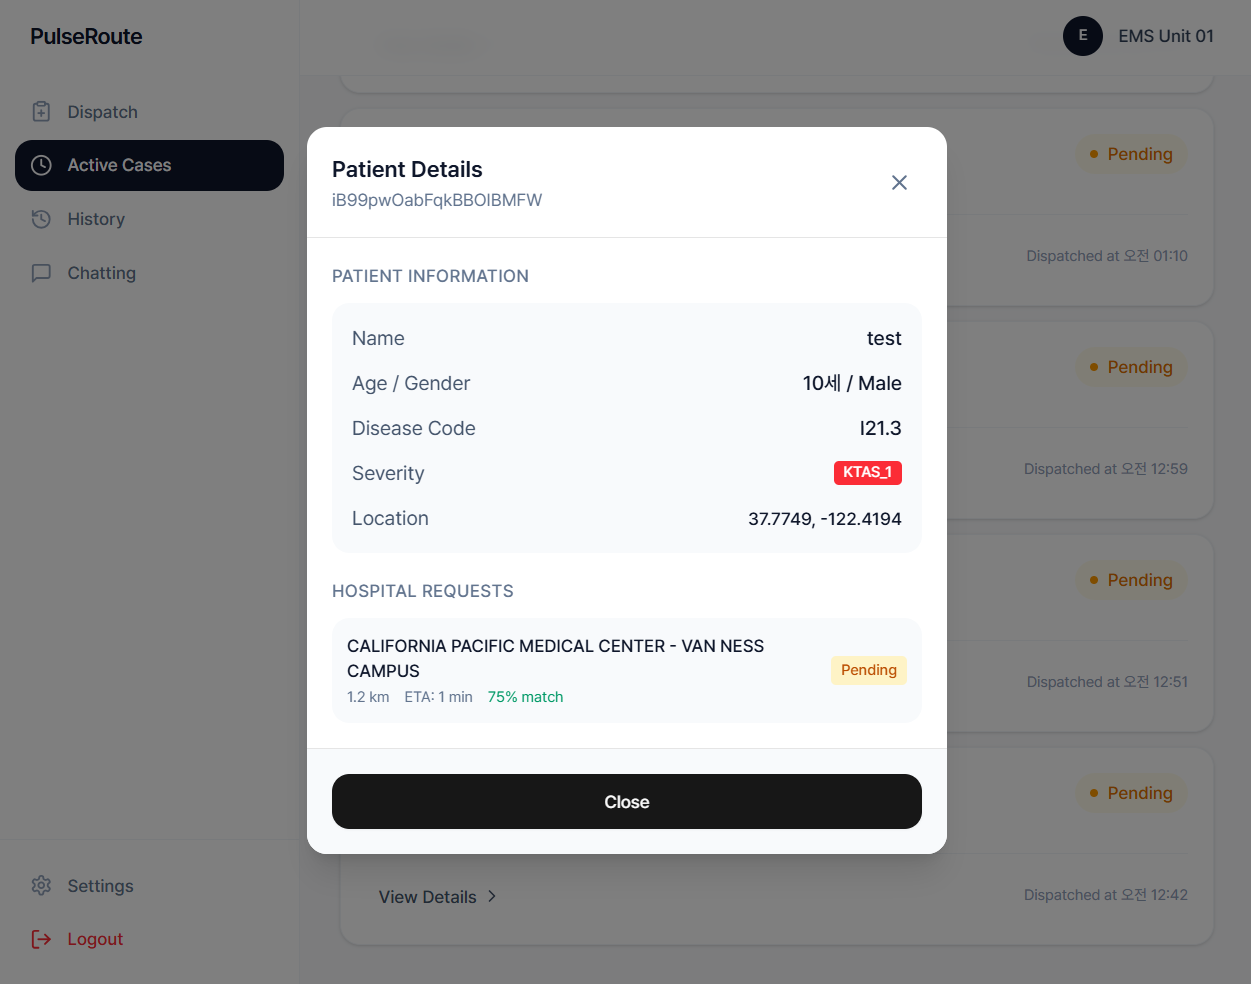
Patient Details Popup Page
-
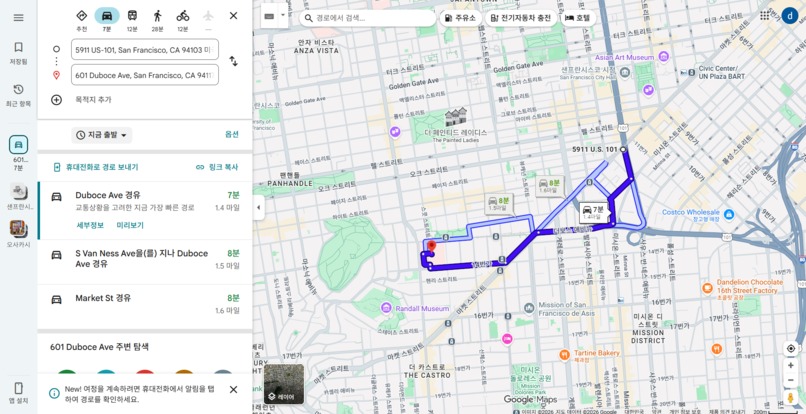
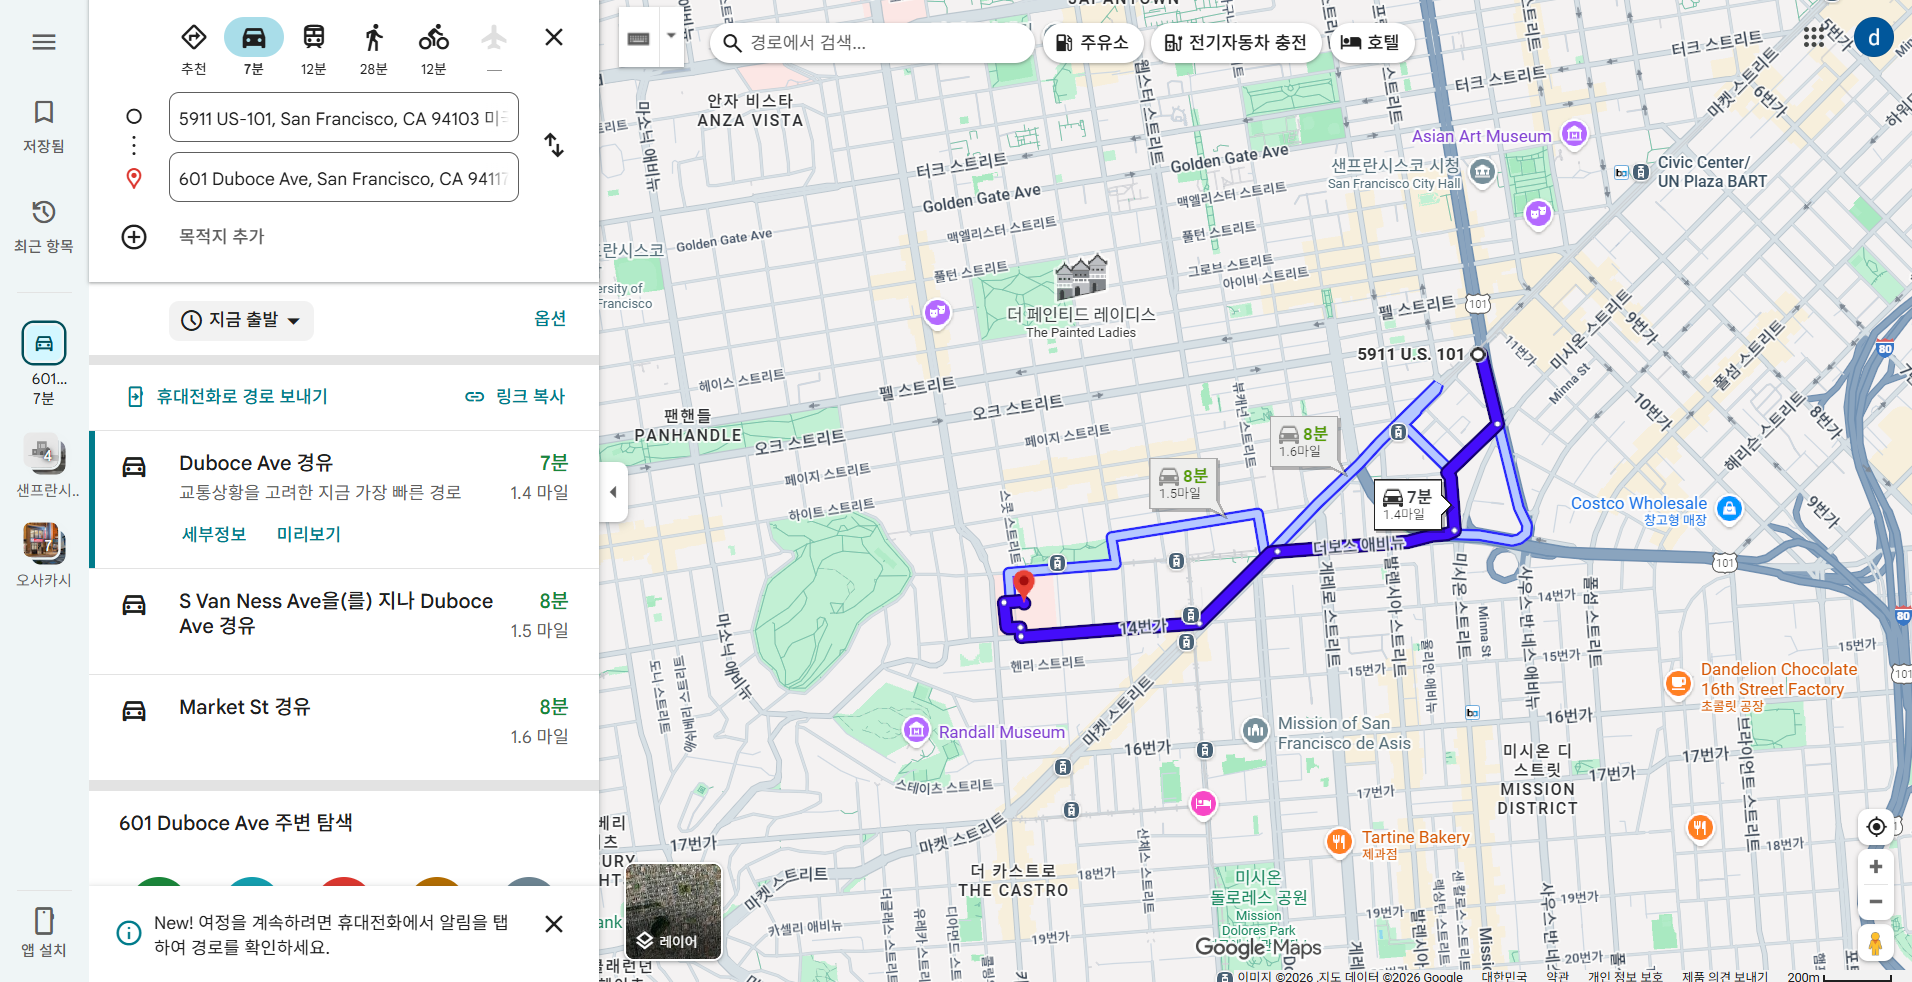
Directions to hospitals that are automatically linked to Google Maps
-
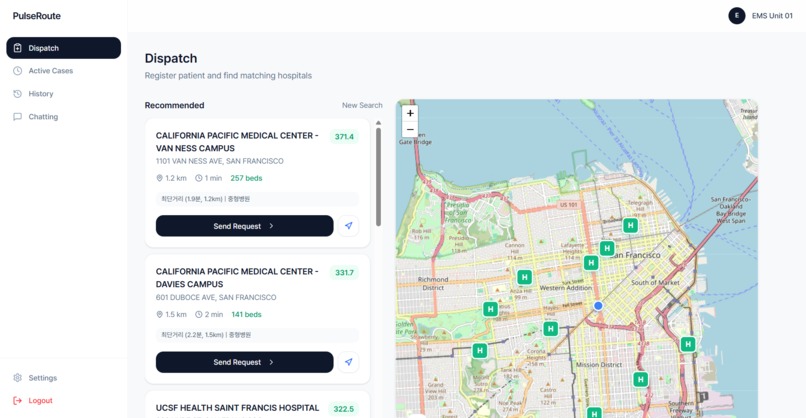
Directions to hospitals that are automatically linked to Google Maps with hospital list

Inspiration
To address emergency room overcrowding and transfer delays, we turned to observed realities that went beyond the subjective reporting of hospitals. Especially in megacities like California, where road conditions and hospital capacity change by the second, a system that enables real-time precision calculations rather than static data is essential. As a team from Korea, we deeply researched the U.S. healthcare system's complexities. While there may be minor regional nuances we have yet to experience firsthand, our passion for solving this critical issue led us to develop a data-driven approach to save lives.
What it does
AI-Powered Best Hospital Recommendation: Matches the patient's severity with hospital grade (Trauma Level, etc.) to suggest the best TOP 3 hospitals. Data triangulation: Automatically invalidate declarative information, such as ReddiNe,t that has not been updated for more than 30 minutes, and calculate actual emergency department (ER) congestion by backtracking the GPS Wall Time of the ambulance. Digital Handshaking: Stream patient information and real-time estimated time of arrival (ETA) to the hospital, and respond to acceptance with a 'one-touch' on the hospital-side dashboard, eliminating administrative delays.
How we built it
We combined California public data (based on FACID) with real-time APIs to build an intelligent route engine. Data preprocessing and merging: location.csv, services.csv, and ed_stats.csv were merged based on facility IDs (FACID). This allowed them to build a unified data frame of hospital location, services provided (emergency or not), and total number of beds (TOTAL_BEDS). Real-time traffic engine integration: 511 API integration to collect real-time accident and construction information in California. The encoding (utf-8-sig) and coordinate system ([longitude, latitude] → [latitude, longitude]) of the API data were calibrated to ensure accurate geographic information. Since external traffic indicators alone cannot accurately reflect the actual emergency room congestion, ambulance GPS-based wall time data were used together. Through this, the calculation formula was designed to reflect the actual observed real-time situation, st rather than the reported information. External API and real-time GPS data-driven formula $$D = (Traffic Index \times 0.4) + (Accident Severity \times 0.3) + (Ambulance Stay Time \times 0.3)$$
D (Dynamic Score): Real-time site congestion (fluctuating data) Traffic Index: Google Maps Real-Time Road Congestion Index Incident Severity: Number and Rating of Incidents Arouthe nd 511 API Ambulance dwell time: actual patient handover time measured by app GPS
Challenges we ran into
The biggest technical challenges were data fragmentation and temporal inconsistencies. Being based in Korea, accessing and interpreting specific local operational protocols in California required extensive research. To solve this challenge, we introduced 30-minute data invalidation logic. Hospital bed information that has not been updated for a certain period of time is treated as 0 reliability, and instead, the accuracy of the algorithm is maintained by prioritizing the congestion backtracking data that analyzes the GPS trajectory (entry~departure time) of the ambulance that has reached the location.
Accomplishments that we're proud of
The system ultimately yields the following key deliverables: Dynamic Visualization: Folium and MarkerCluster were used to visualize the number of available hospital beds across California on a map. (Color classification of markers according to whether or not you have an emergency room) Optimal route and transfer information: Accurately derive the best route from your current location to the proposed TOP 3 hospitals, travel distance, and real-time travel time, reflecting traffic conditions. Admin Unified Dashboard: Analyzed bed occupancy and incident hotspots to complete metrics that 911 controllers can use as a basis for resource relocation. Most importantly, we are proud to have built a system driven by the genuine desire to save even a single life, regardless of the competition's outcome.
What we learned
I realized that the most important thing in data analysis is the temporal validity of the data. No matter how sophisticated the algorithm is, if it learns from outdated data, it will give the wrong answer. We learned that static CSV data, real-time APIs, and data triangulation, which cross-validates GPS actual values, are key to high-risk decision-making systems.
What's next for PulseRoute
Deep learning-based bed occupancy prediction & AI-Assisted Coordination: Beyond the current real-time scoring, we will introduce a time series model to predict bed occupancy in two-hour windows. Furthermore, we will enhance our real-time chat interface with AI-driven summaries. This system will automatically transcribe and summarize paramedic-to-hospital voice/text chats into structured medical briefs, ensuring ER doctors can prepare for incoming patients without reading through long message histories. Nationwide Expansion & Standardization: We plan to standardize the California model to provide a neutral decision-making standard that can be applied to the U.S. and global emergency care systems. Our goal is to build a unified communication protocol where the 'Digital Handshake' and integrated chat become the global standard for emergency patient redistribution.
https://pulseroute.vercel.app/ id: ems01@test.com pw: ems01


Log in or sign up for Devpost to join the conversation.