-
-
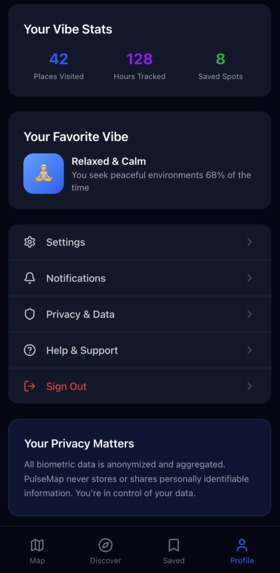
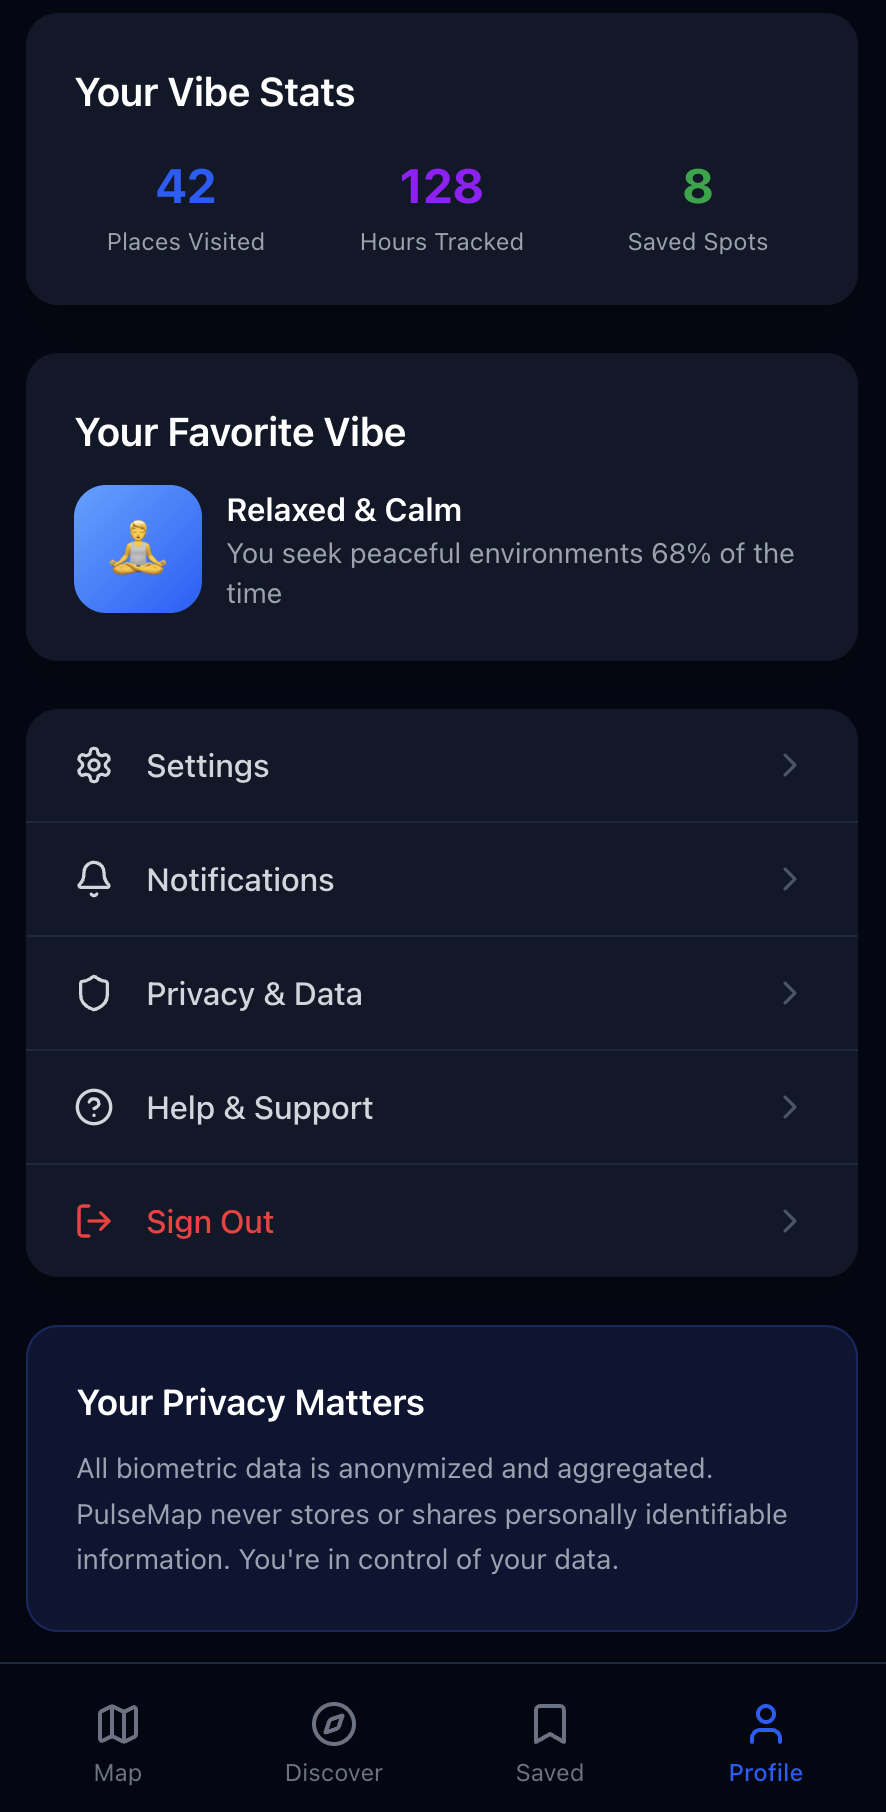
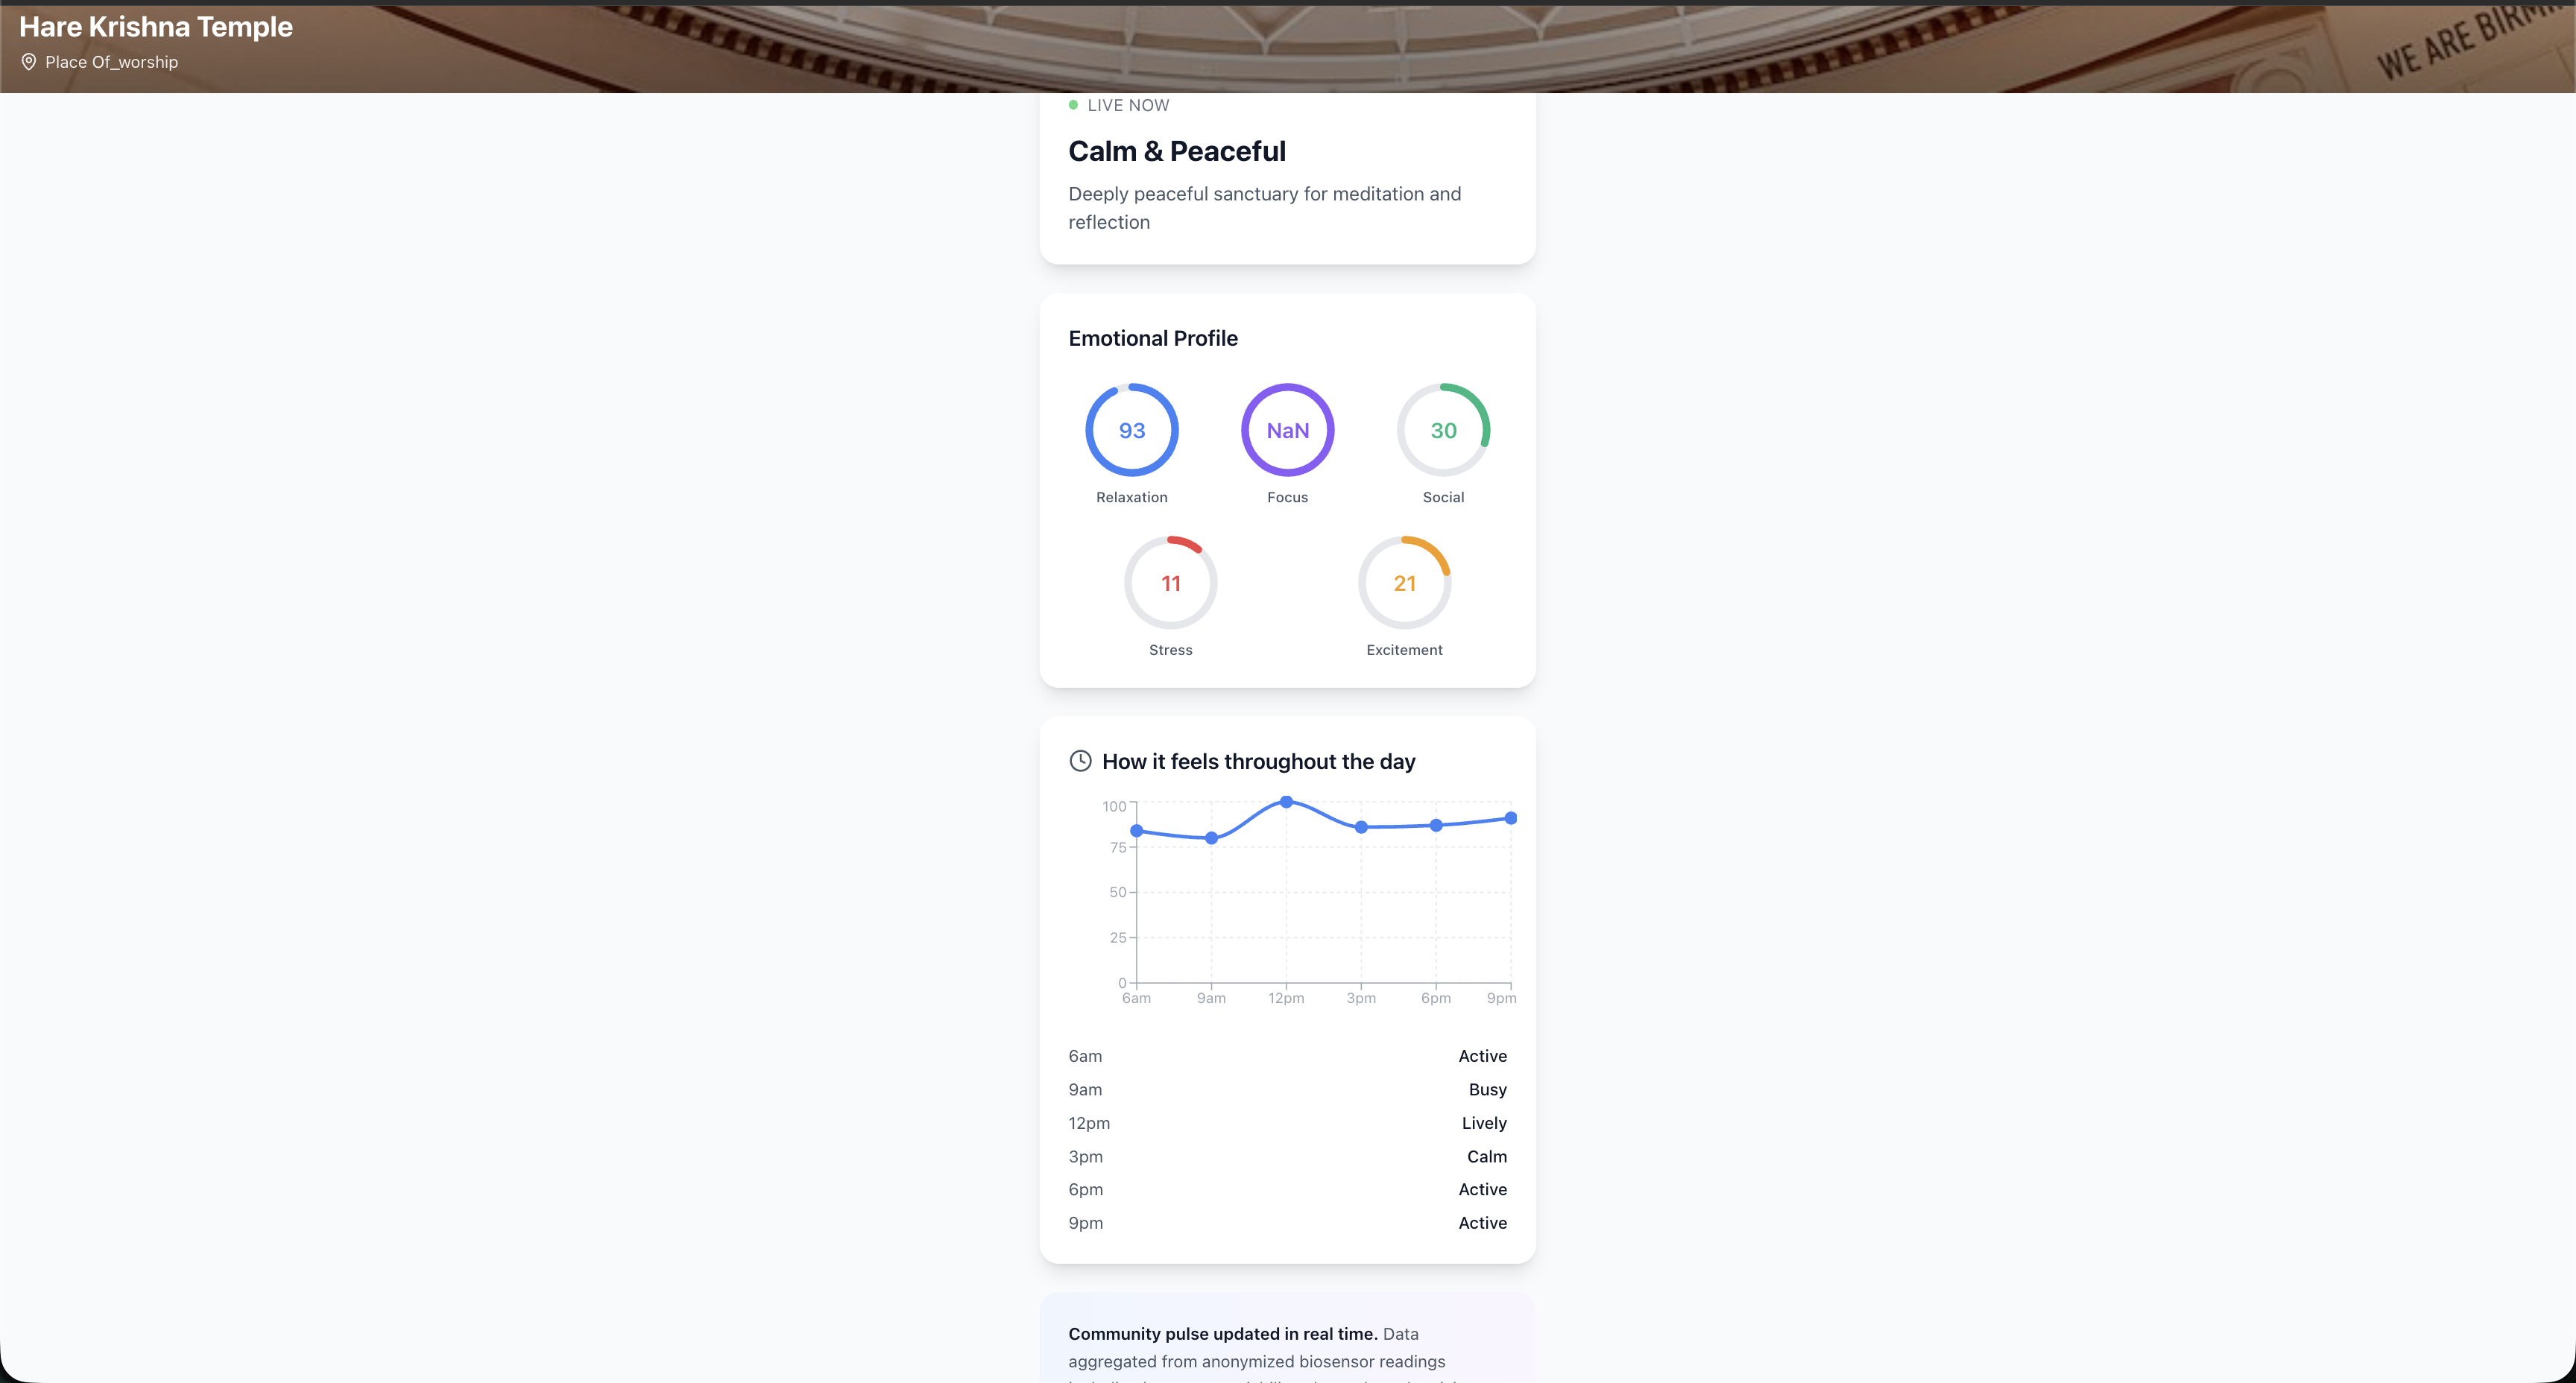
Profile Page
-
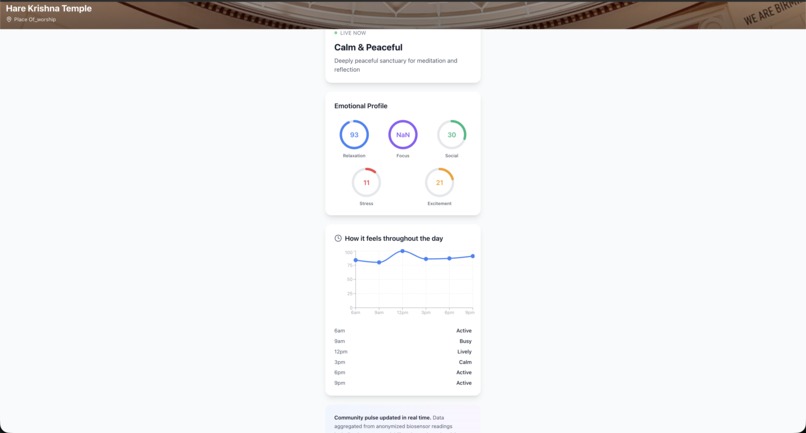
Location Details
-

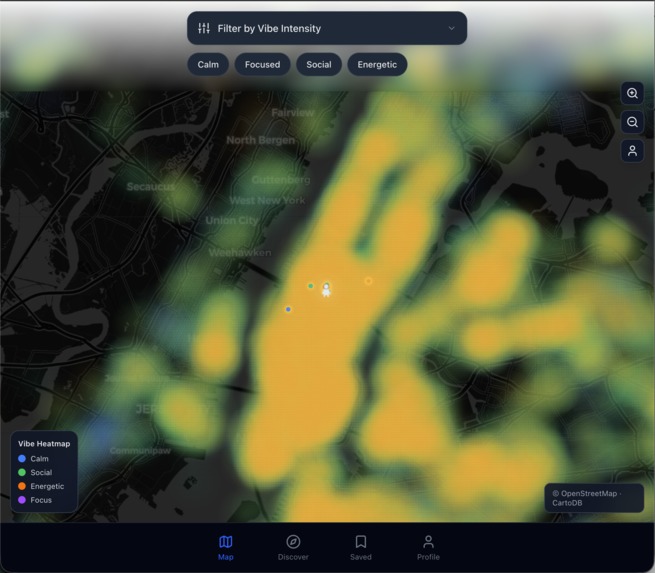
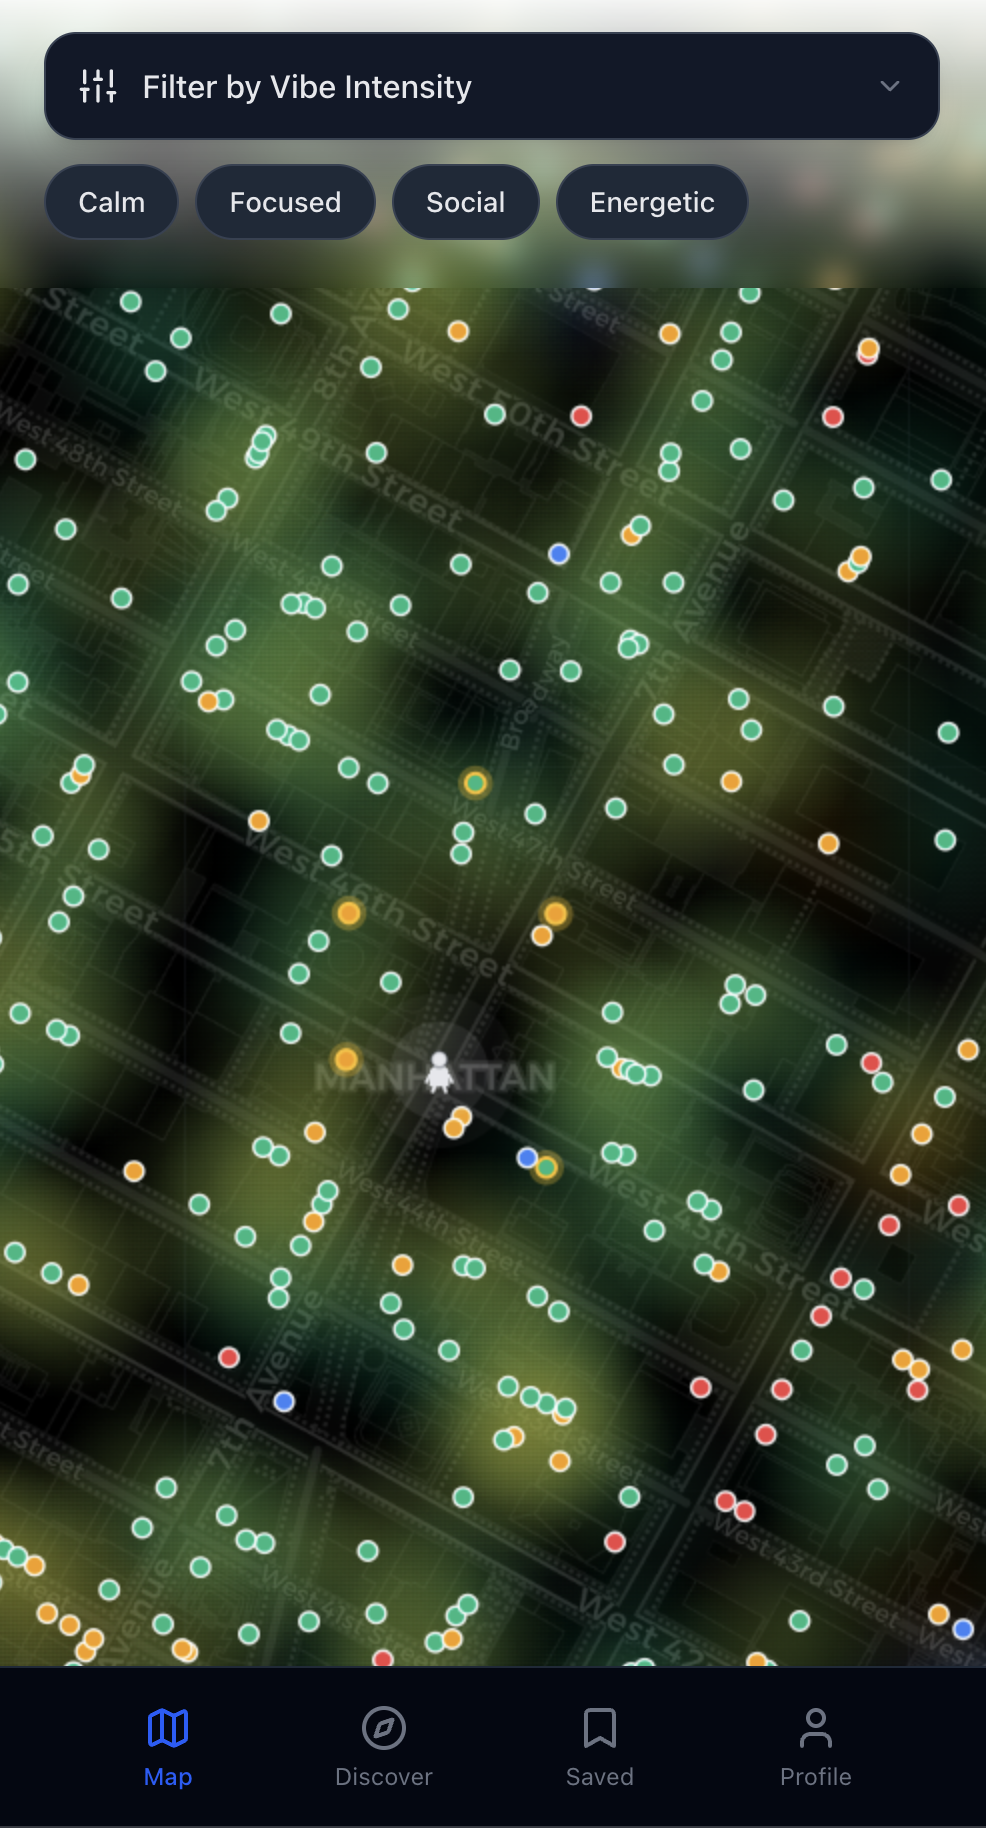
Close up map view
-
Zoomed out map view

Inspiration
Cities are full of invisible signals about how places feel. Some cafés feel calm and focused, while others feel chaotic or stressful. Parks can feel relaxing, libraries can feel productive, and crowded areas can feel overwhelming. Yet today, when we choose where to go, we rely on guesses, reviews, or outdated impressions rather than the real-time emotional atmosphere of a place.
At the same time, modern wearable devices continuously measure physiological signals such as heart rate, heart rate variability, electrodermal activity (EDA), movement patterns, and other biosignals. These signals often reflect our stress levels, emotional arousal, and overall mental state.
This inspired us to ask a simple question: what if we could visualize the collective emotional pulse of places?
PulseMap was born from the idea that when many people occupy a space, their physiological signals collectively reveal something about the environment. By aggregating anonymized biosensor data, we can create a map that shows the emotional and physiological atmosphere of locations in real time.
What it does
PulseMap is a concept for a mobile application that visualizes the collective emotional atmosphere of locations using anonymized biosensor data from wearable devices.
The app aggregates signals such as:
- Heart rate
- Heart rate variability (HRV)
- Electrodermal activity (EDA)
- Movement patterns
- Stress-related biomarkers
These signals are processed and translated into an intuitive vibe profile for each location, including metrics like:
- Relaxation
- Stress
- Social energy
- Focus
- Emotional arousal
Users can explore a map of their city and discover how places feel in real time. For example, a user could:
- Find a calm café to relax
- Discover a focused environment for studying
- Locate lively areas for social activity
- Avoid crowded or stressful environments
PulseMap essentially turns cities into emotionally navigable environments, allowing people to choose destinations based not only on location, but also on how they want to feel.
How we built it
We designed PulseMap using Figma, focusing on creating a clear and intuitive interface for exploring emotional data.
Our prototype includes several key components:
Emotional Heatmap Map View
A city map visualizes aggregated emotional signals using color-coded heatmaps:
- Blue: calm
- Green: social
- Yellow: energetic
- Red: stressful
Location Vibe Profiles
Users can tap on any location to view a detailed dashboard showing the emotional metrics of that space, including relaxation, stress, social energy, and focus levels.
Mood-Based Discovery
Users can search for places based on how they want to feel, such as relaxed, focused, or social.
To illustrate the sensing pipeline, we designed a conceptual system where wearable devices collect biosignals which are then anonymized, aggregated, and translated into emotional insights for the map.
Our work primarily focused on interaction design, information visualization, and speculative sensing design to demonstrate how such a system could work.
Challenges we ran into
One of the biggest challenges was translating complex physiological signals into simple, intuitive visualizations that users could understand instantly. Biosignals like HRV or electrodermal activity are scientifically meaningful but not immediately interpretable for everyday users.
Another challenge was designing the system in a way that respects privacy and ethical considerations. Because the concept involves biometric signals, we needed to ensure that all data would be aggregated and anonymized, preventing any individual from being identified or tracked.
Finally, we had to balance speculation and plausibility. The project imagines a future where biosensors and wearable devices can provide richer physiological data streams, while still grounding the concept in technologies that are already emerging today.
Accomplishments that we're proud of
We are especially proud of how clearly the prototype communicates the concept of emotional mapping.
Some highlights include:
- Designing an intuitive emotional heatmap visualization that feels similar to weather maps.
- Creating a vibe profile dashboard that translates biosensor signals into understandable emotional metrics.
- Building a coherent product narrative that connects biosensing, urban environments, and mental wellbeing.
- Developing a concept that reveals a new sensory layer of cities that people normally cannot perceive.
We’re also proud of the overall design clarity of the interface and how easily users can understand the product after just a short demo.
What we learned
Working on PulseMap helped us think deeply about how human-centered design can reveal invisible aspects of the world.
We learned how physiological signals such as heart rate variability and electrodermal activity can reflect emotional states, and how those signals could potentially be used to understand environments collectively.
We also gained experience designing interfaces that communicate complex data in a simple and intuitive way, which is a core challenge in many real-world products.
Finally, this project pushed us to think about the ethical responsibilities that come with designing systems that involve biometric or physiological data.
What's next for PulseMap
If PulseMap were developed further, there are several exciting directions we would explore.
First, we would integrate real biosensor data streams from wearable devices such as smartwatches and health trackers. Advances in wearable technology and edge computing could make real-time emotional aggregation increasingly feasible.
Second, we would experiment with additional sensing modalities, such as environmental sensors (sound levels, crowd density, air quality) to provide a richer understanding of place atmospheres.
Third, we would explore new features such as:
- Emotional forecasts showing how places are likely to feel later in the day
- Personalized recommendations based on a user’s current mood
- Urban wellbeing insights that help cities design healthier environments
Ultimately, PulseMap imagines a future where cities are not just navigated by geography, but by how they make us feel.
Built With
- figma


Log in or sign up for Devpost to join the conversation.