-
-

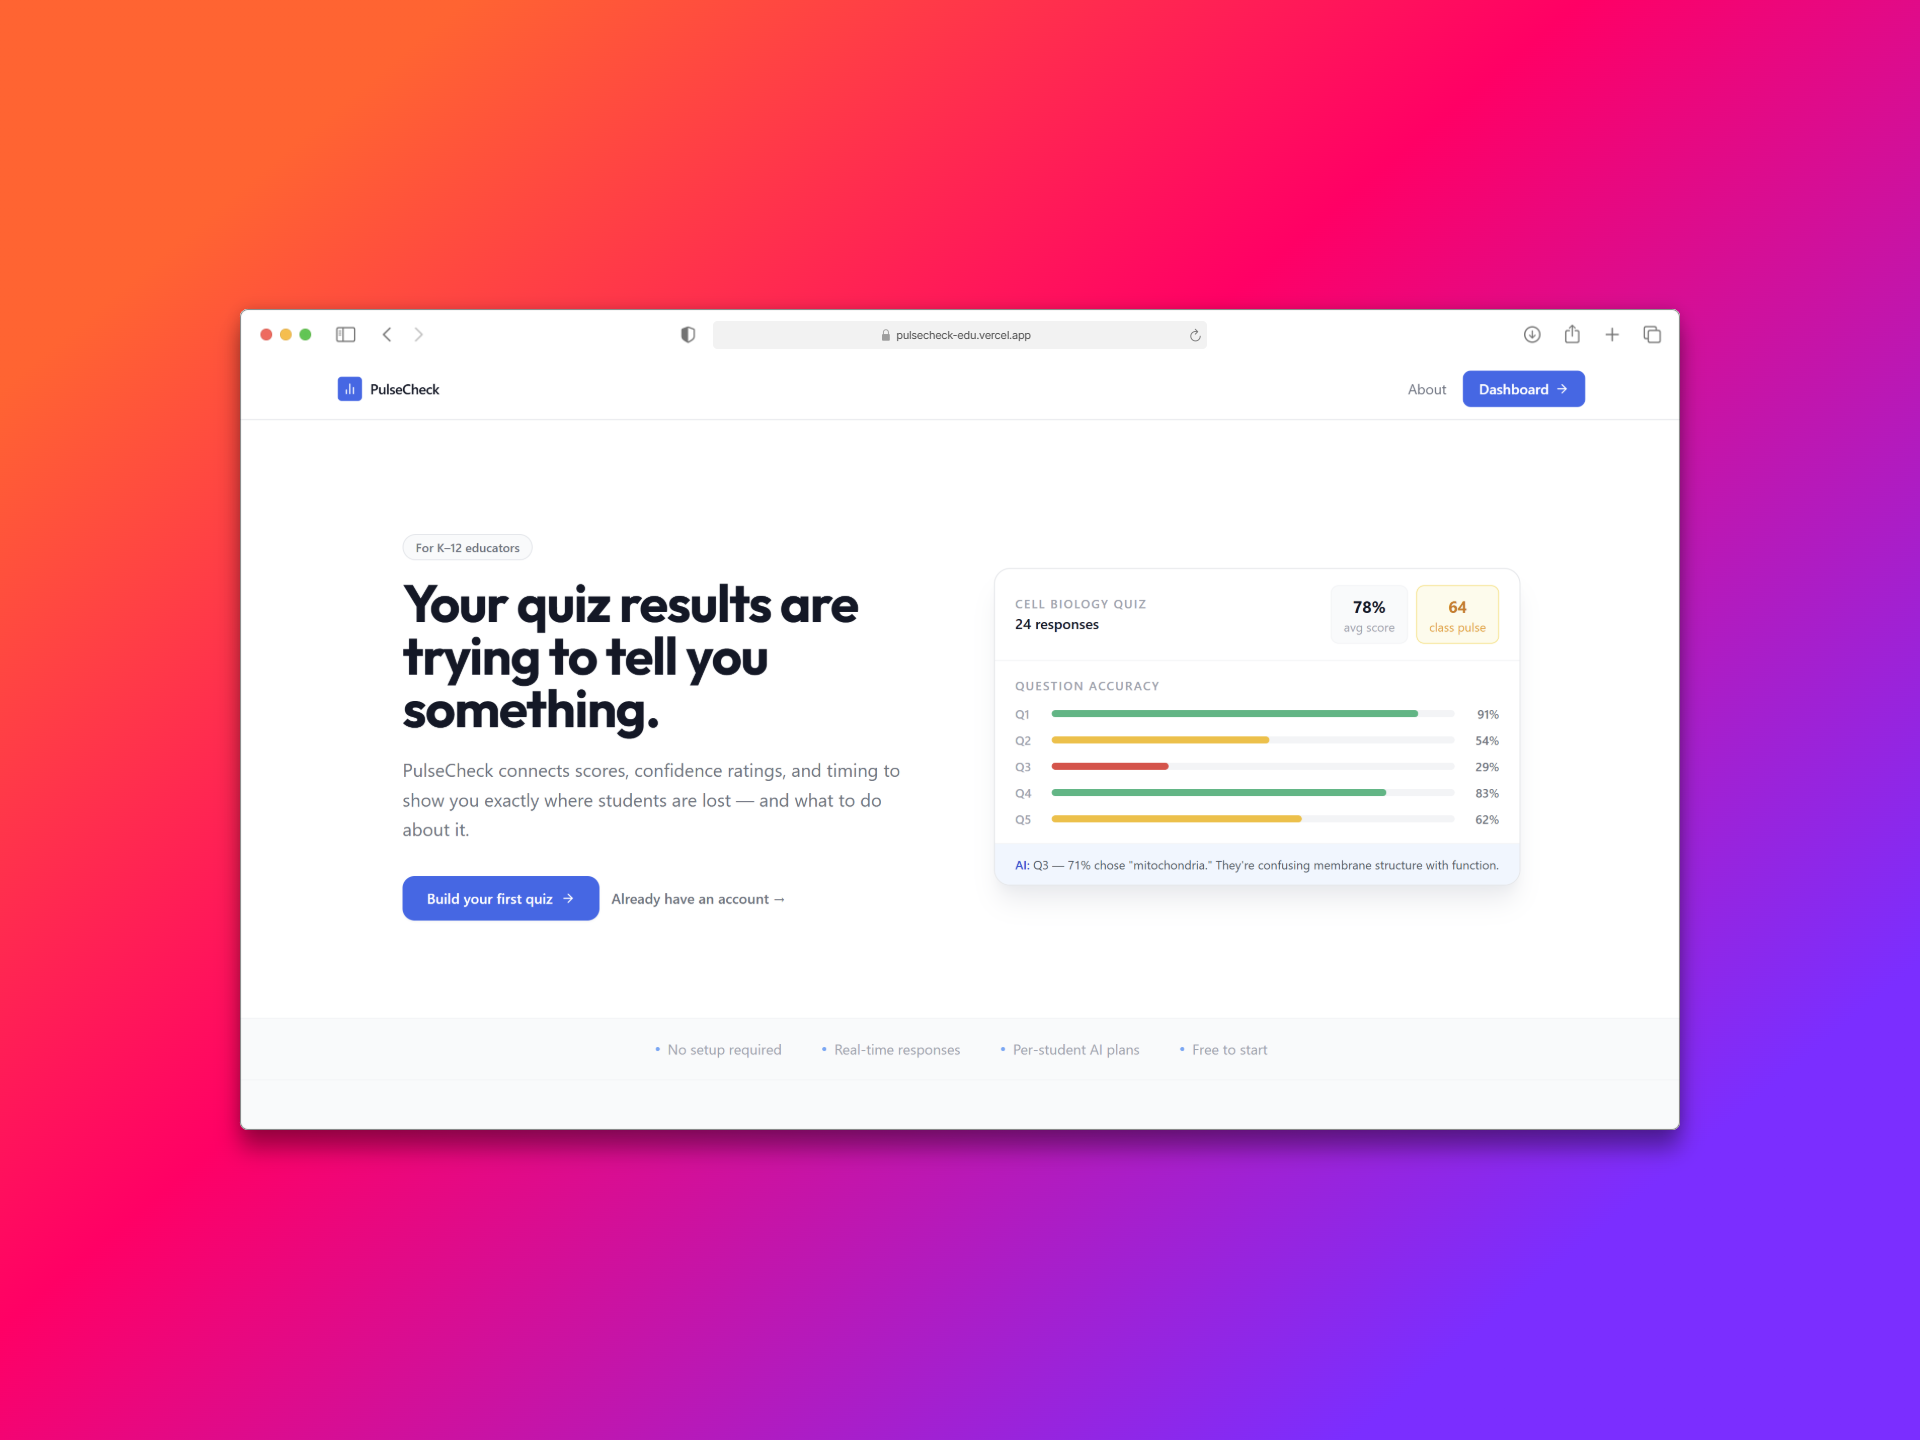
Landing Page
-
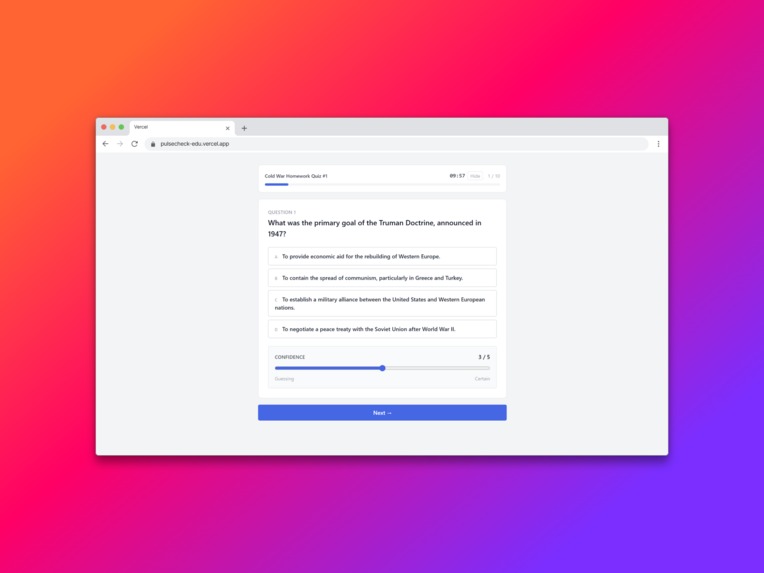
Student Quiz View
-

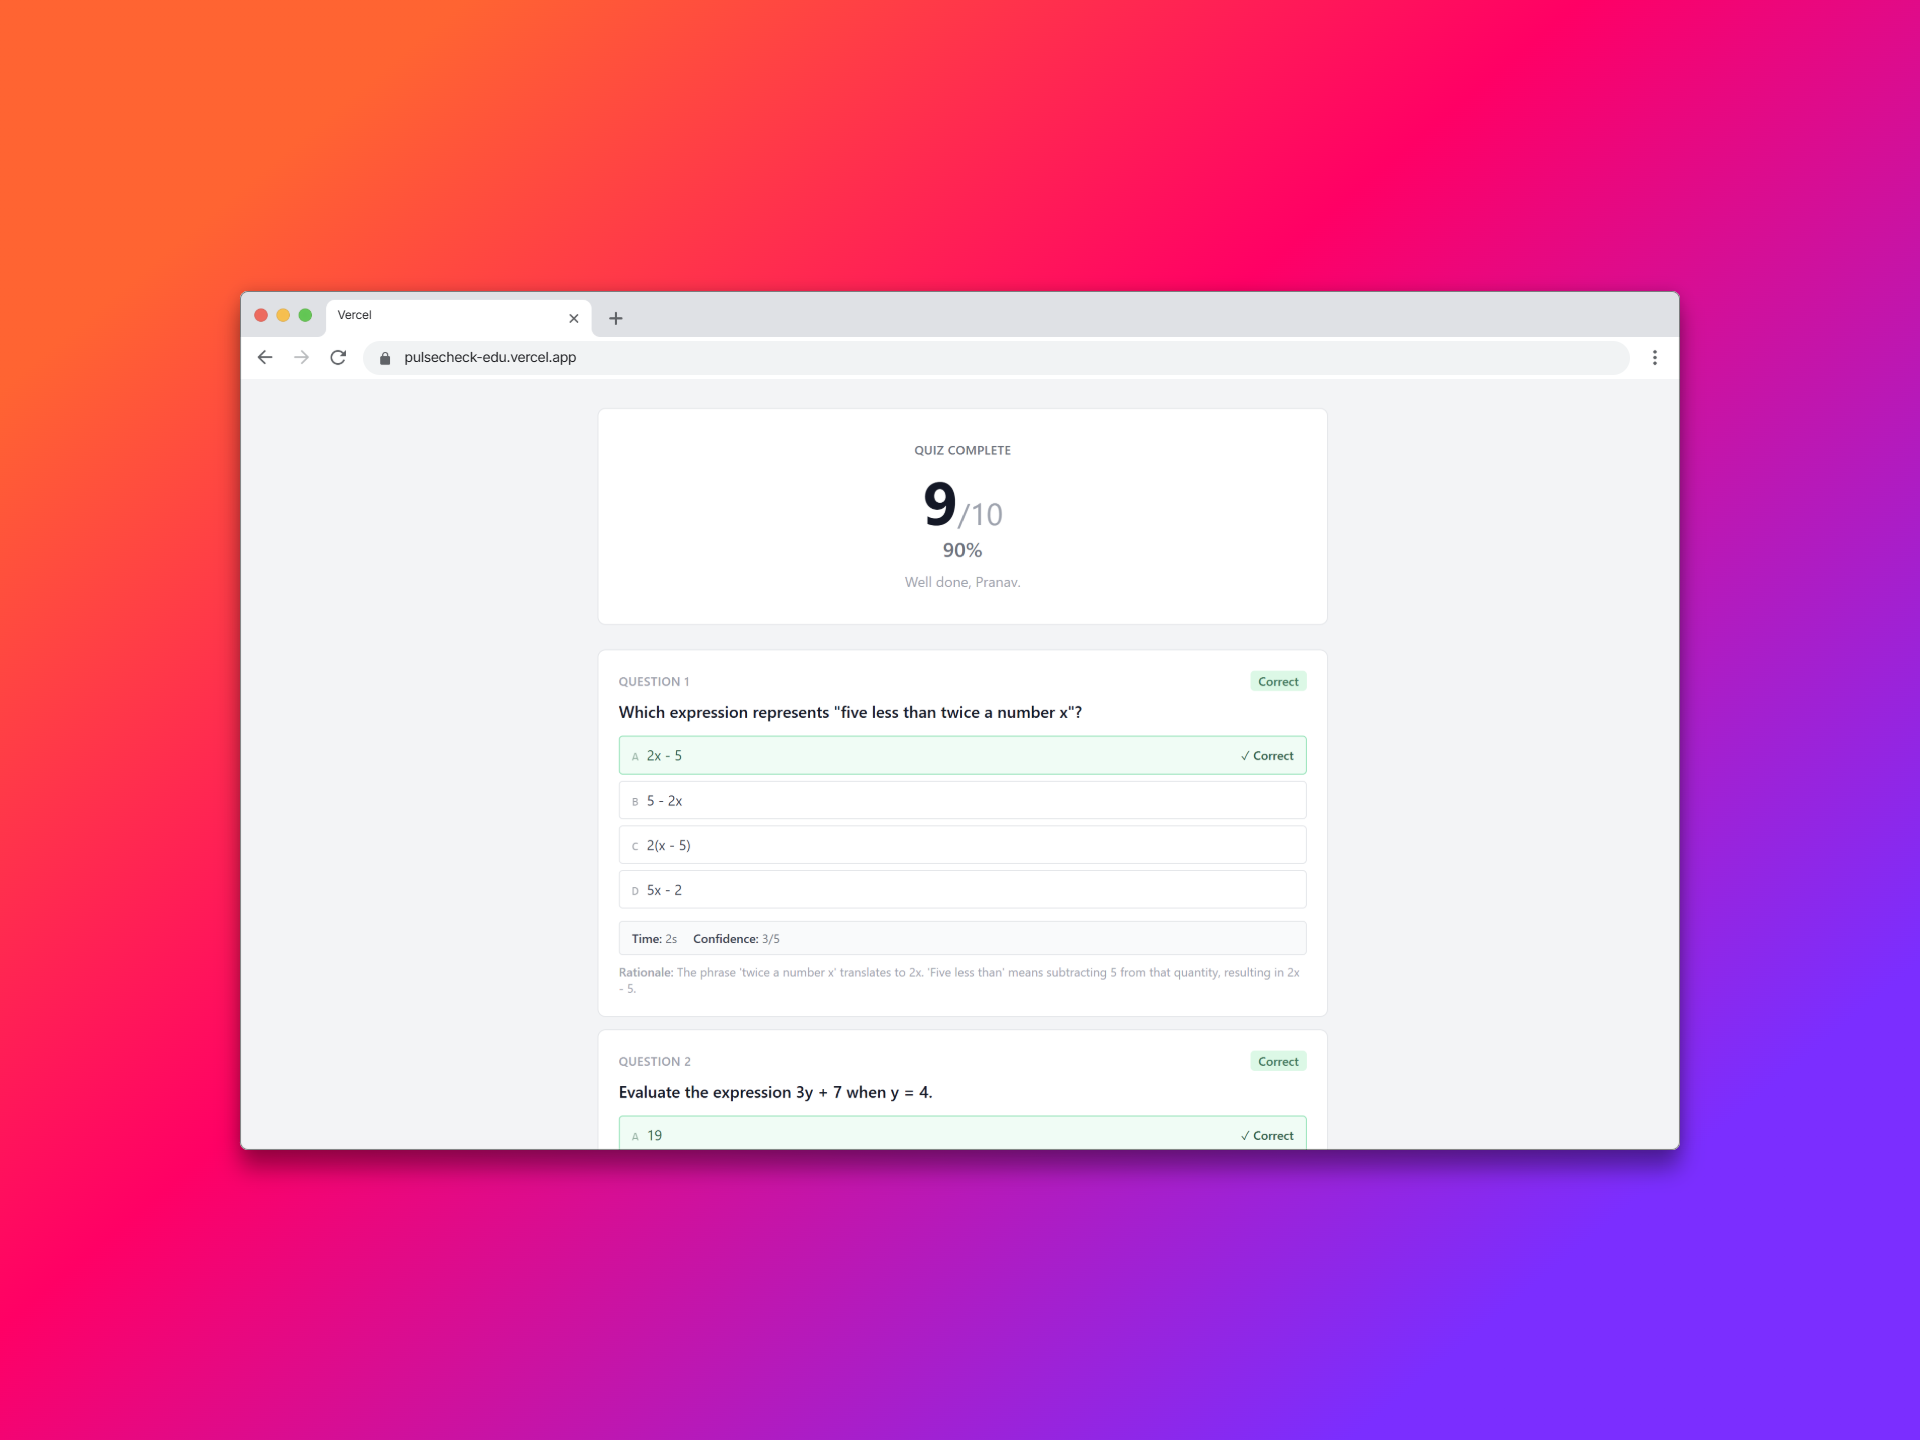
Student Quiz Completion View
-

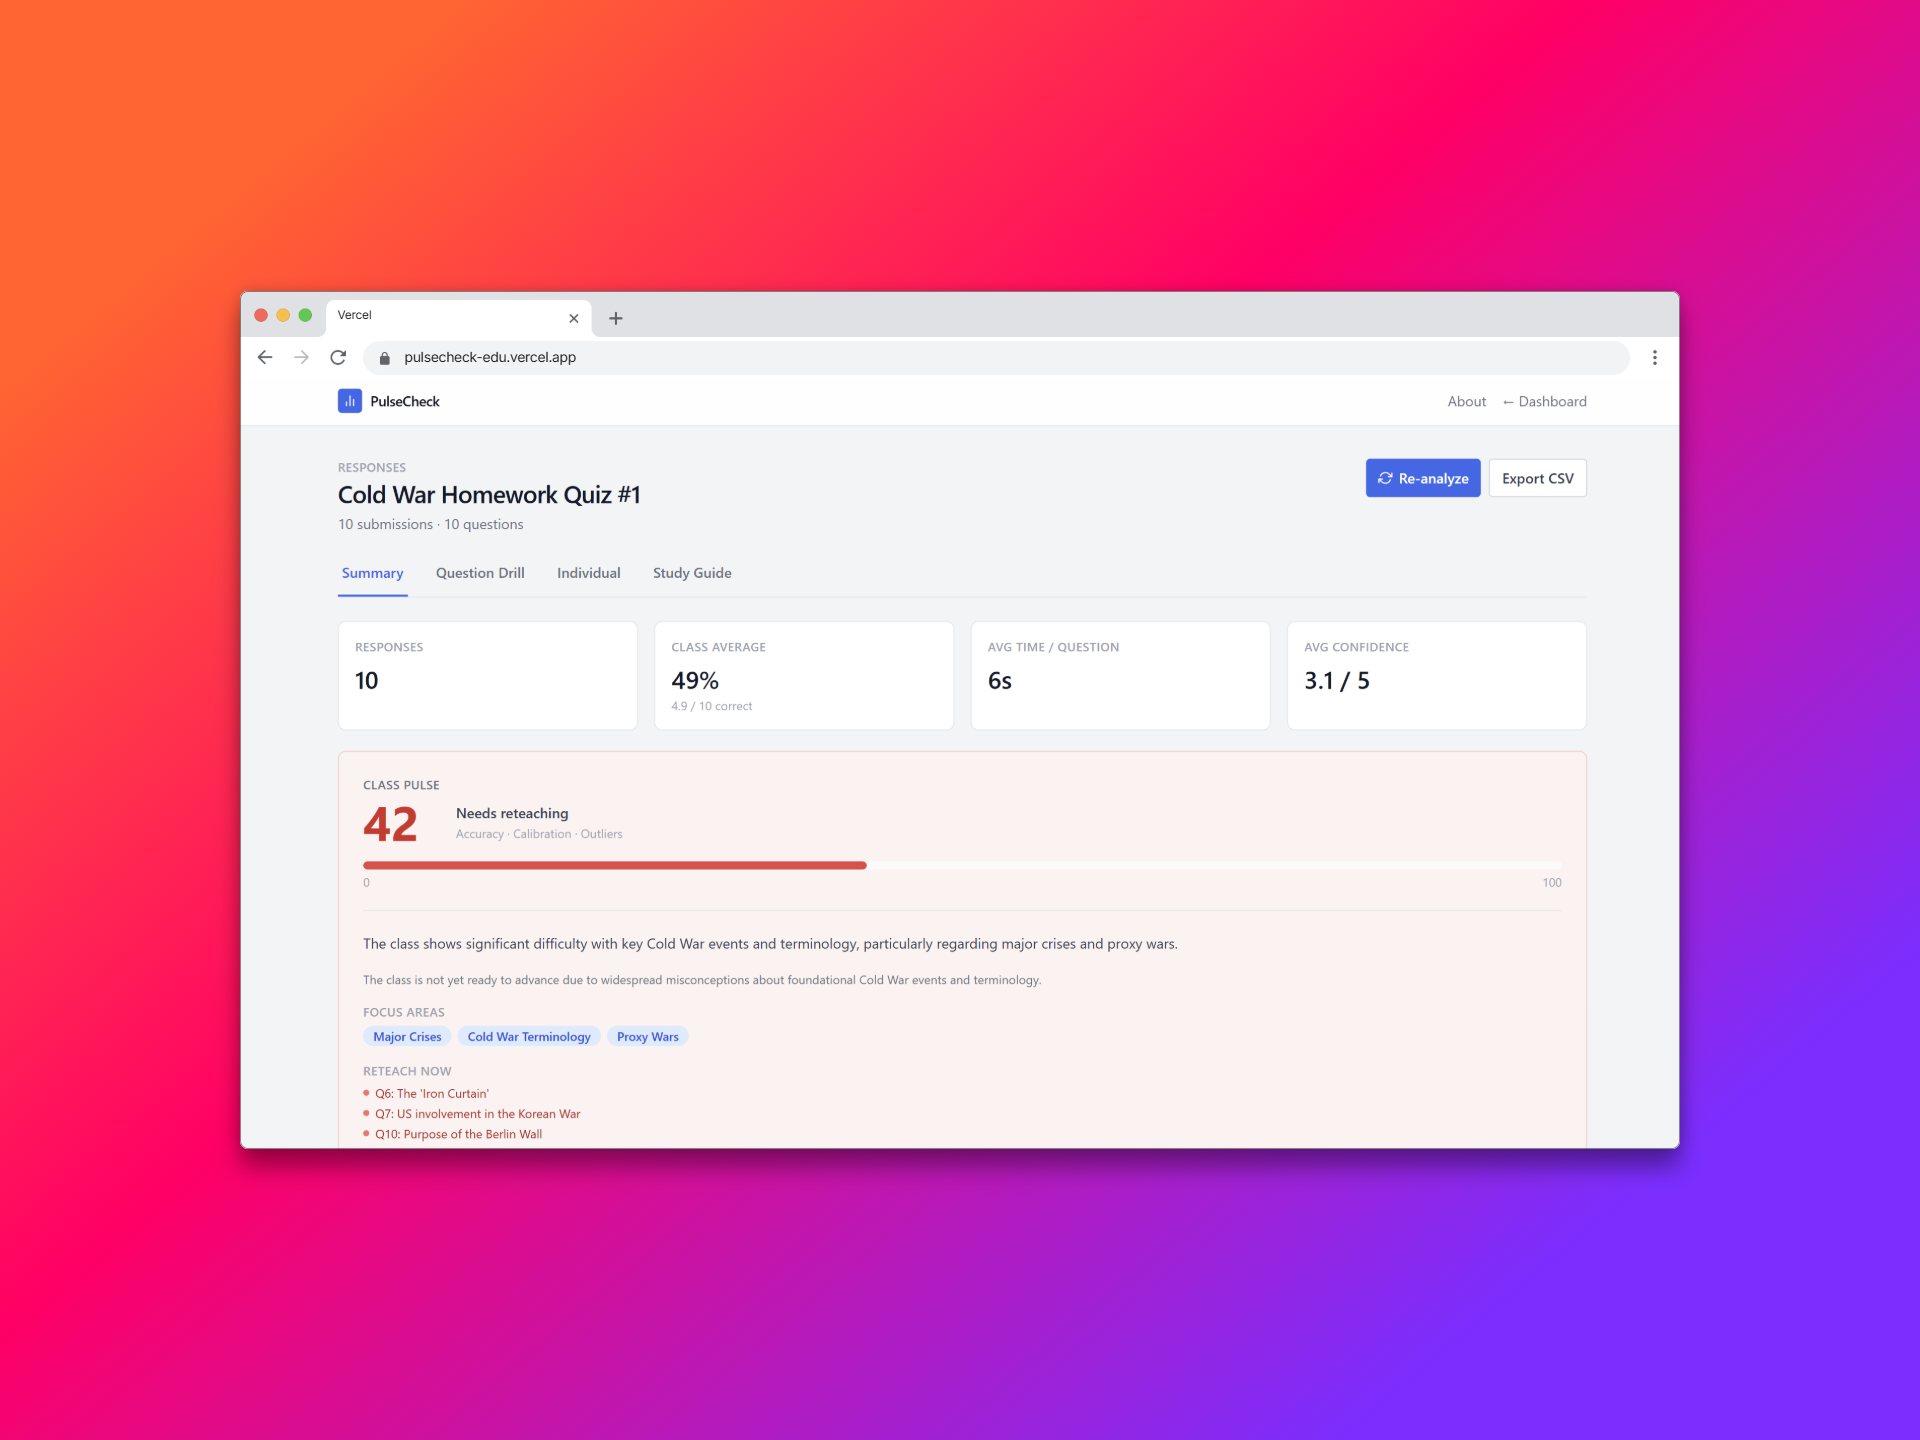
Quiz Summary Homepage
-

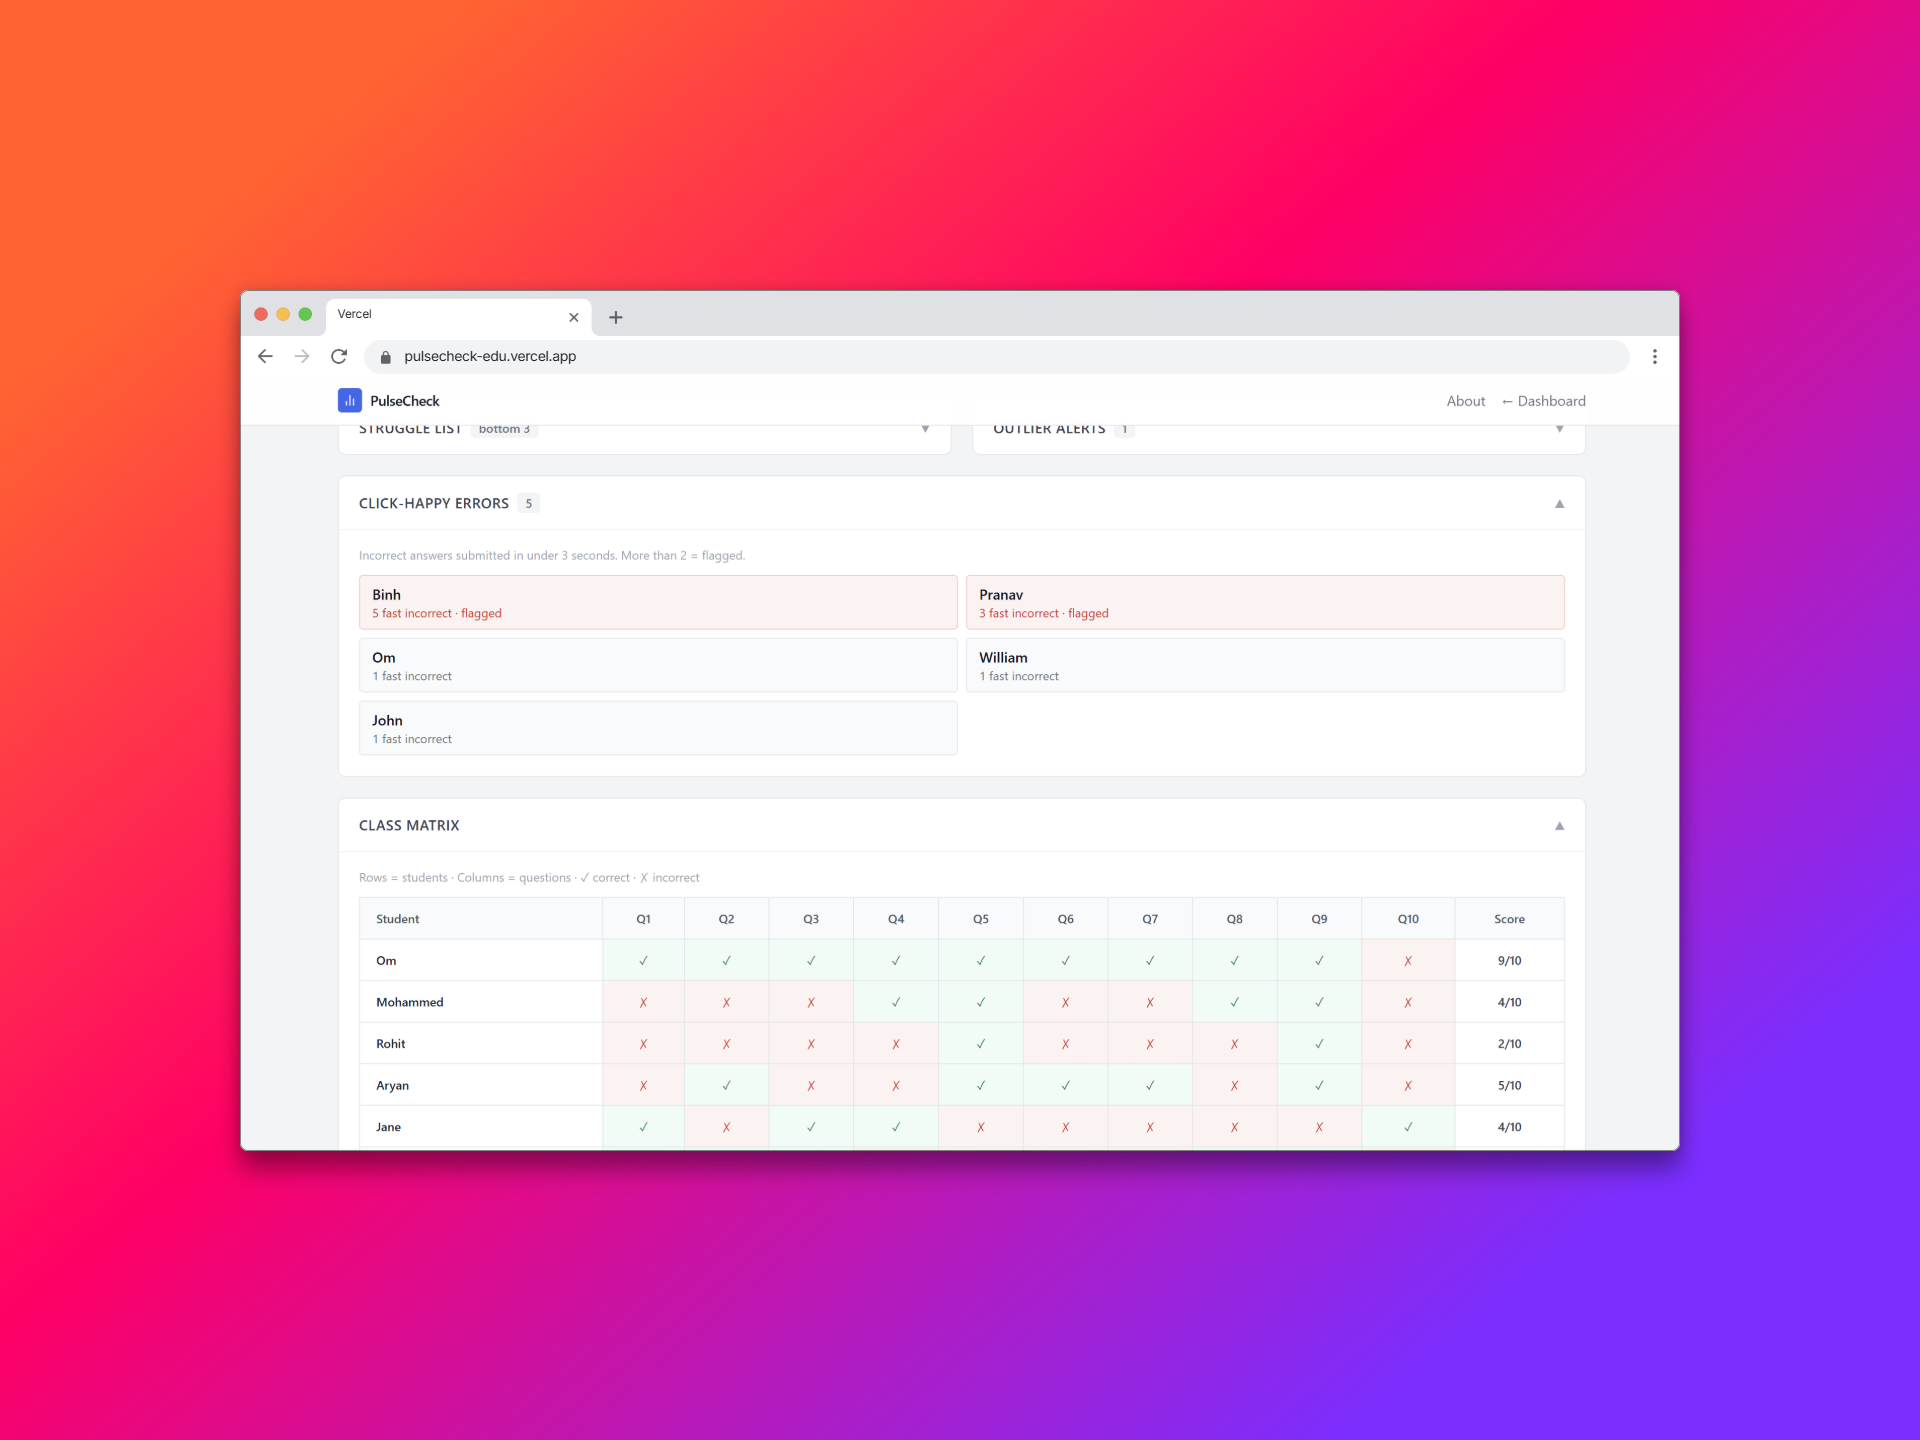
Quiz Statistics Section
-

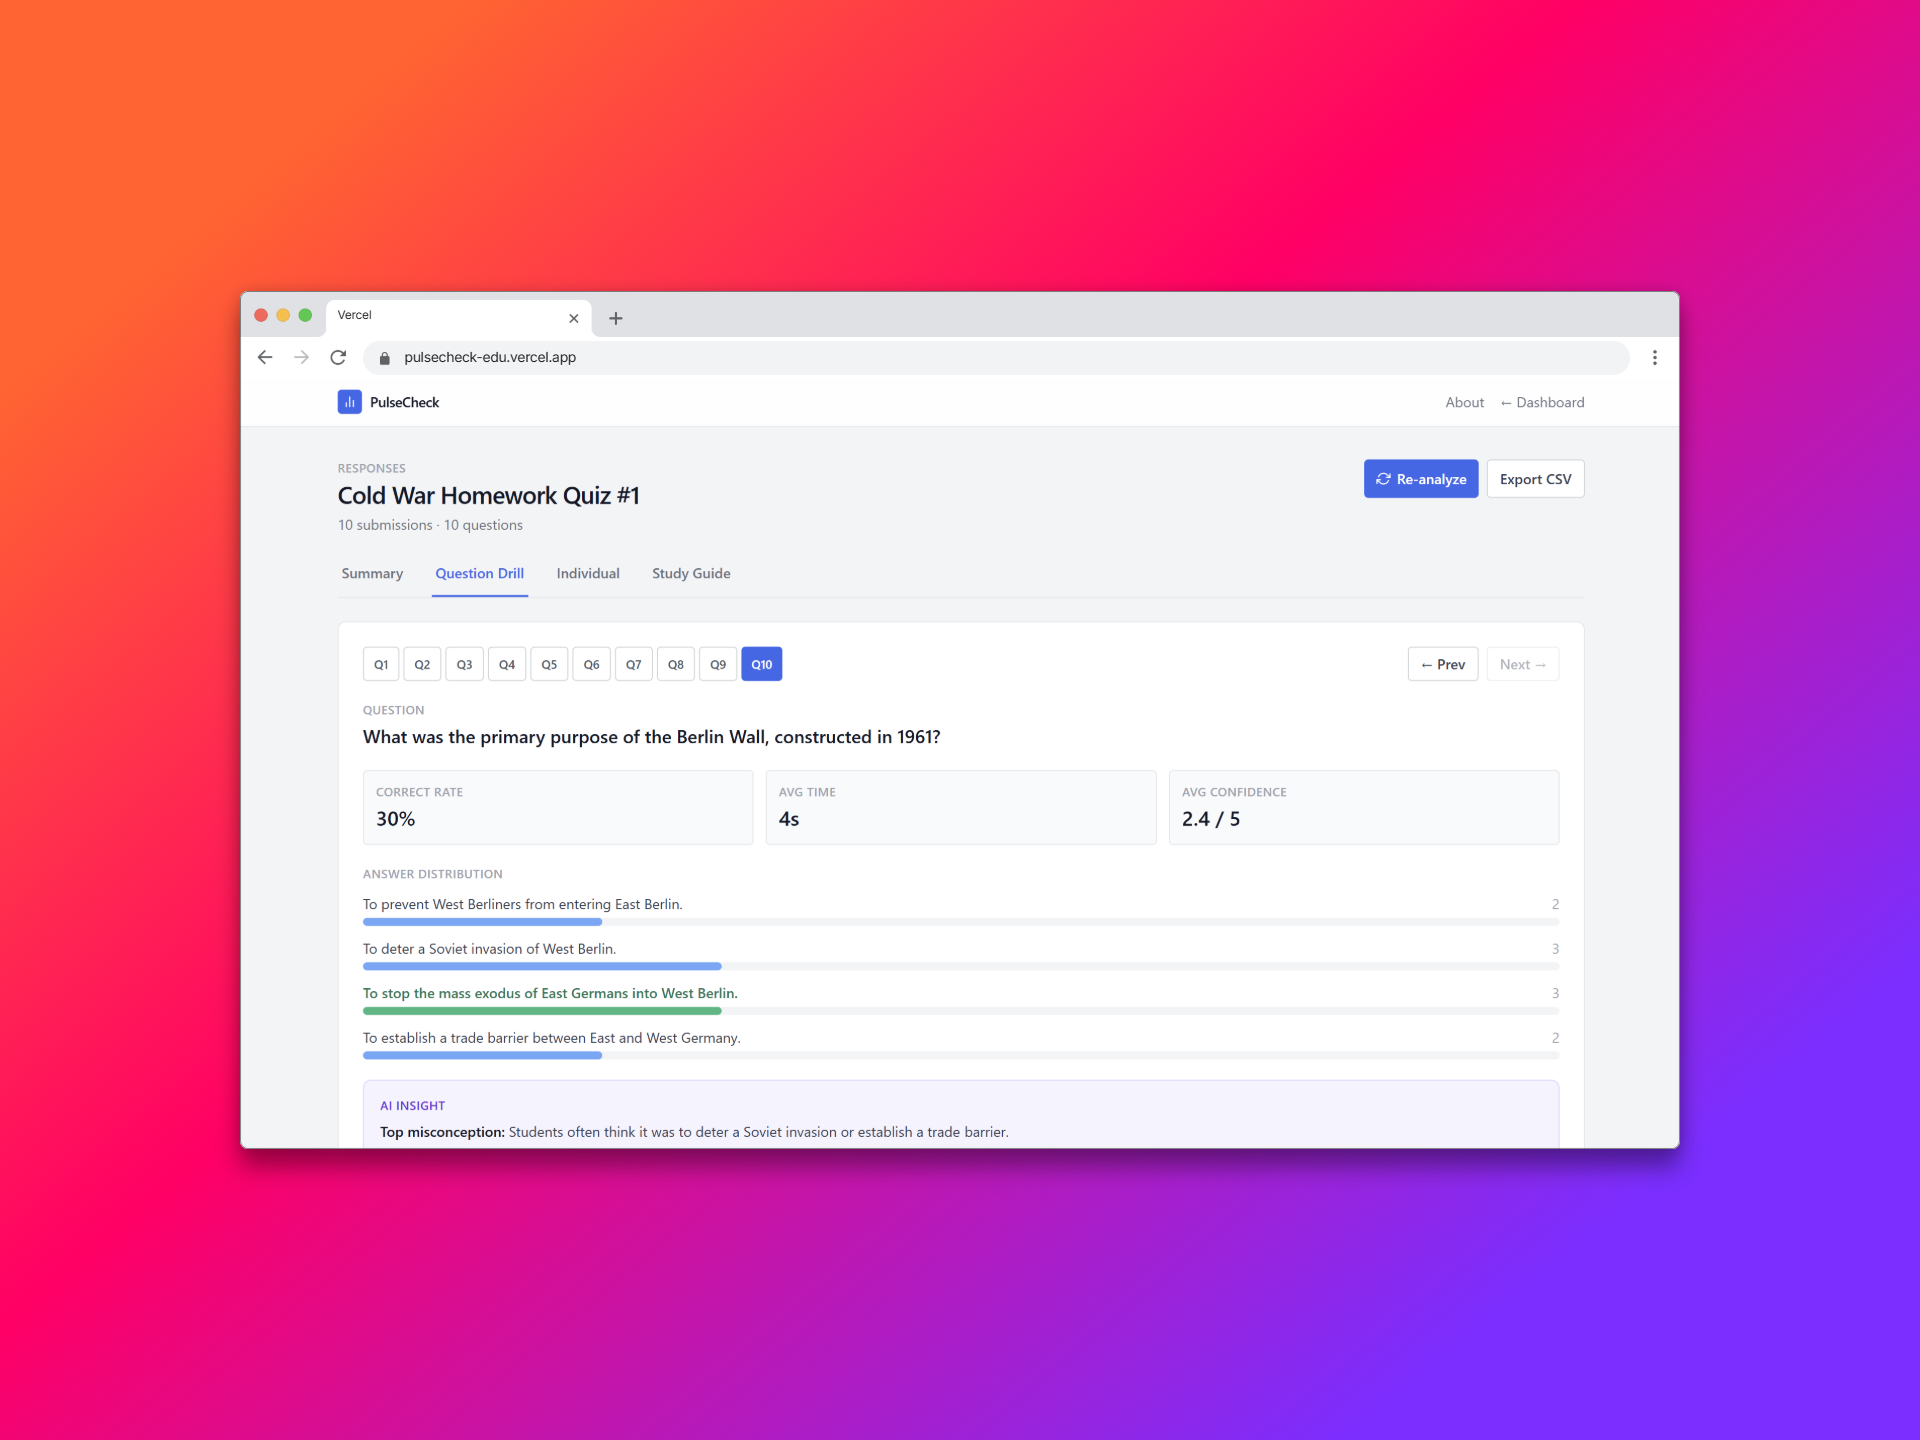
Quiz Question-by-question feedback page
-
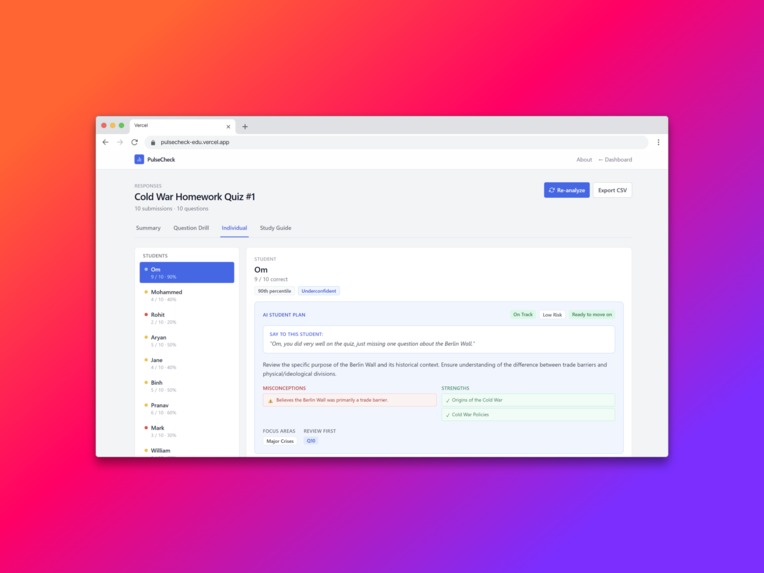
Quiz Individual Feedback Page


Inspiration
All of us have spent years tutoring, but we feel confused regarding student comprehension after every quiz. A 5/10 score just tells you a student failed but never explains why. We realized the greatest danger in a classroom is the "confidently wrong" student: the one who believes a falsehood so strongly that they never ask for help. We built PulseCheck to perform a live biopsy on learning.
What it does
PulseCheck turns lesson notes into an instructional roadmap.
- Generate: AI builds tagged quizzes from PDFs in seconds.
- Deploy: Students join via a link with no accounts or apps.
- Analyze: Teachers see a live dashboard that flags misconceptions, "toss-up" questions, and student certainty. It tells you exactly what to say to the class on Monday morning.
How we built it
We prioritized a real-time, high-speed stack to match the classroom's pace.
- Frontend: React and Vite for a lightning-fast UI with Tailwind CSS.
- Backend: Firebase and Firestore for authentication and storage of created quizzes and responses.
- The Brain: Gemini 2.5 Flash handles quiz generation and the "Deep Analysis" of accuracy versus confidence.
Challenges we ran into
The Pulse Formula. We wanted to create an overall metric that teachers could use to understand the class's readiness at a glance. Balancing accuracy with confidence was difficult. We developed a weighted logic to ensure the "Class Pulse" reflected true readiness: $$Pulse = \text{round}(\text{clamp}(0.6 \cdot \text{accuracy} + 0.25 \cdot \text{calibration} - \text{outlierPenalty}))$$
From a design standpoint, it took a lot of wireframing and whiteboard planning to figure out how to keep our product from having a professional feel while also making the information architecture and UX as simple as possible. Because we are marketing towards teachers & students, we need to assume they aren't the most tech-savvy, and with such an analytic-heavy product, this was an initial challenge and barrier we had to overcome.
Accomplishments
We successfully turned complex statistics into a single, intuitive score. Seeing a live heatmap update as students answer questions feels like a teacher's superpower. Our Distractor Analysis is a standout. Instead of just showing the answers students got wrong the most, it explains the specific misconception that caused it.
What we learned
Actionable > Visual. Teachers do not need more charts. They need "opening lines." We learned that the Confidence Slider is our most valuable data point. It identifies the "Danger Zone" students who are certain of their mistakes, a group that traditional grading completely ignores.
What's next
Our next step is to add a classroom feature and allow students to create their own accounts as well. This would follow other education platforms like Pearson MyLab and EdPuzzle, where teachers create a class and share a class code with students so they can join. With this, we would be able to track pulse across multiple quizzes, allowing the teacher to tailor teaching across a whole unit and ensure students are prepared for an exam. The dashboard is also still a bit overwhelming, which later iterations aim to fix.
Built With
- firebase
- gemini
- javascript
- react
- tailwind
- vite


Log in or sign up for Devpost to join the conversation.