-
-
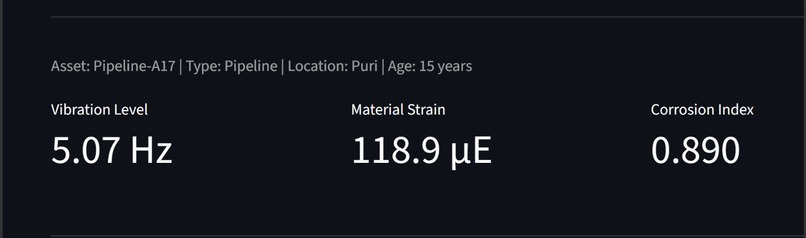
current updates
-
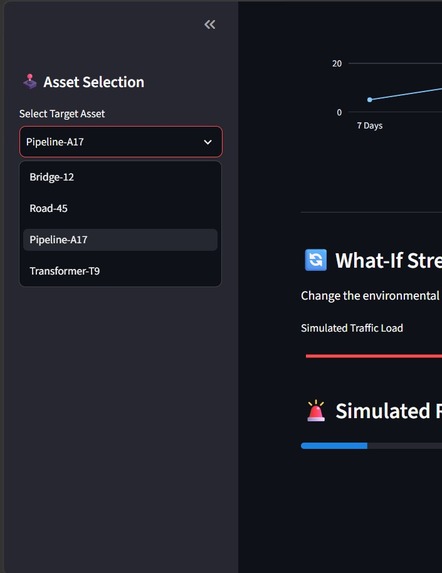
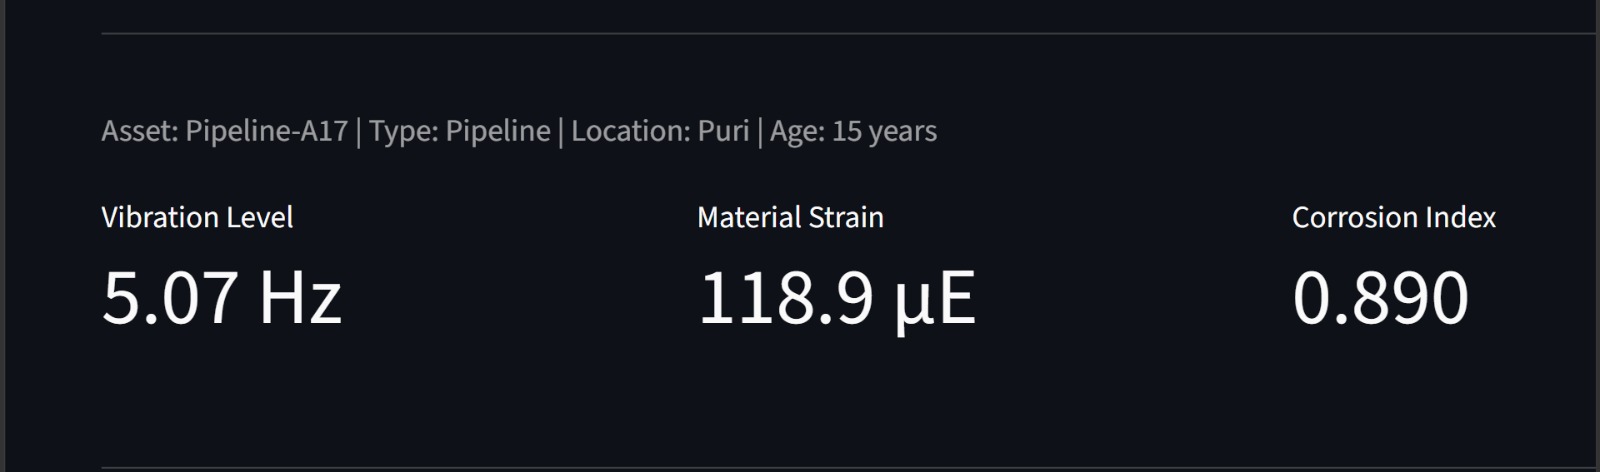
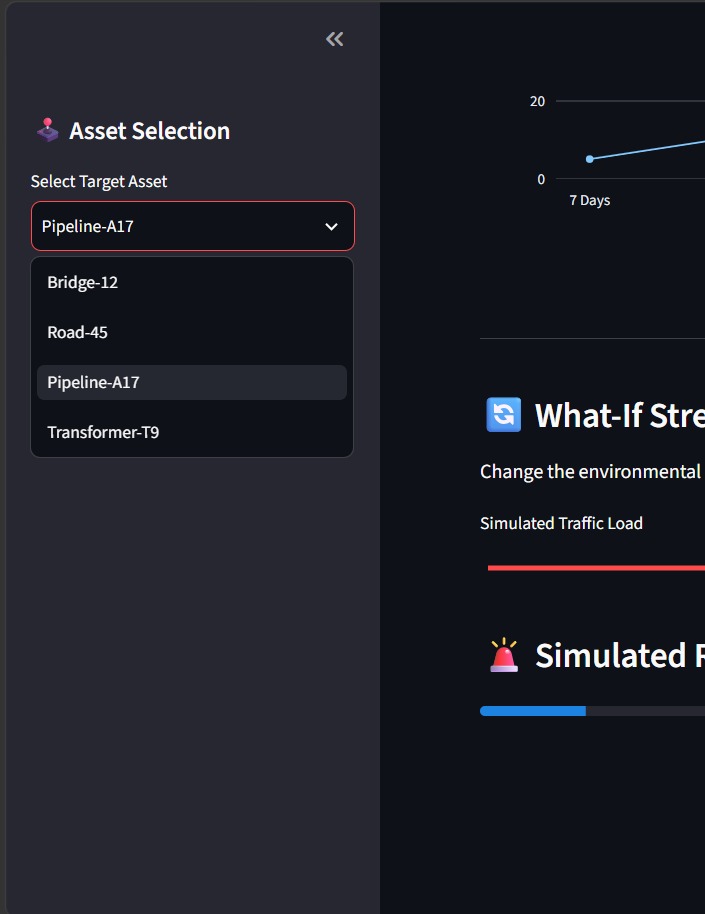
assets
-
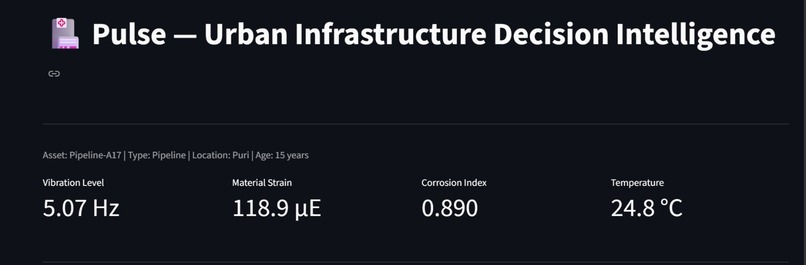
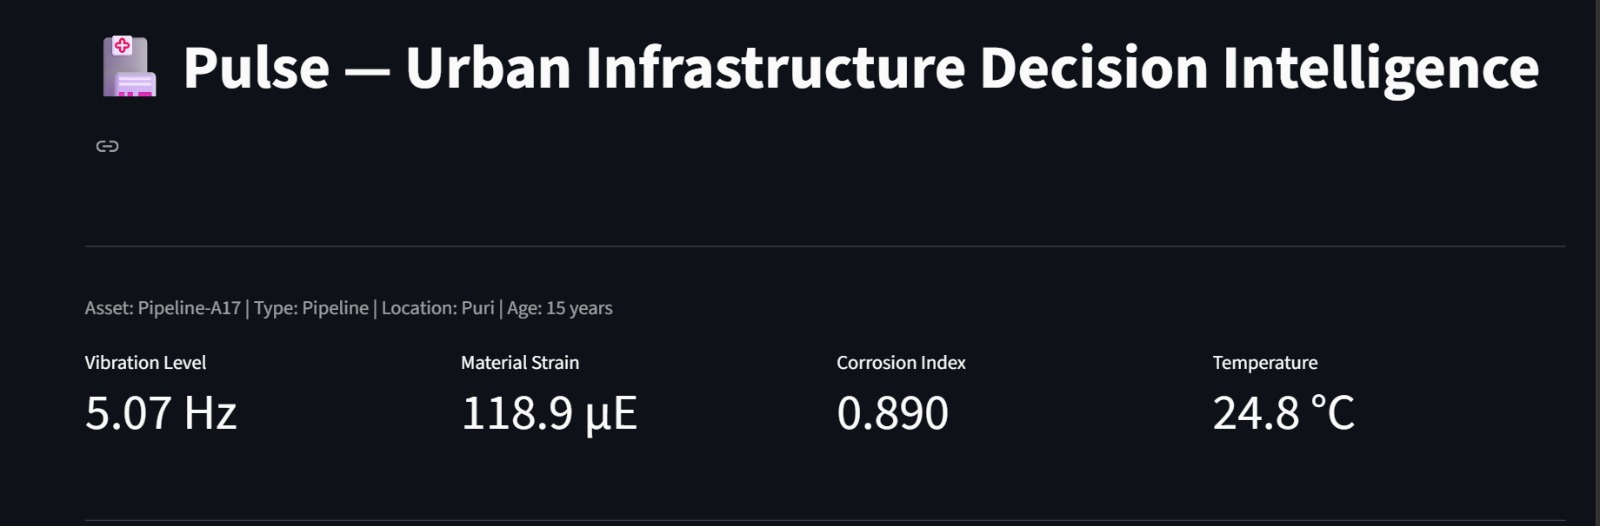
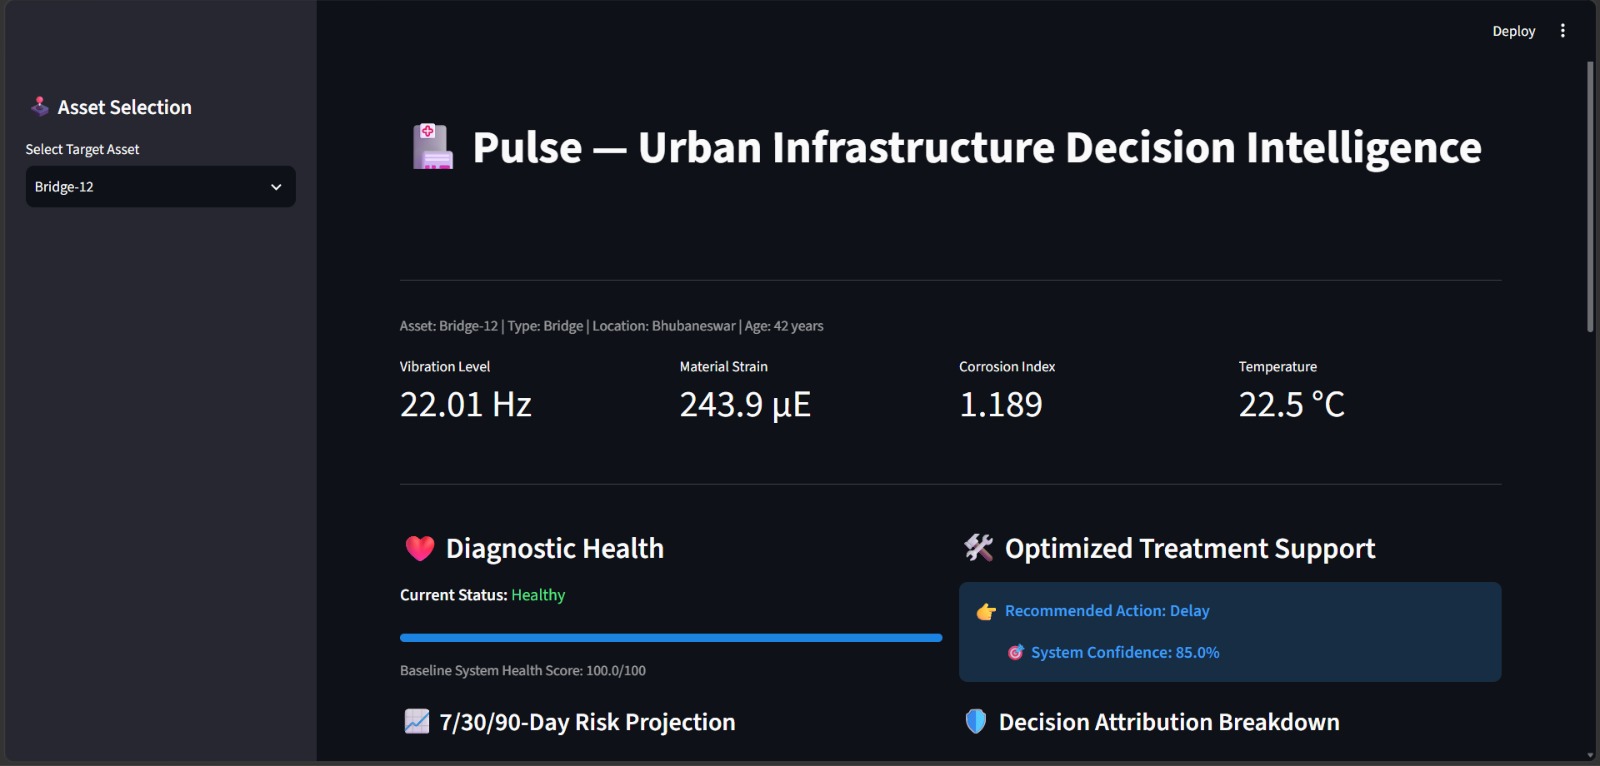
title page
-
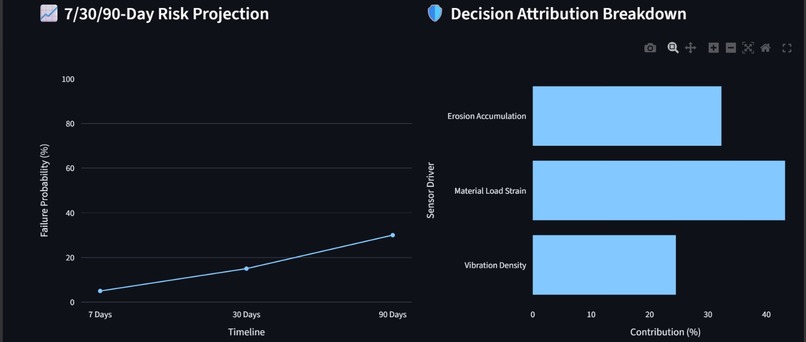
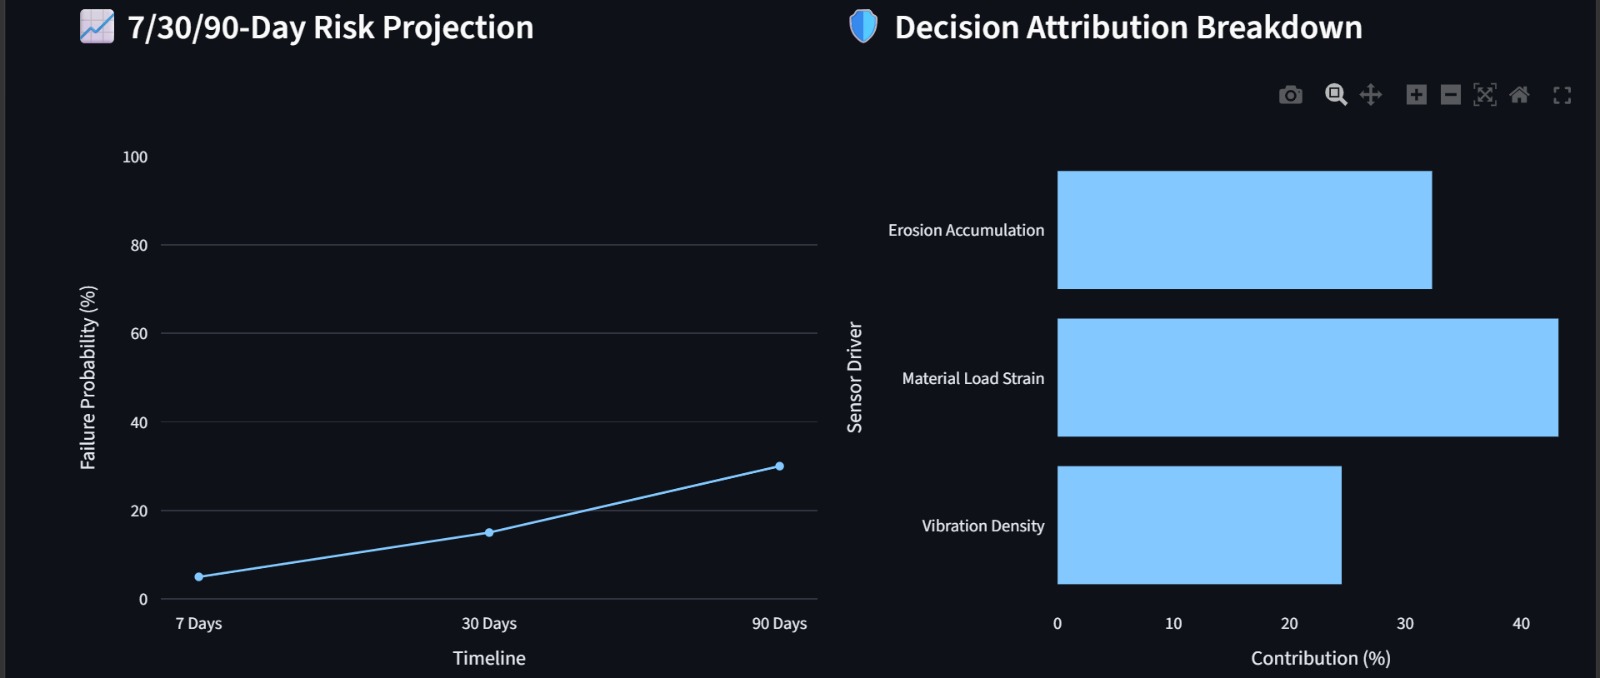
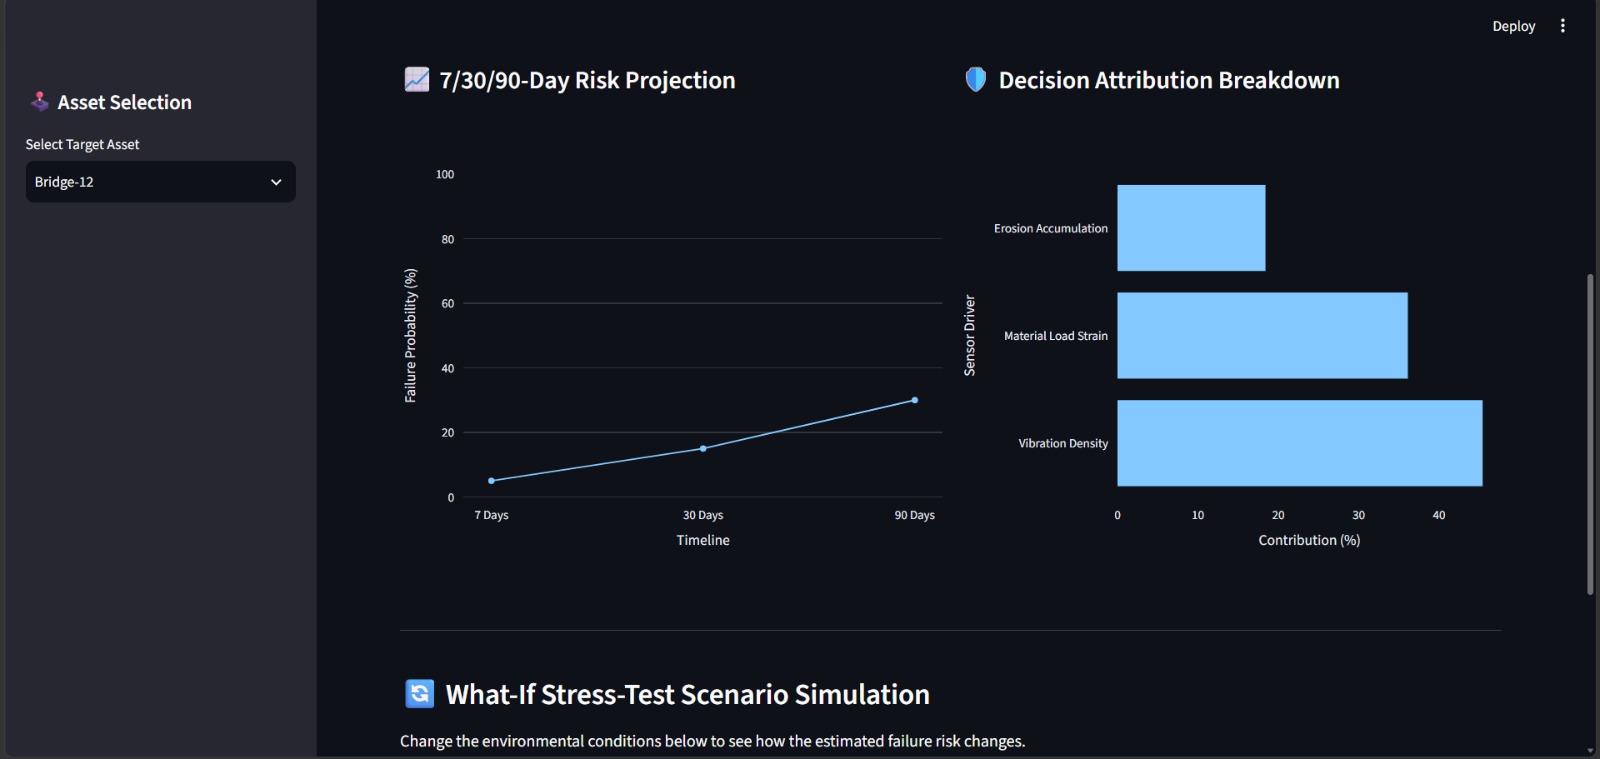
projection graph and decision breakdown
-
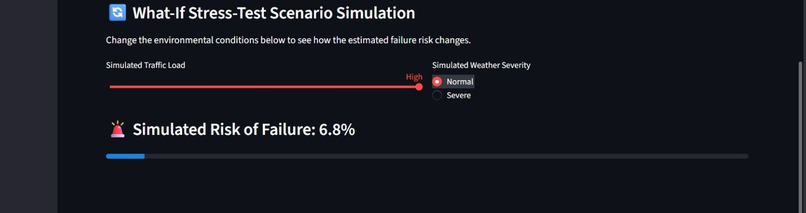
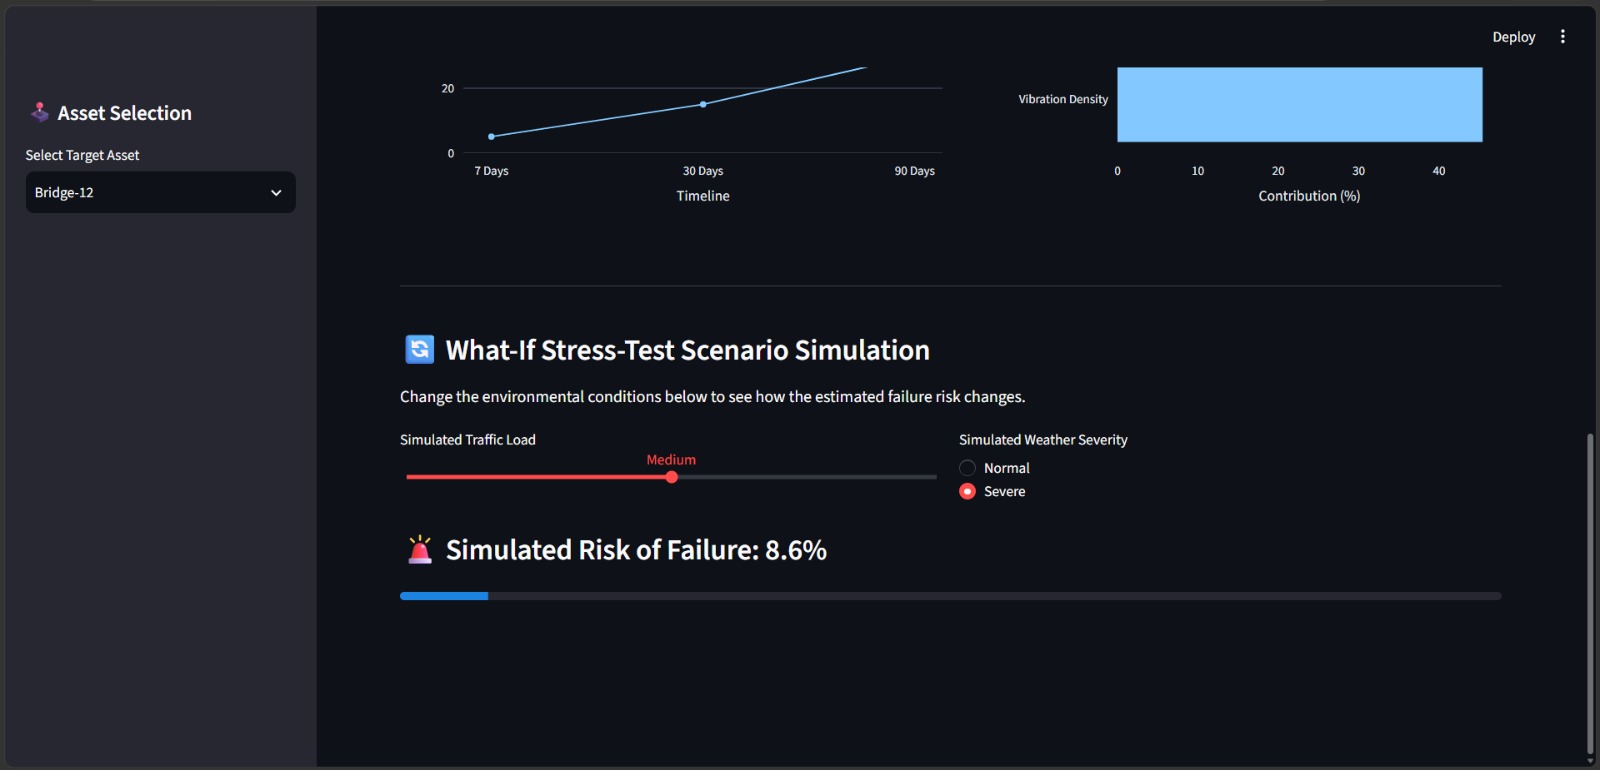
scenario simulation
-
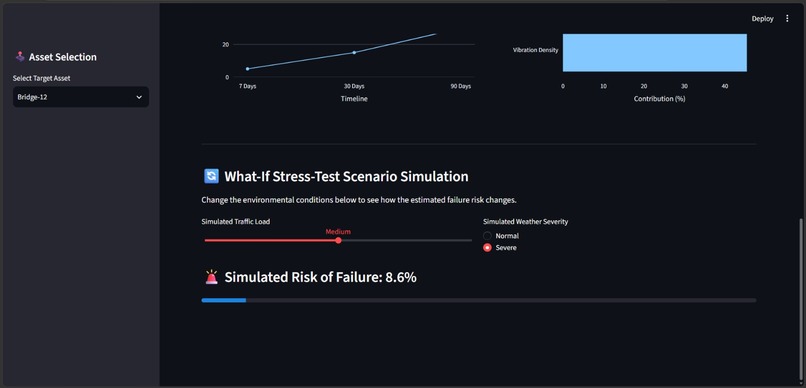
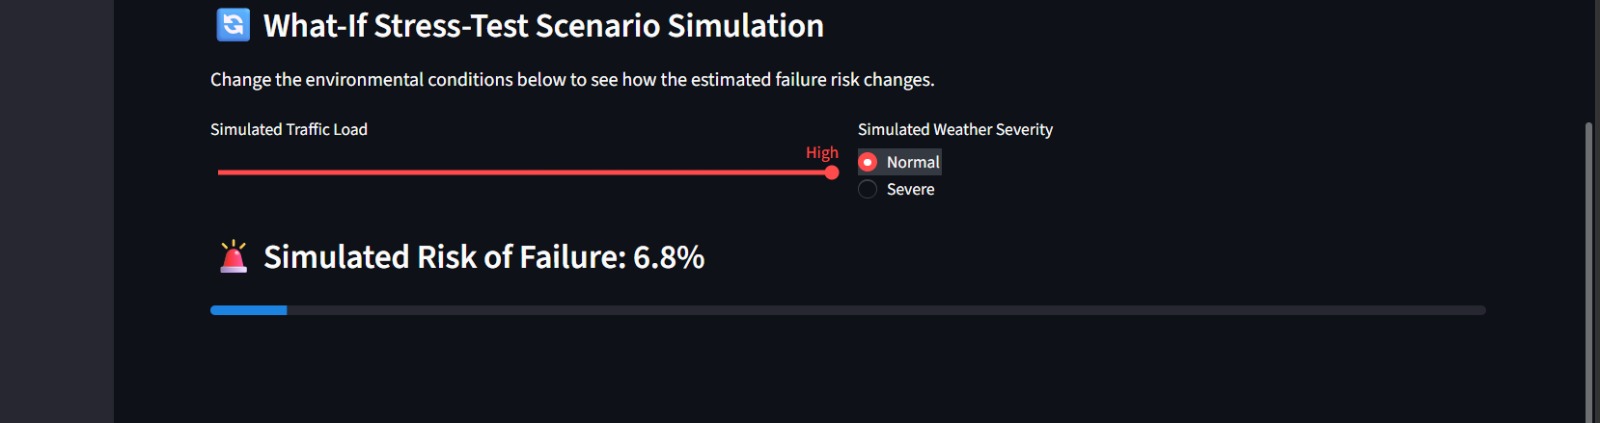
at severe conditions
-
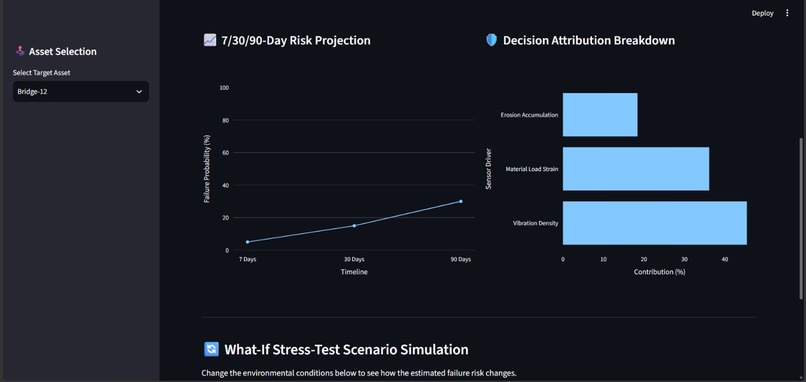
plots
-
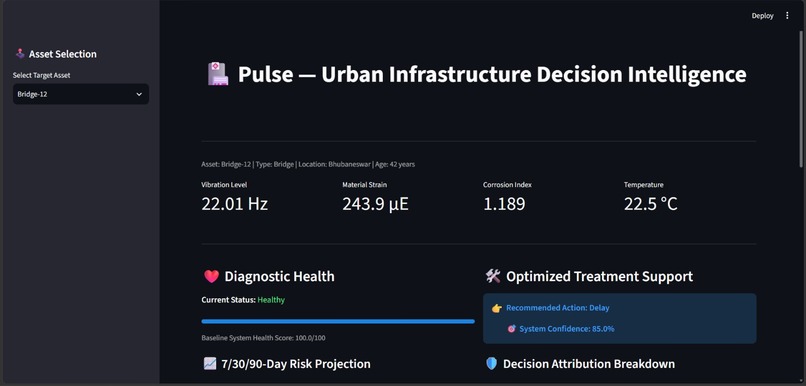
overview
Inspiration
Infrastructure usually doesn't fail without warning. Minor shifts in operating frequencies, increasing material load stress, and gradual chemical corrosion create subtle physical signals long before a catastrophic failure occurs. The problem is that these complex, multi-sensor signals are incredibly difficult for public works teams to translate into clear, timely maintenance actions.
We built Pulse around a direct, vital question: What if critical urban infrastructure could be monitored, diagnosed, and treated exactly like a living medical patient before failure becomes inevitable?
We were inspired by high-stakes reinforcement learning controllers and decision intelligence systems. We wanted to bridge the gap between raw, messy sensor arrays and real-world execution, shifting the municipal paradigm from generic "something might be wrong" alerts to "this is exactly what will happen next, and this is the optimized action to take."
What it does
Pulse acts as an end-to-end intelligent decision core for public works infrastructure. It monitors physical sensor streams, isolates structural anomalies, projects degradation risk trajectories across 7, 30, and 90 days, stress-tests assets under variable environmental overrides, and delivers clear, cost-optimized, and transparent treatment pathways directly to municipal operators.
The current production prototype tracks four distinct civil asset typologies (Bridges, Roads, Pipelines, and Transformers). It completely eliminates the black-box nature of traditional AI solutions by providing an explicit system confidence rating and localized feature attribution charts right next to the recommendation.
How we built it
How we built it
Pulse is implemented as a highly cohesive Python application driven by a clean, responsive Streamlit user interface. The entire architecture follows a flat, high-velocity layout to ensure look-up free execution:
Telemetry Ingestion ➔ Digital Twin Mapping ➔ XGBoost Prediction ➔ Bayesian Stress Test ➔ Multi-Objective Optimization ➔ Recommendation
1. Physics-Informed Data Generation Pipeline (src/data/)
To train accurate models without relying on meaningless random noise, we engineered a deterministic, physics-informed data generator that models a 365-day tracking cycle. The data generation loop integrates seasonal environmental conditions, linear wear mechanics, and structural anomalies:
Seasonal Ambient Waves: Models cyclic weather patterns via a sinusoidal wave:
T_t = 25.0 + 15.0 * sin((2 * pi * t) / 365) + GaussianNoise(0, 1.2)Vibration Density Channel: Accounts for baseline asset frequencies, progressive aging, and seasonal contraction:
V_t = V_base * Age_Factor + (V_base * Wear_t) + GaussianNoise(0, 0.3) + 0.5 * sin((2 * pi * t) / 365)Material Load Strain Channel: Simulates physical contraction and structural payload:
S_t = S_base * Age_Factor + (0.8 * T_t) + GaussianNoise(0, 4.0)Erosion Accumulation Index: Modeled as a non-decreasing cumulative wear sum tracking material breakdown:
C_t = Sum_from_0_to_t( | GaussianNoise(0.002, 0.0004) | ) * Age_Factor
Where Age_Factor = 1.0 + (Age * 0.015) acts as the structural degradation aging scalar, and Wear_t = (t / 365) * 0.12 * Age_Factor represents linear material wear-and-tear over time.
2. Digital Twin Memory State Tracker (src/digital_twin/)
Rather than processing anonymous rows in a database, Pulse maps sensor matrices straight into an immutable InfrastructureAsset identity dataclass (frozen=True) and initializes a mutable, in-memory DigitalTwinState wrapper. The twin machine maintains active internal metrics arrays, caches entries chronologically inside a log buffer (telemetry_history), and exports data structures via a streamlined .to_dict() layout for direct UI parsing.
3. The Core Machine Learning Engines (src/diagnosis/ & src/forecasting/)
Automated Diagnostics Classifier: Trains a localized XGBoost Classifier (f_clf) to process arriving telemetry snapshots and map them to discrete categorical anomaly targets (y in {0, 1}) injected during flash floods and freeze events, optimizing log-loss criteria:
Log_Loss = -1/N * Sum( y_i * log(y_hat_i) + (1 - y_i) * log(1 - y_hat_i) )The output anomaly class probability (y_hat) maps straight to a scalar system health score metric:
Health Score = (1.0 - y_hat) * 100Horizon Risk Forecasting Regressor: Employs an XGBoost Time-Series Regressor (f_reg) trained to map baseline variables out to continuous long-term degradation projections. The base risk output is then extrapolated outwards across explicit operational horizons:
Risk_7  = min(100.0, f_reg(X) * 1.05)
Risk_30 = min(100.0, f_reg(X) * 1.25)
Risk_90 = min(100.0, f_reg(X) * 1.65)
4. Bayesian Scenario Stress-Testing (src/bayesian/)
To allow manual operational stress testing independently of historical timespans, we introduced a deterministic Bayesian logic net. It takes categorical operator overrides—Traffic Load (L_tr in {1.0, 1.15, 1.35}) and Weather Severity (W_sev in {1.0, 1.5})—and calculates real-time failure probabilities given the current diagnosis status base risk (P_base):
Simulated Risk = min(100.0, P_base * L_tr * W_sev * 100)
5. Multi-Objective Decision Optimizer (src/optimizer/)
This evaluation layer converts raw multi-model probabilities into a discrete intervention recommendation vector R in {Repair, Delay, Replace} by maximizing discrete utility score pathways from our locked Recommendation configuration Enums:
- Repair Utility:
text U(Repair) = Indicator(Status = Warning) * 40 + Indicator(Status = Critical) * 70 + (Priority_Weight * 3.0) - Delay Utility:
text U(Delay) = Health Score * 0.6 - Replace Utility:
text
U(Replace) = Indicator(Status = Critical AND Health Score < 30) * 95 + (Priority_Weight * 2.0)
The system computes the optimal strategy pathway via direct programmatic score selection bounds:
Optimal_Action = argmax( U(Repair), U(Delay), U(Replace) )
Where Priority_Weight is the municipal priority urgency factor assigned to high-traffic city structures.
6. Local Feature Attribution Engine (src/explainability/)
To decouple Pulse from standard black-box AI problems, we implemented a localized SHAP feature attribution calculator. It computes real-time contribution profiles by extracting relative signal impact weights across sensor boundaries:
W_vib = clip(V_t * 2.0, 10, 45)
W_strain = clip(S_t * 0.15, 10, 35)
W_corr = clip(C_t * 15.0, 5, 30)

Contribution_i (%) = ( W_i / (W_vib + W_strain + W_corr) ) * 100
Challenges we ran into
The most difficult hurdle was connecting multiple independent machine learning and logic tracks into a single, cohesive workflow where an upstream prediction dynamically drives a downstream categorical recommendation.
A standard forecasting model can easily tell us that an engineering asset is deteriorating. However, translating a continuous risk matrix into a hard choice—while balancing municipal priority weights, data type alignments, and safety thresholds—required complex logic splitting. Keeping the codebase modular enough to execute separate automated test scripts (pytest) across 20 atomic validation checks while keeping the Streamlit user interface completely reactive and bug-free was a massive structural challenge.
Accomplishments that we're proud of
Pulse is not a static design mockup or a fragile prototype. It is a completely operational vertical slice:
- 100% Core Test Coverage Passed: Running
pytestvalidates all 11 test modules cleanly in under 2.5 seconds. - Zero-Latency In-Memory Pipelines: Eliminates database latency bottlenecks by handling state lookups instantly in volatile data trays.
- Stable Frontend Automation: Engineered custom Streamlit implementations (utilizing
indexinteger properties instead of deprecatedvaluekeyword arguments insidest.radio) to guarantee an error-free user experience.
What we learned
Our biggest takeaway was that an ML model is only a fraction of an intelligent system. Building Pulse forced us to think deeply about data engineering pipelines, path safety traversal boundaries, multi-objective optimization trade-offs, explainability schemas, and human-in-the-loop interaction. We learned that a standalone prediction holds very little value on its own; the real value lies entirely in the specific, explainable decision that the prediction enables.
What's next for Pulse
While Pulse is currently a functional local prototype, its modular layout allows for major scaling paths:
- Live IoT Ingestion: Connecting live MQTT sensor streams to continuously recalculate asset health matrices.
- CMMS Integration: Linking directly with enterprise computerized maintenance-management systems to auto-generate real repair work orders based on optimization triggers.
Built With
- automation
- data-ingestion
- data-science
- data-visualization
- decision-intelligence
- explainable-ai
- git
- github
- machine-learning
- numpy
- pandas
- plotly
- predictive-analysis
- pytest
- python
- scikit-learn
- software-engineering
- streamlit
- time-series
- xgboost

Log in or sign up for Devpost to join the conversation.