Inspiration
Businesses rarely fail because of one obvious problem. Often, warning signs appear in their data weeks before the underlying issue becomes clear. I wanted to build a tool that helps businesses notice these unusual patterns earlier and understand where to investigate, instead of simply looking at dashboards full of numbers.
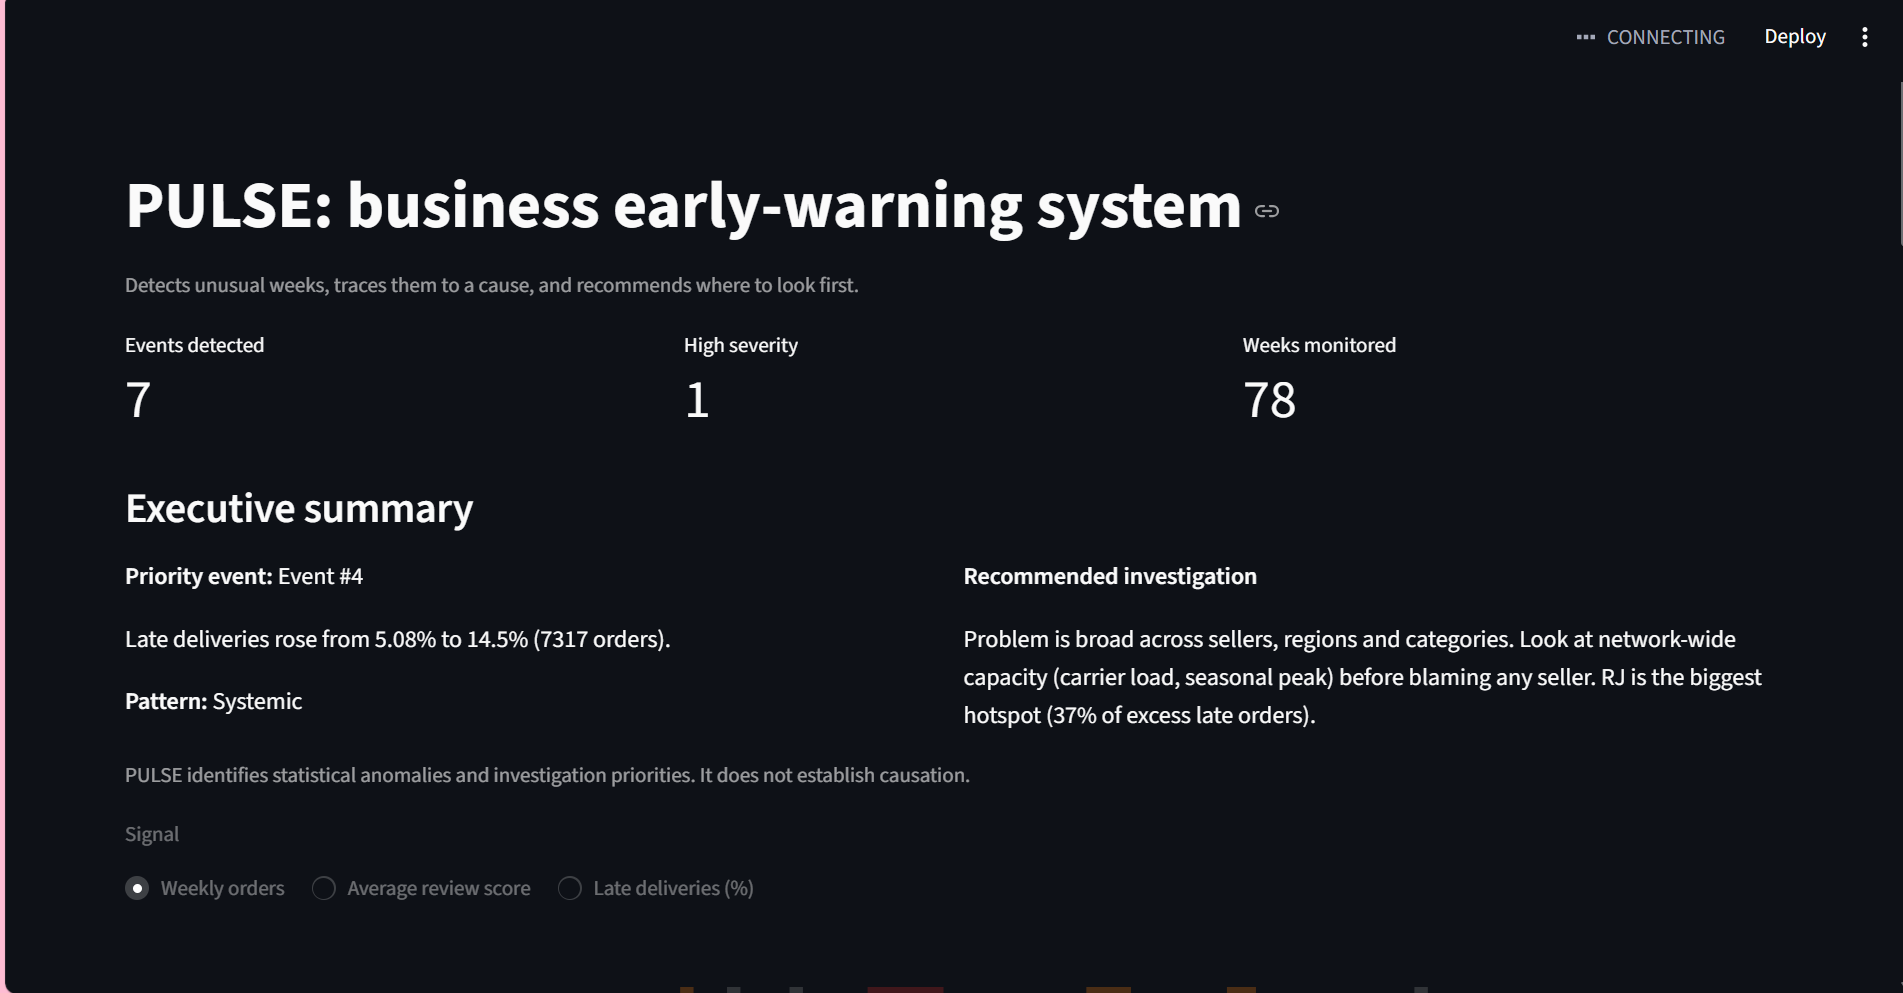
This inspired PULSE, an AI-powered business early-warning system that turns operational data into explainable alerts and investigation leads.
What it does
PULSE analyzes weekly business signals to detect unusual behavior, groups anomalies into events, assigns severity levels, and helps users investigate potential causes.
Using real Brazilian e-commerce data from the Olist dataset, PULSE identifies unusual changes in late deliveries and breaks them down by seller, region, and product category. It highlights potential hotspots, recurring seller issues, and whether a problem appears systemic or localized. Its interactive dashboard also includes investigation recommendations and a what-if simulator for exploring hypothetical changes.
PULSE is designed to help users decide what deserves attention first and where to investigate next. It identifies statistical signals, not proven causes.
How we built it
We built PULSE in Python using the Olist e-commerce dataset. A robust statistical anomaly-detection approach identifies unusual weekly behavior against a baseline. The investigation pipeline then examines delivery-delay patterns across different business segments and generates structured event reports.
We used Pandas for data processing and analysis, and Streamlit to build an interactive dashboard where users can review detected events, compare signals, explore investigation leads, and examine recommendations.
Challenges we faced
One of the main challenges was turning statistical anomalies into information that a business user could actually understand. Detecting an unusual value is only the first step; explaining its scale, identifying where the excess is concentrated, and communicating uncertainty are equally important.
We also had to account for low-volume events, avoid presenting correlations as proven causes, and make the dashboard's explanations useful without overstating what the data can establish.
What we learned
Building PULSE taught us that useful AI systems need more than detection. They need context, evidence, understandable explanations, and honest limitations. We also learned how to connect data processing, statistical analysis, investigation logic, and an interactive application into one end-to-end project.
What's next
Future improvements could include additional business signals, stronger validation against labeled incidents, more rigorous false-positive evaluation, and integration with live operational data.
PULSE aims to turn unexpected business signals into earlier, clearer, and more actionable investigations.
Built With
- anomaly-detection
- business-intelligence
- data
- data-science
- data-visualization
- e-commerce
- explainable-ai
- machine-learning
- pandas
- plotly
- python
- statistical-analysis
- streamlit

Log in or sign up for Devpost to join the conversation.