-
Cover
-
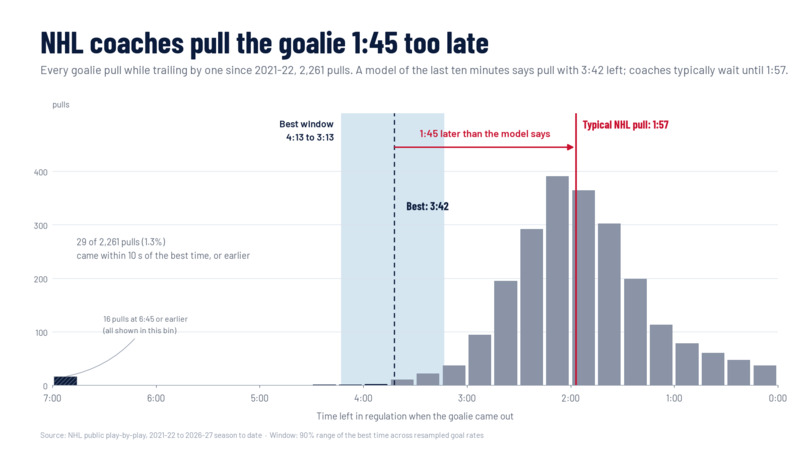
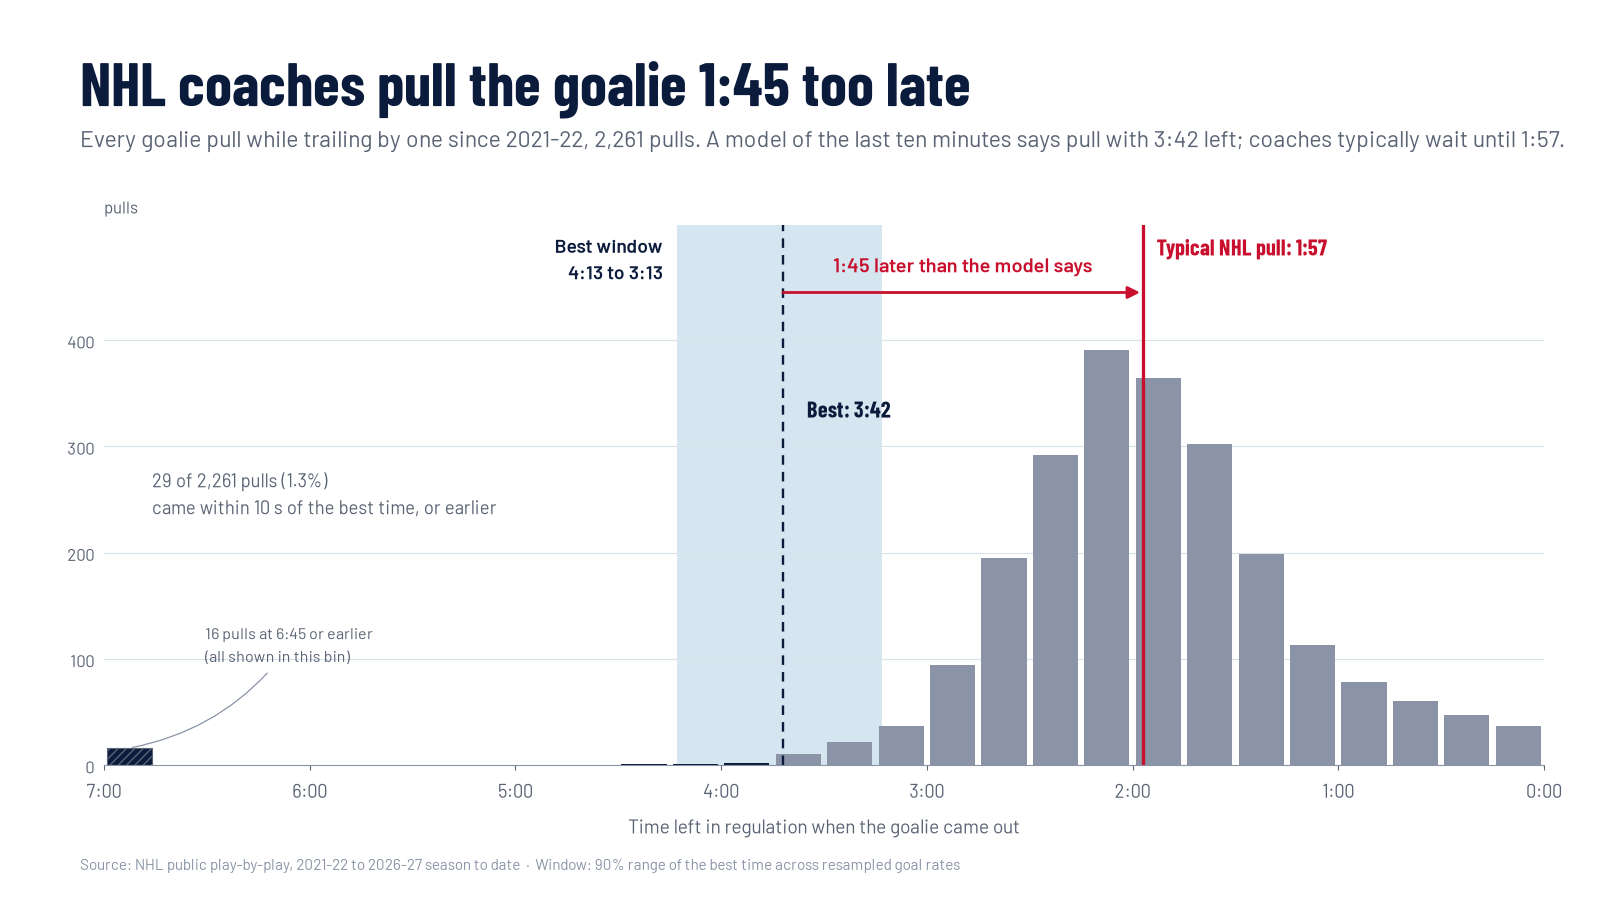
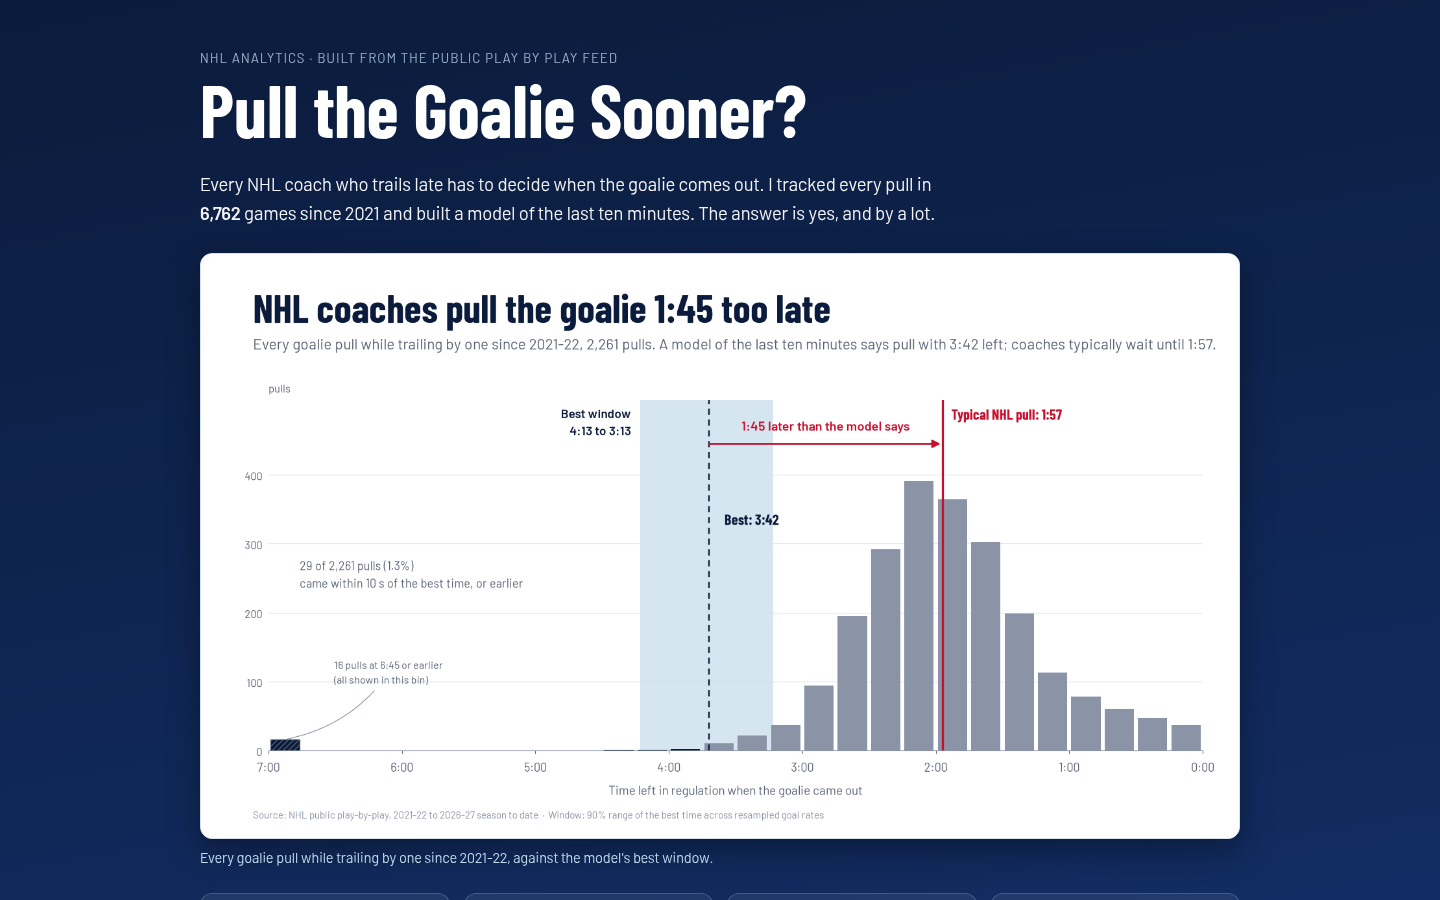
Every down 1 pull since 2021-22 against the best window
-
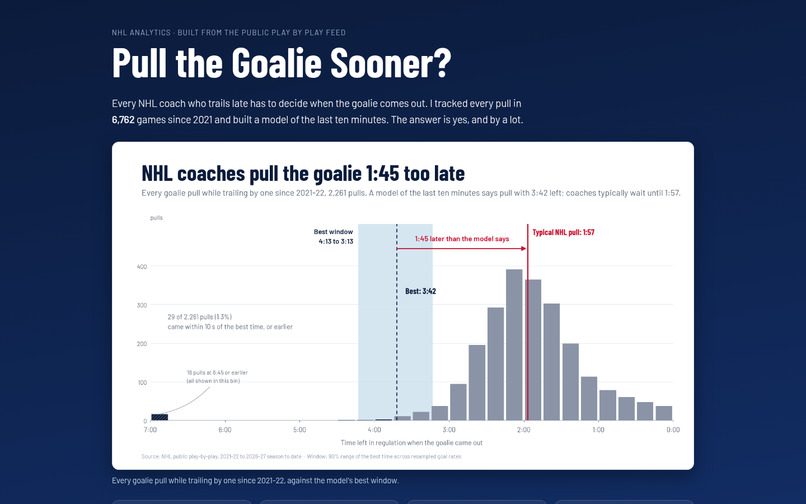
Live dashboard
-
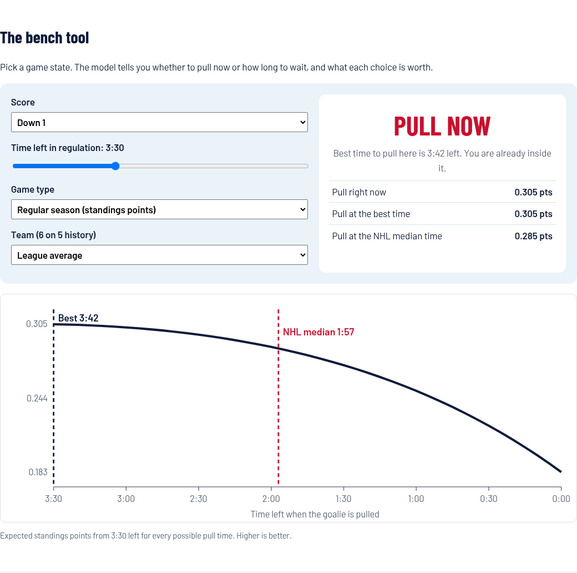
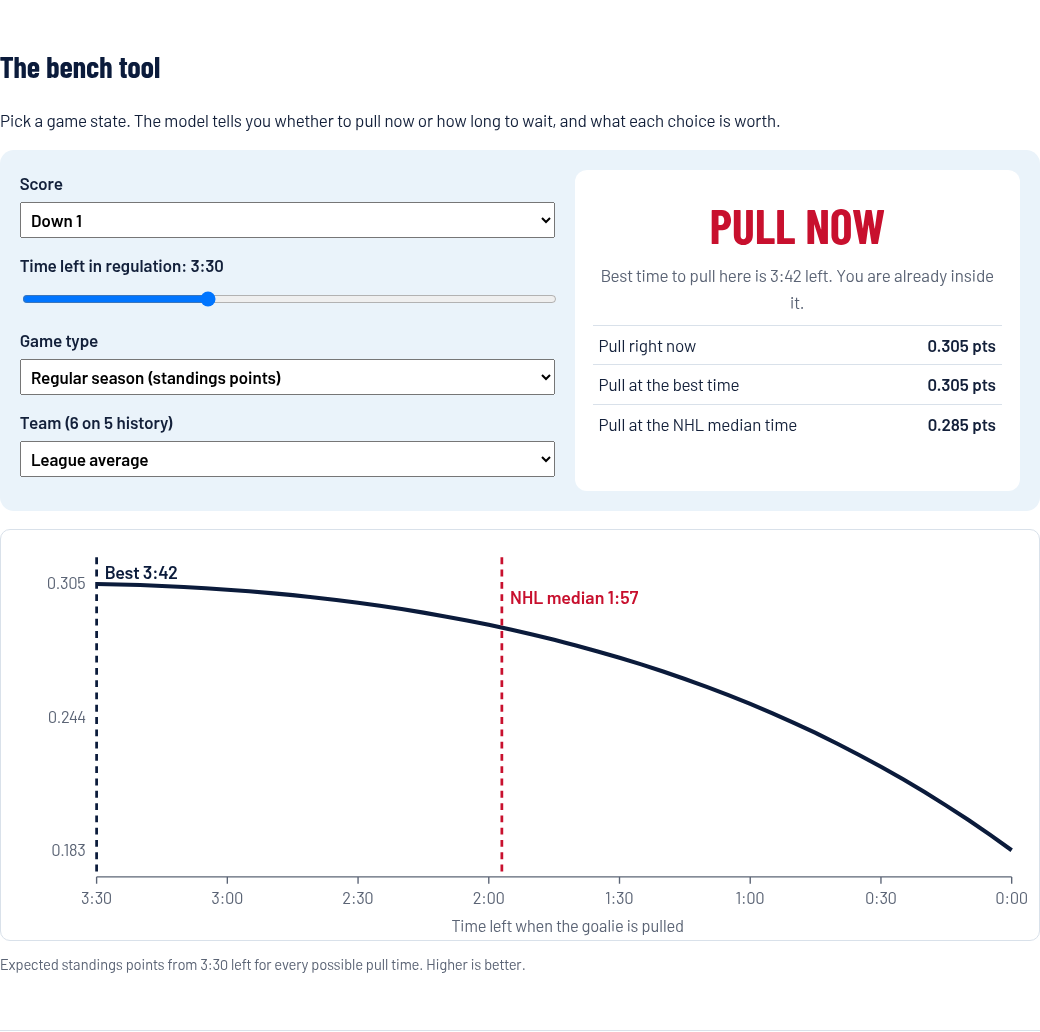
Bench tool, down 1 with 3:30 left: PULL NOW
-
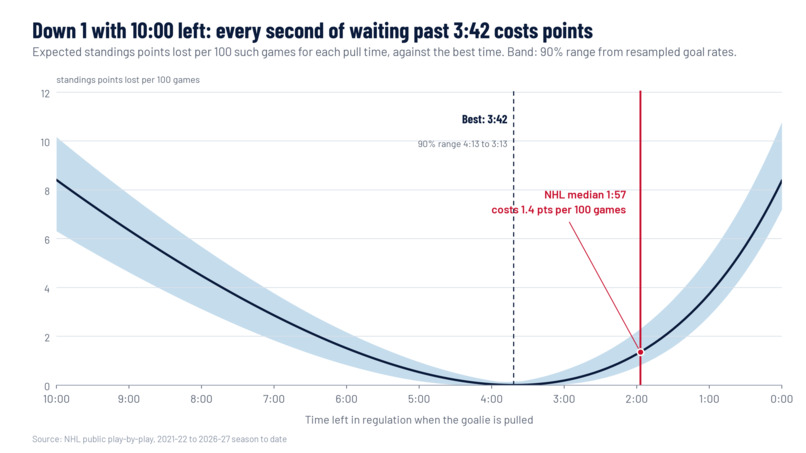
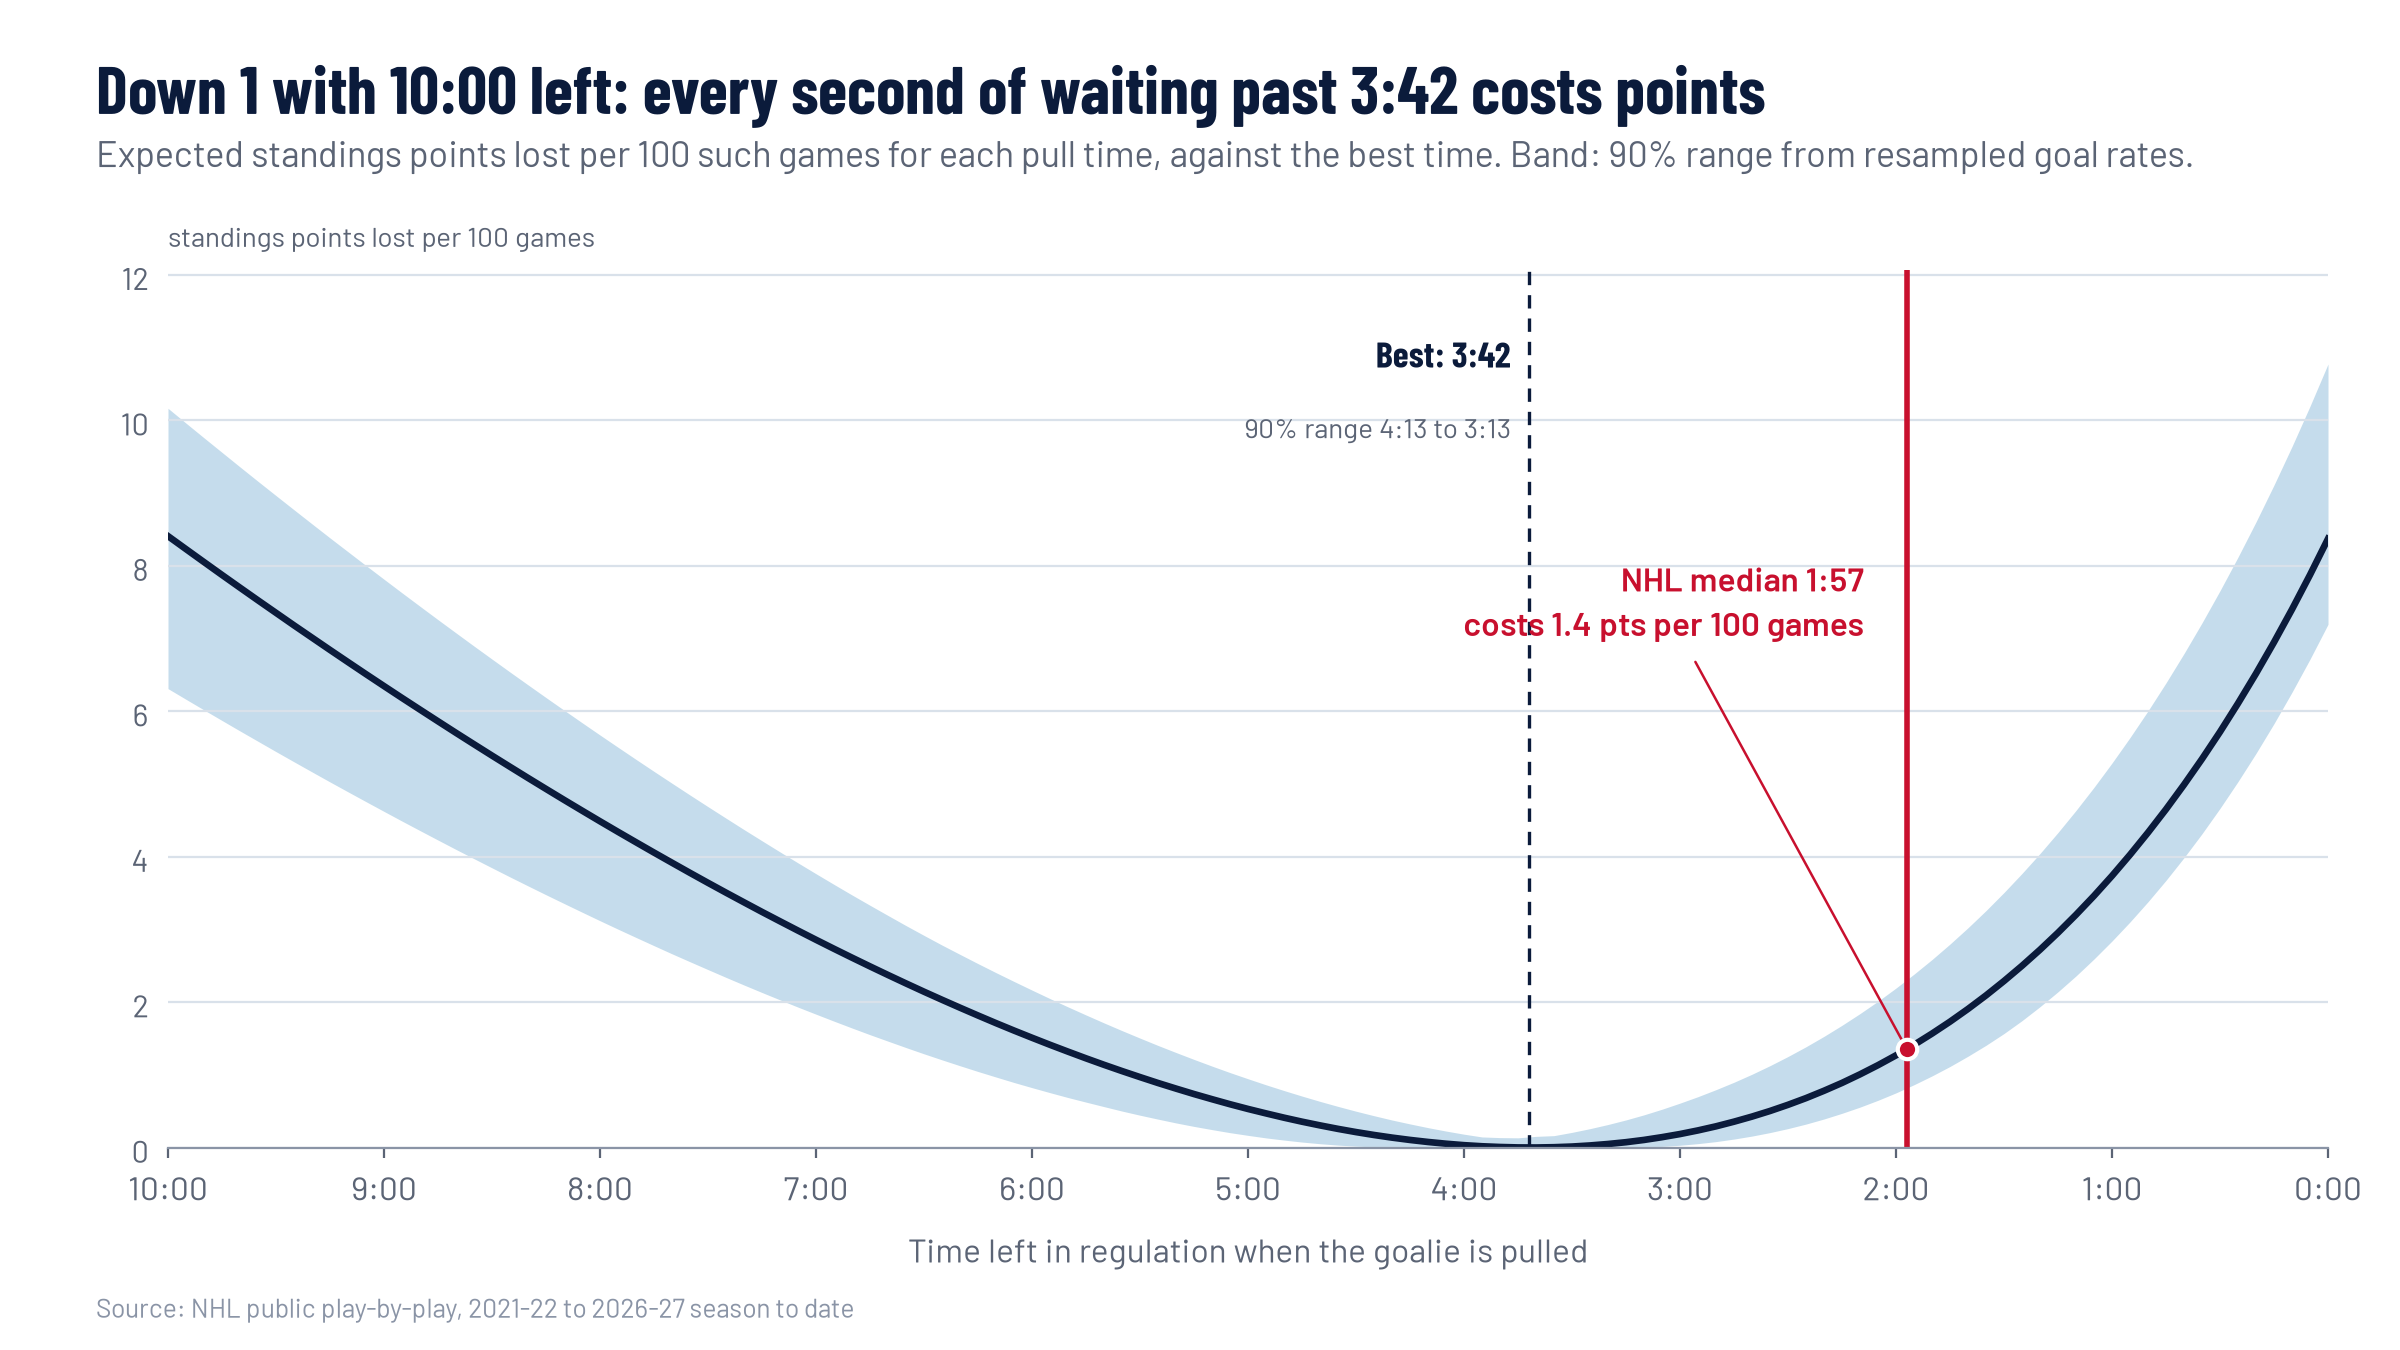
Cost of each pull time, down 1
-
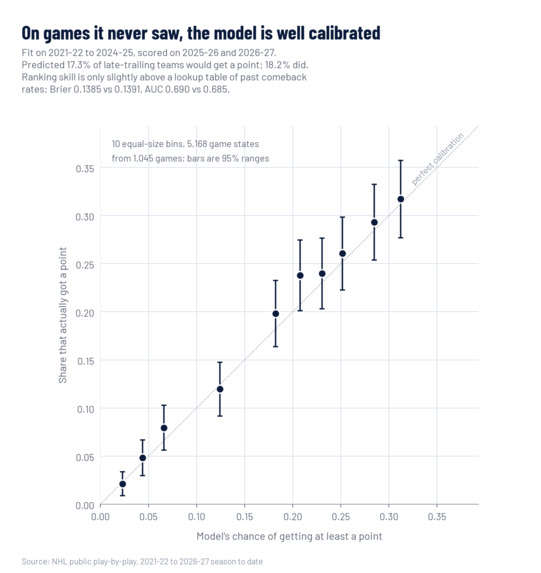
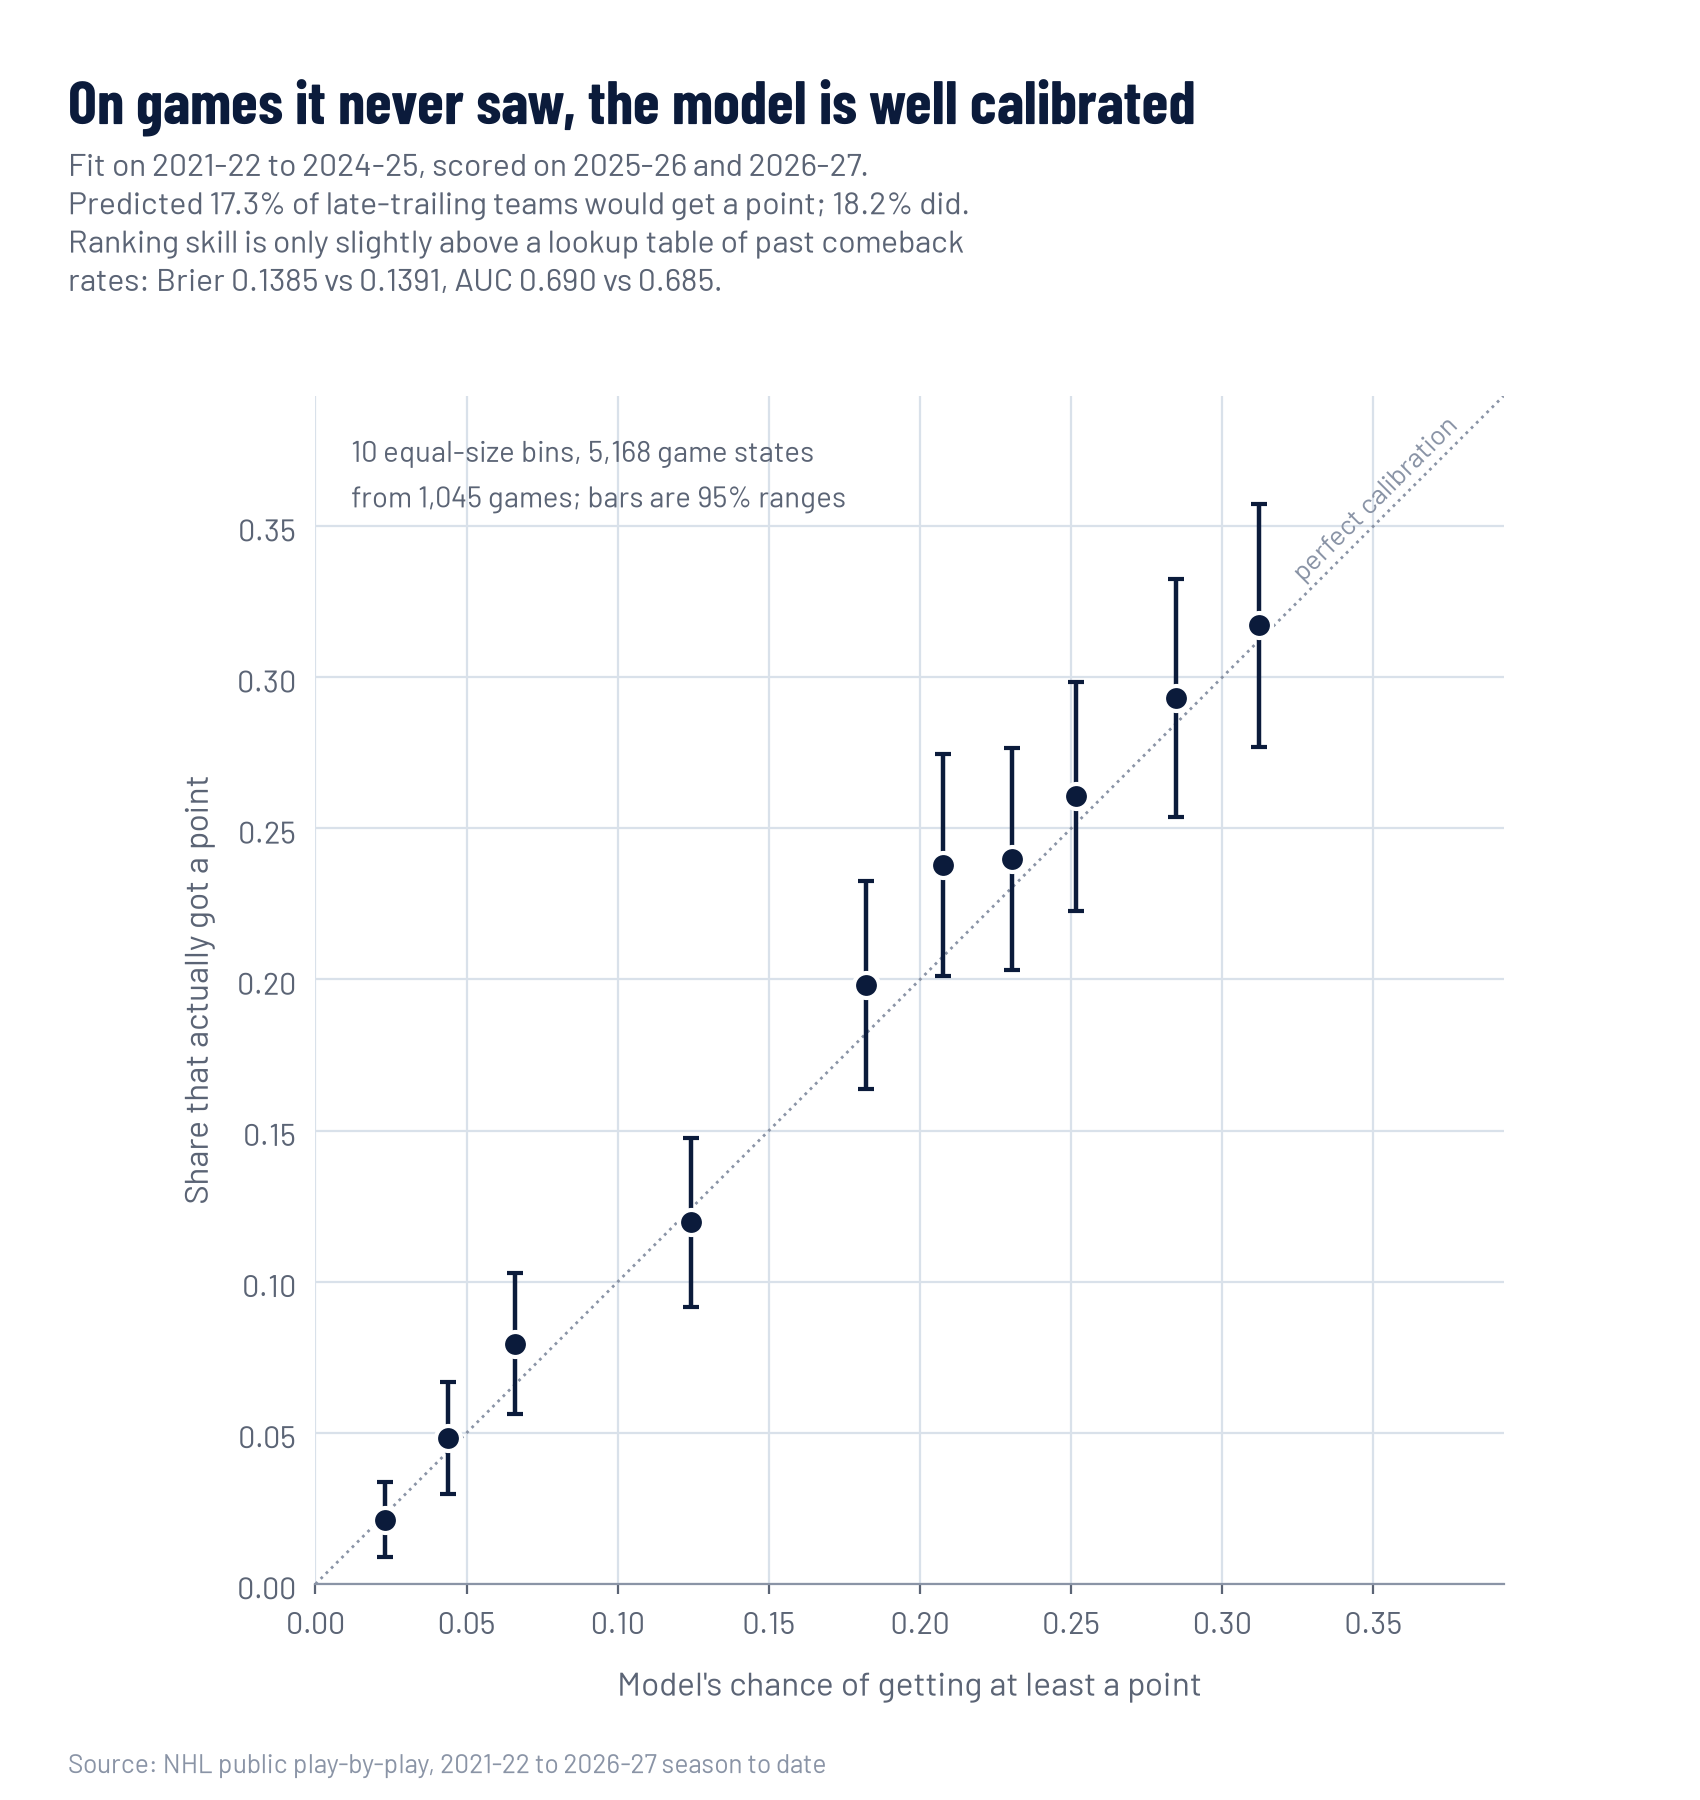
Calibration on seasons the model never saw
-
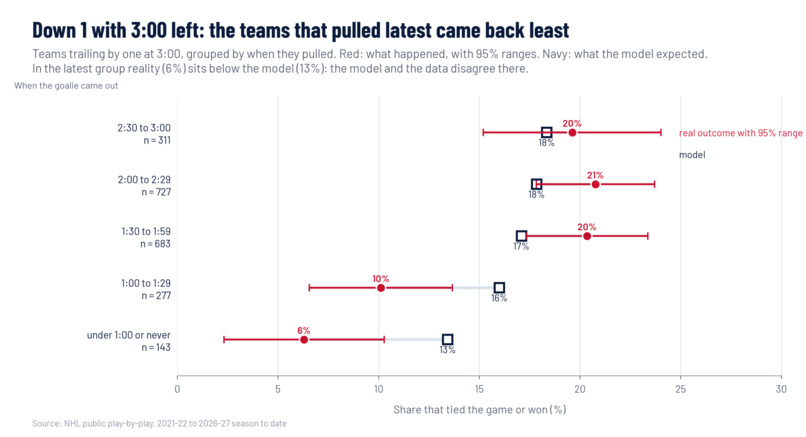
Real comeback rates by pull time
-
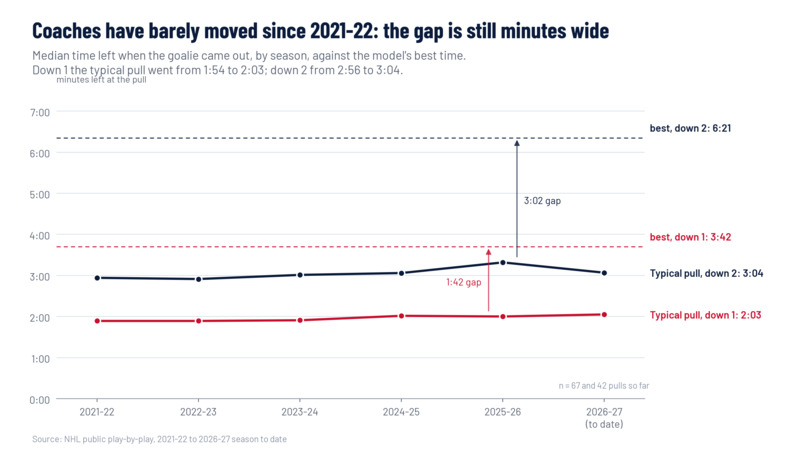
Pull times by season
-
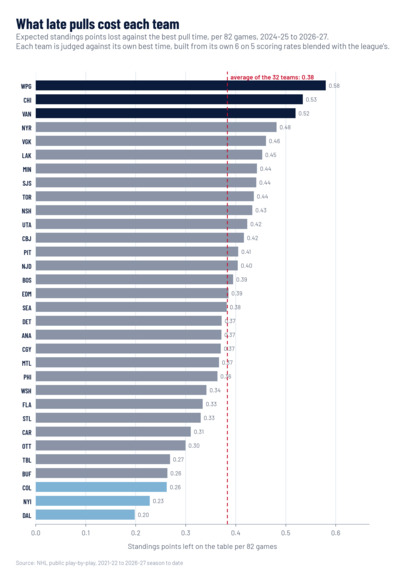
Points lost per 82 games, every team
-
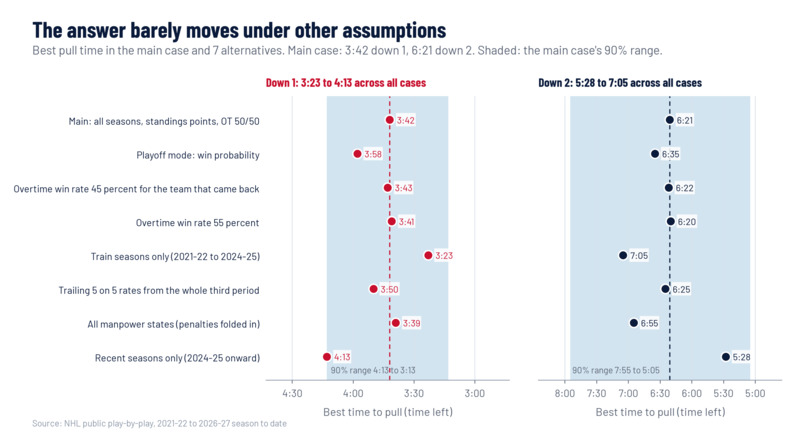
Best time under 8 settings
Inspiration
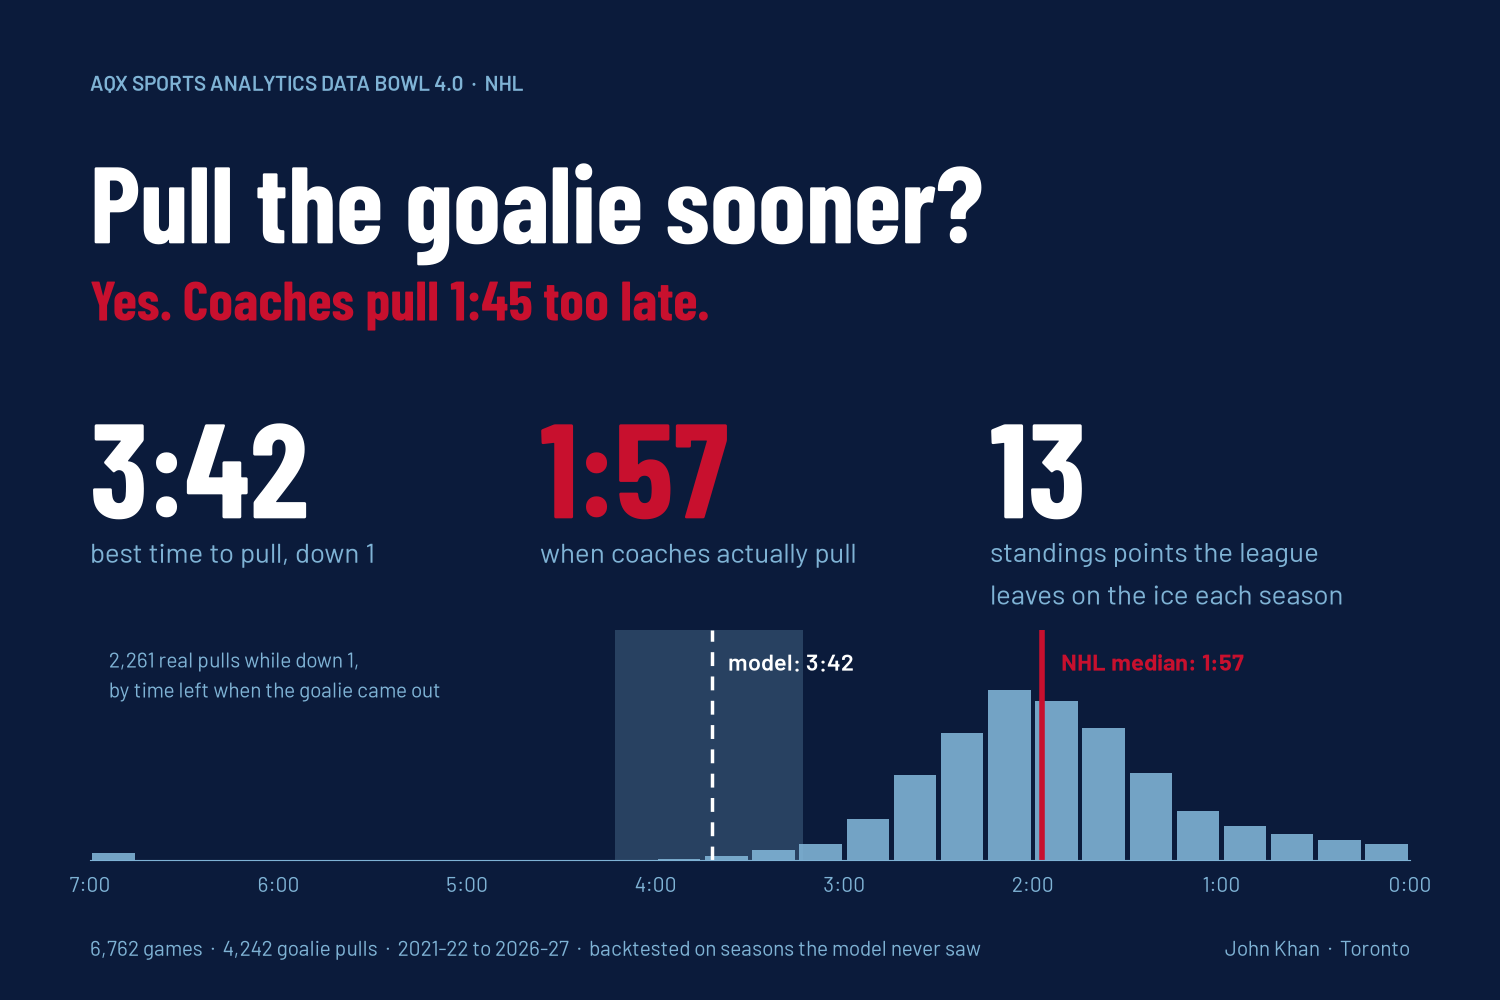
Every hockey fan has yelled "pull the goalie!" at the TV. Analysts have argued for years that coaches wait too long, but most of that work used old data and never checked itself against new games. I wanted a real answer from current NHL data, a number a coach could take to the bench, and proof that it holds up on games the model has never seen.
What it does
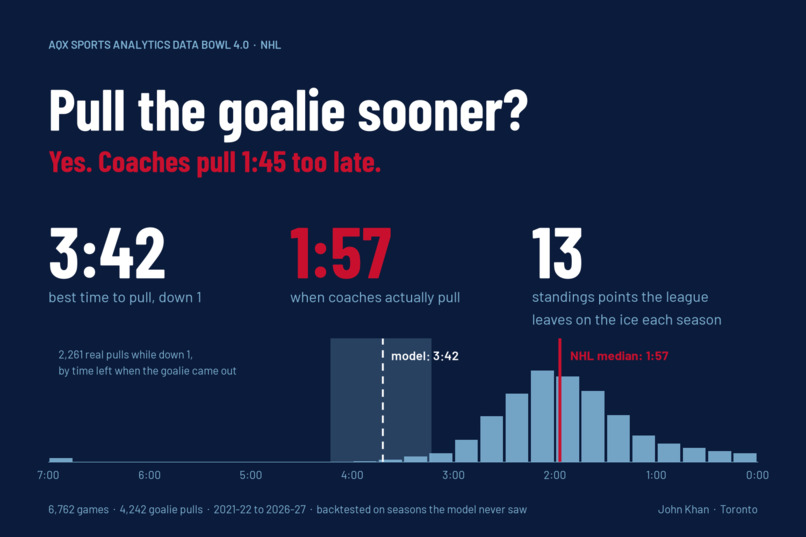
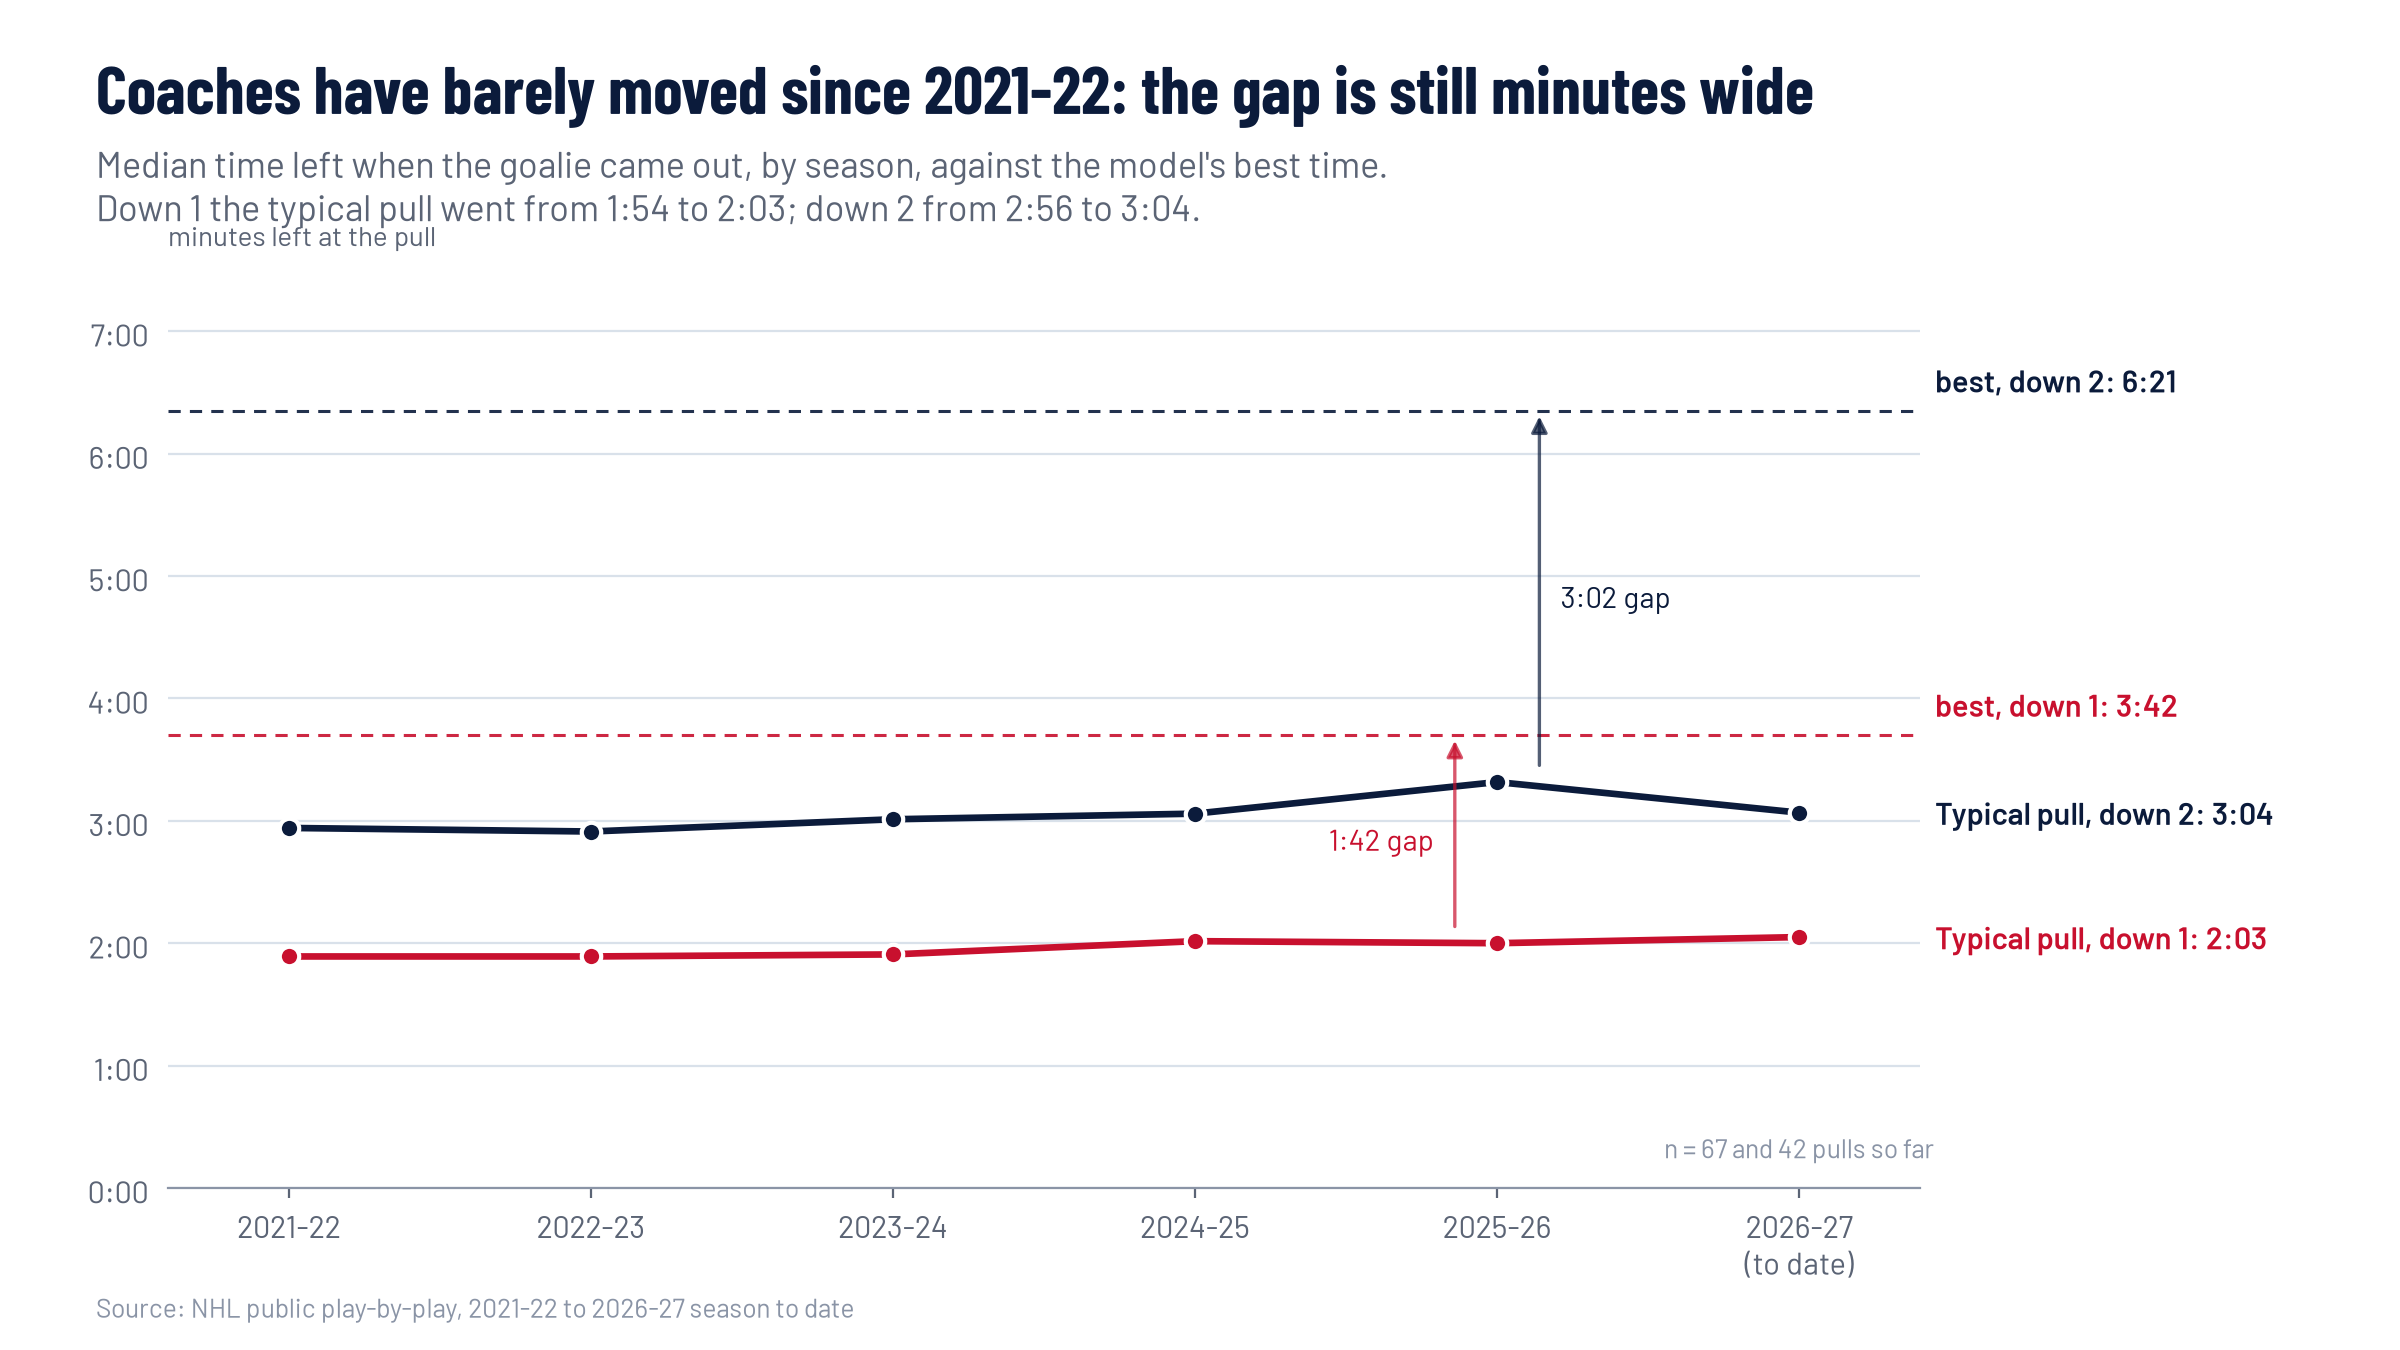
- Answers the question. Down 1, the best time to pull is 3:42 left (90% range 3:13 to 4:13). Down 2, it is 6:21 left (5:05 to 7:55). The NHL median is 1:57 and 3:03.
- Measures the gap. Of 2,261 pulls while down 1 since 2021, 29, about 1 in 100, came within 10 seconds of the best time or earlier. Late pulls cost the league about 13 standings points every season, about 0.40 points per team, and 98% of that comes from pulling too late rather than too early. Races for the last playoff spot are often decided by a single point.
- Bench tool. Pick down 1, 2 or 3, the time left, regular season or playoffs, and a team. It says PULL NOW or WAIT and shows the expected points for pulling now, at the best time and at the NHL median, plus a chart of every possible pull time.
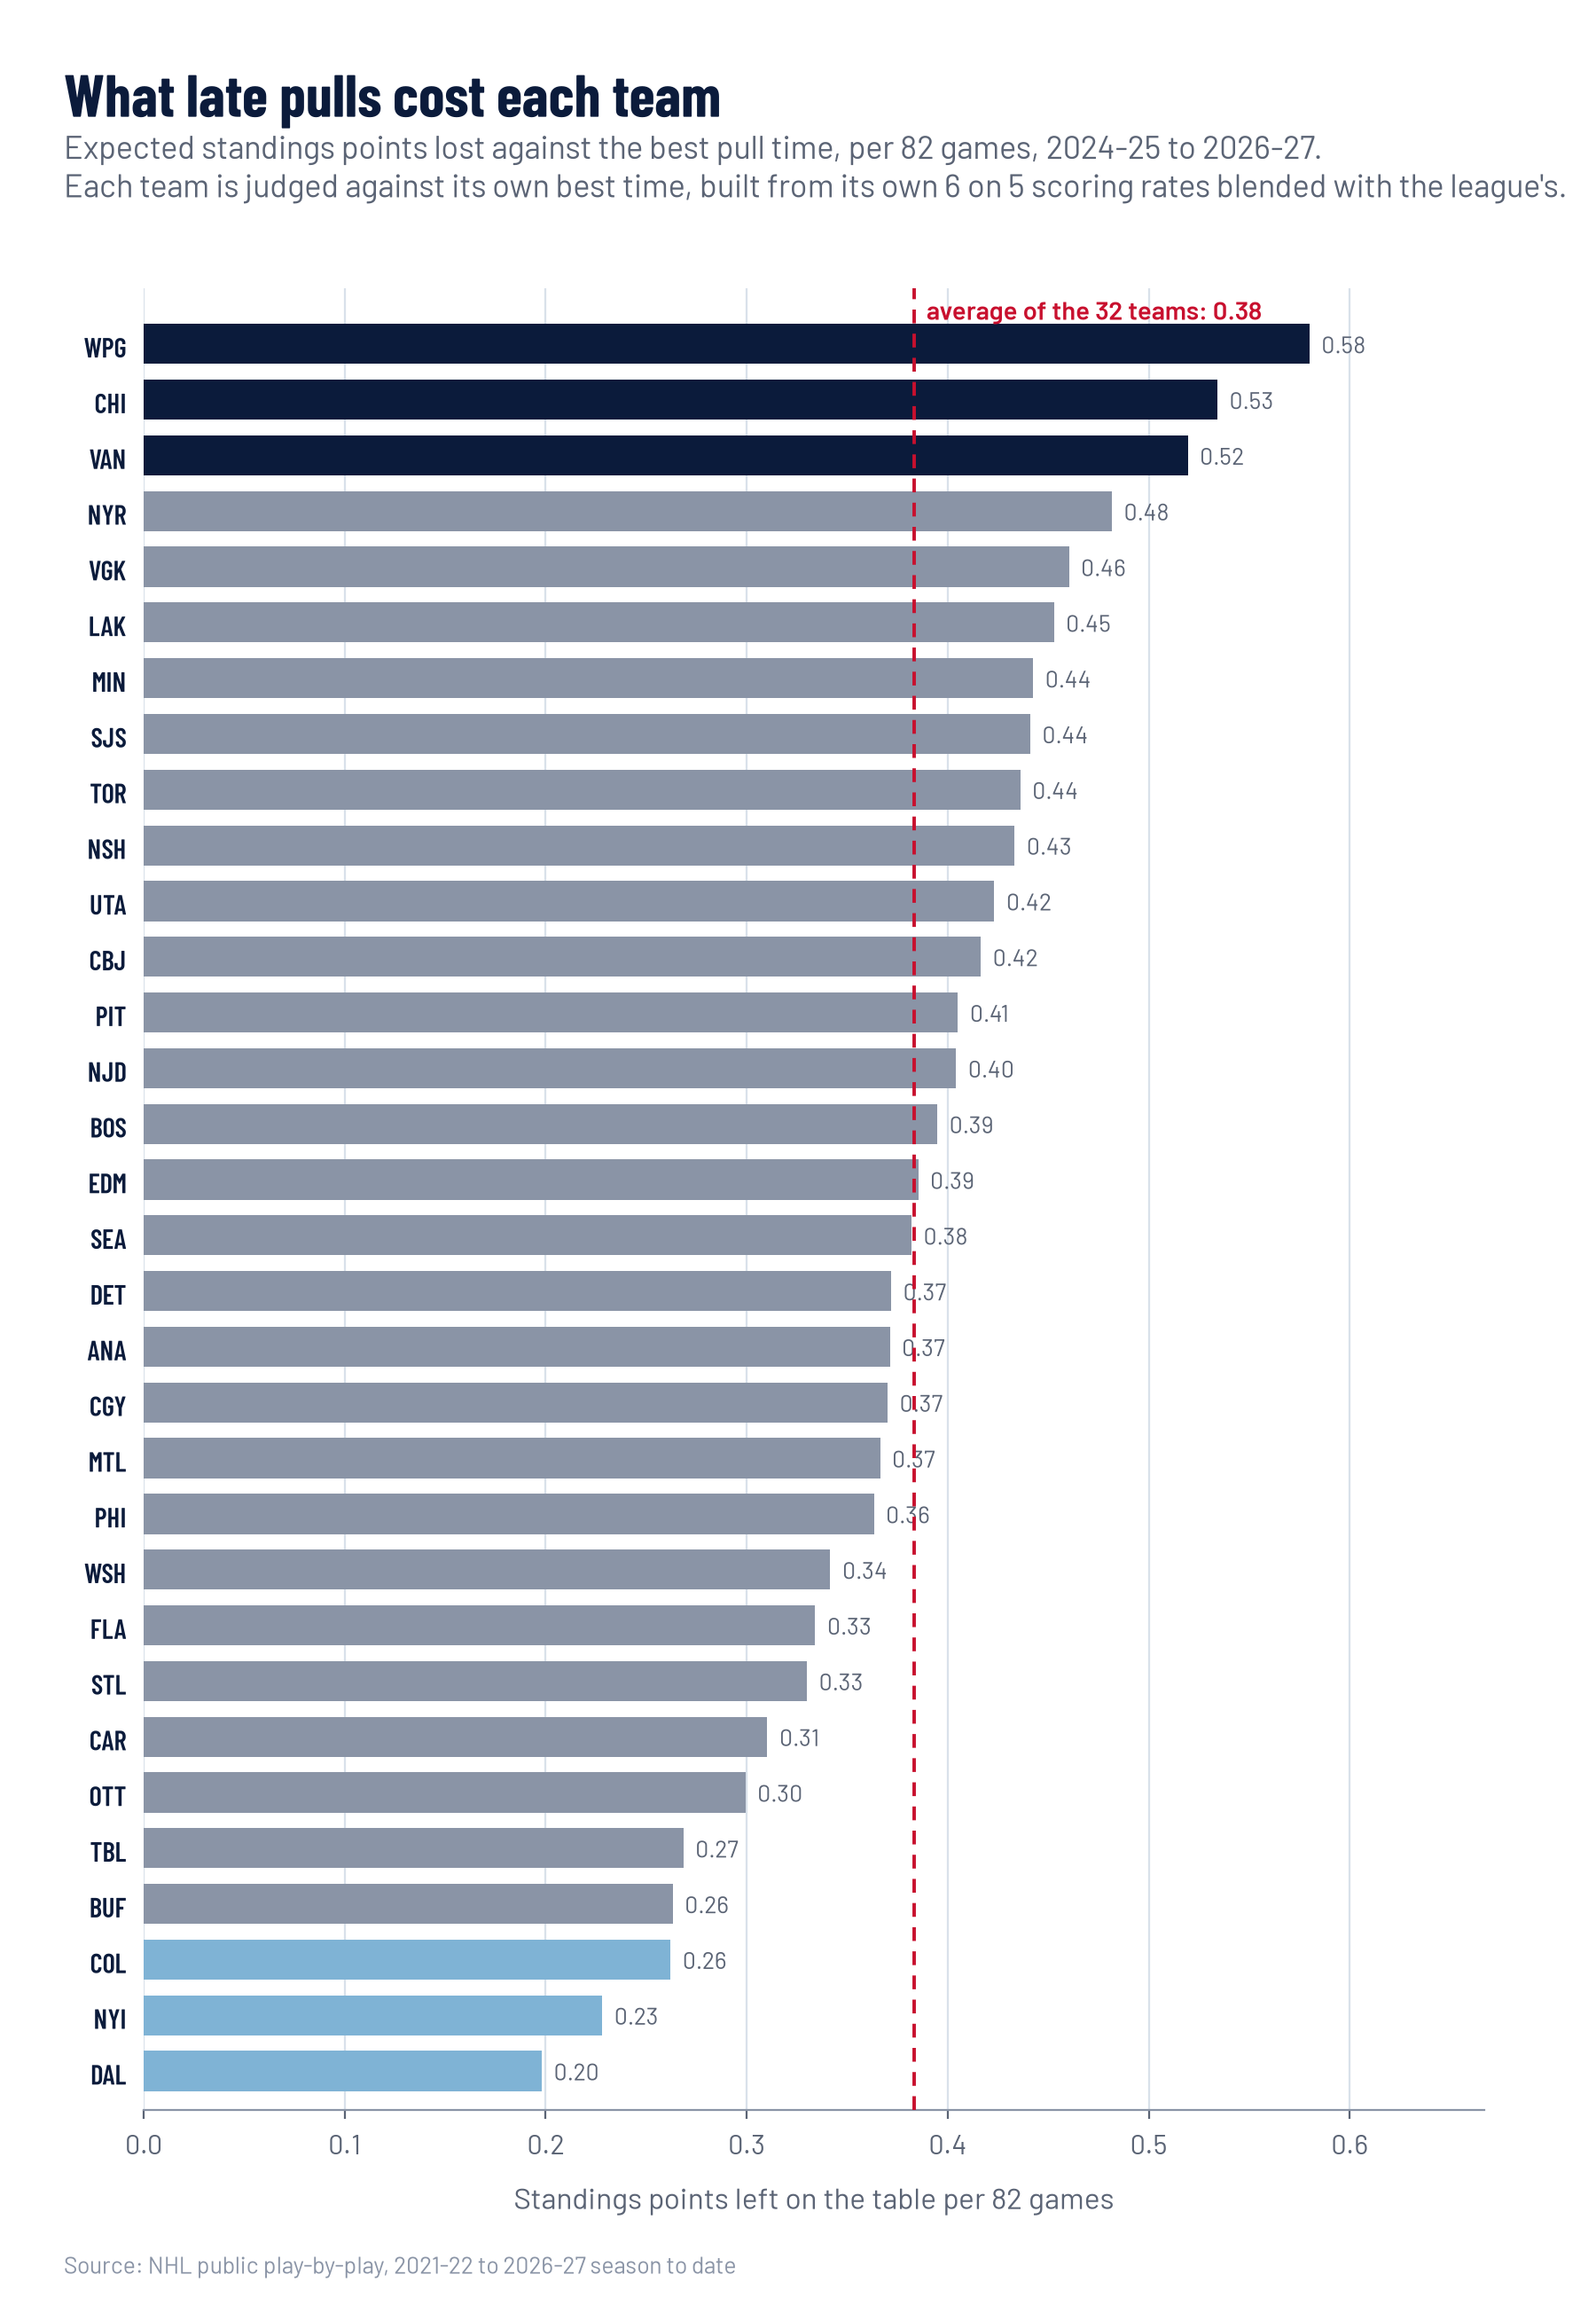
- Every team. A sortable table with each club's own best pull time, how they actually pull, their 6 on 5 scoring and allowing rates, and the points they lost per 82 games.
- Live and replay. A small server reads any live NHL game and gives the call for both benches. It can also rewind a finished game to any moment, and a stream overlay shows the model's call next to a viewer vote.
How I built it
- Pulled every regular season game from 2021-22 to October 28, 2026 (6,762 games) from the NHL's public play by play feed.
- Used each event's situation code, which records the skaters and goalies on the ice for both teams, to turn the game into time segments and find the exact moment the goalie left.
- Removed delayed penalty extra attacker stretches, which look like pulls in the data, leaving 4,242 real strategic pulls.
- Measured third period goal rates by score and goalie status. Pulling while down 1 lifts scoring from 2.47 to 6.90 goals per 60 minutes, while goals against jump from 2.10 to 20.30.
- Built a second by second Markov chain of the score and solved it backwards from the final horn. In the regular season it maximises standings points (a tie is worth a point plus an overtime coin flip); in the playoffs it maximises win chance.
- Drew 400 samples of every goal rate from its posterior and solved again each time to get the uncertainty range.
- Wrote the same model in plain JavaScript so the dashboard runs entirely in the browser with no server, and added a test that the Python and JavaScript versions agree.
Backtest
I fit every goal rate on 2021-22 to 2024-25 only, then scored 5,168 game states from 1,045 games in 2025-26 and 2026-27 where a team trailed late.
- Predicted 17.3% of those teams would get at least a point; 18.2% did, and each decile is close to the diagonal.
- The model with each team's real pull time beat a lookup table of past comeback rates (Brier 0.1385 against 0.1391, AUC 0.690 against 0.685) and beat the same model with everyone pulling at the league median. That means pull timing carries real signal, in the direction the model predicts.
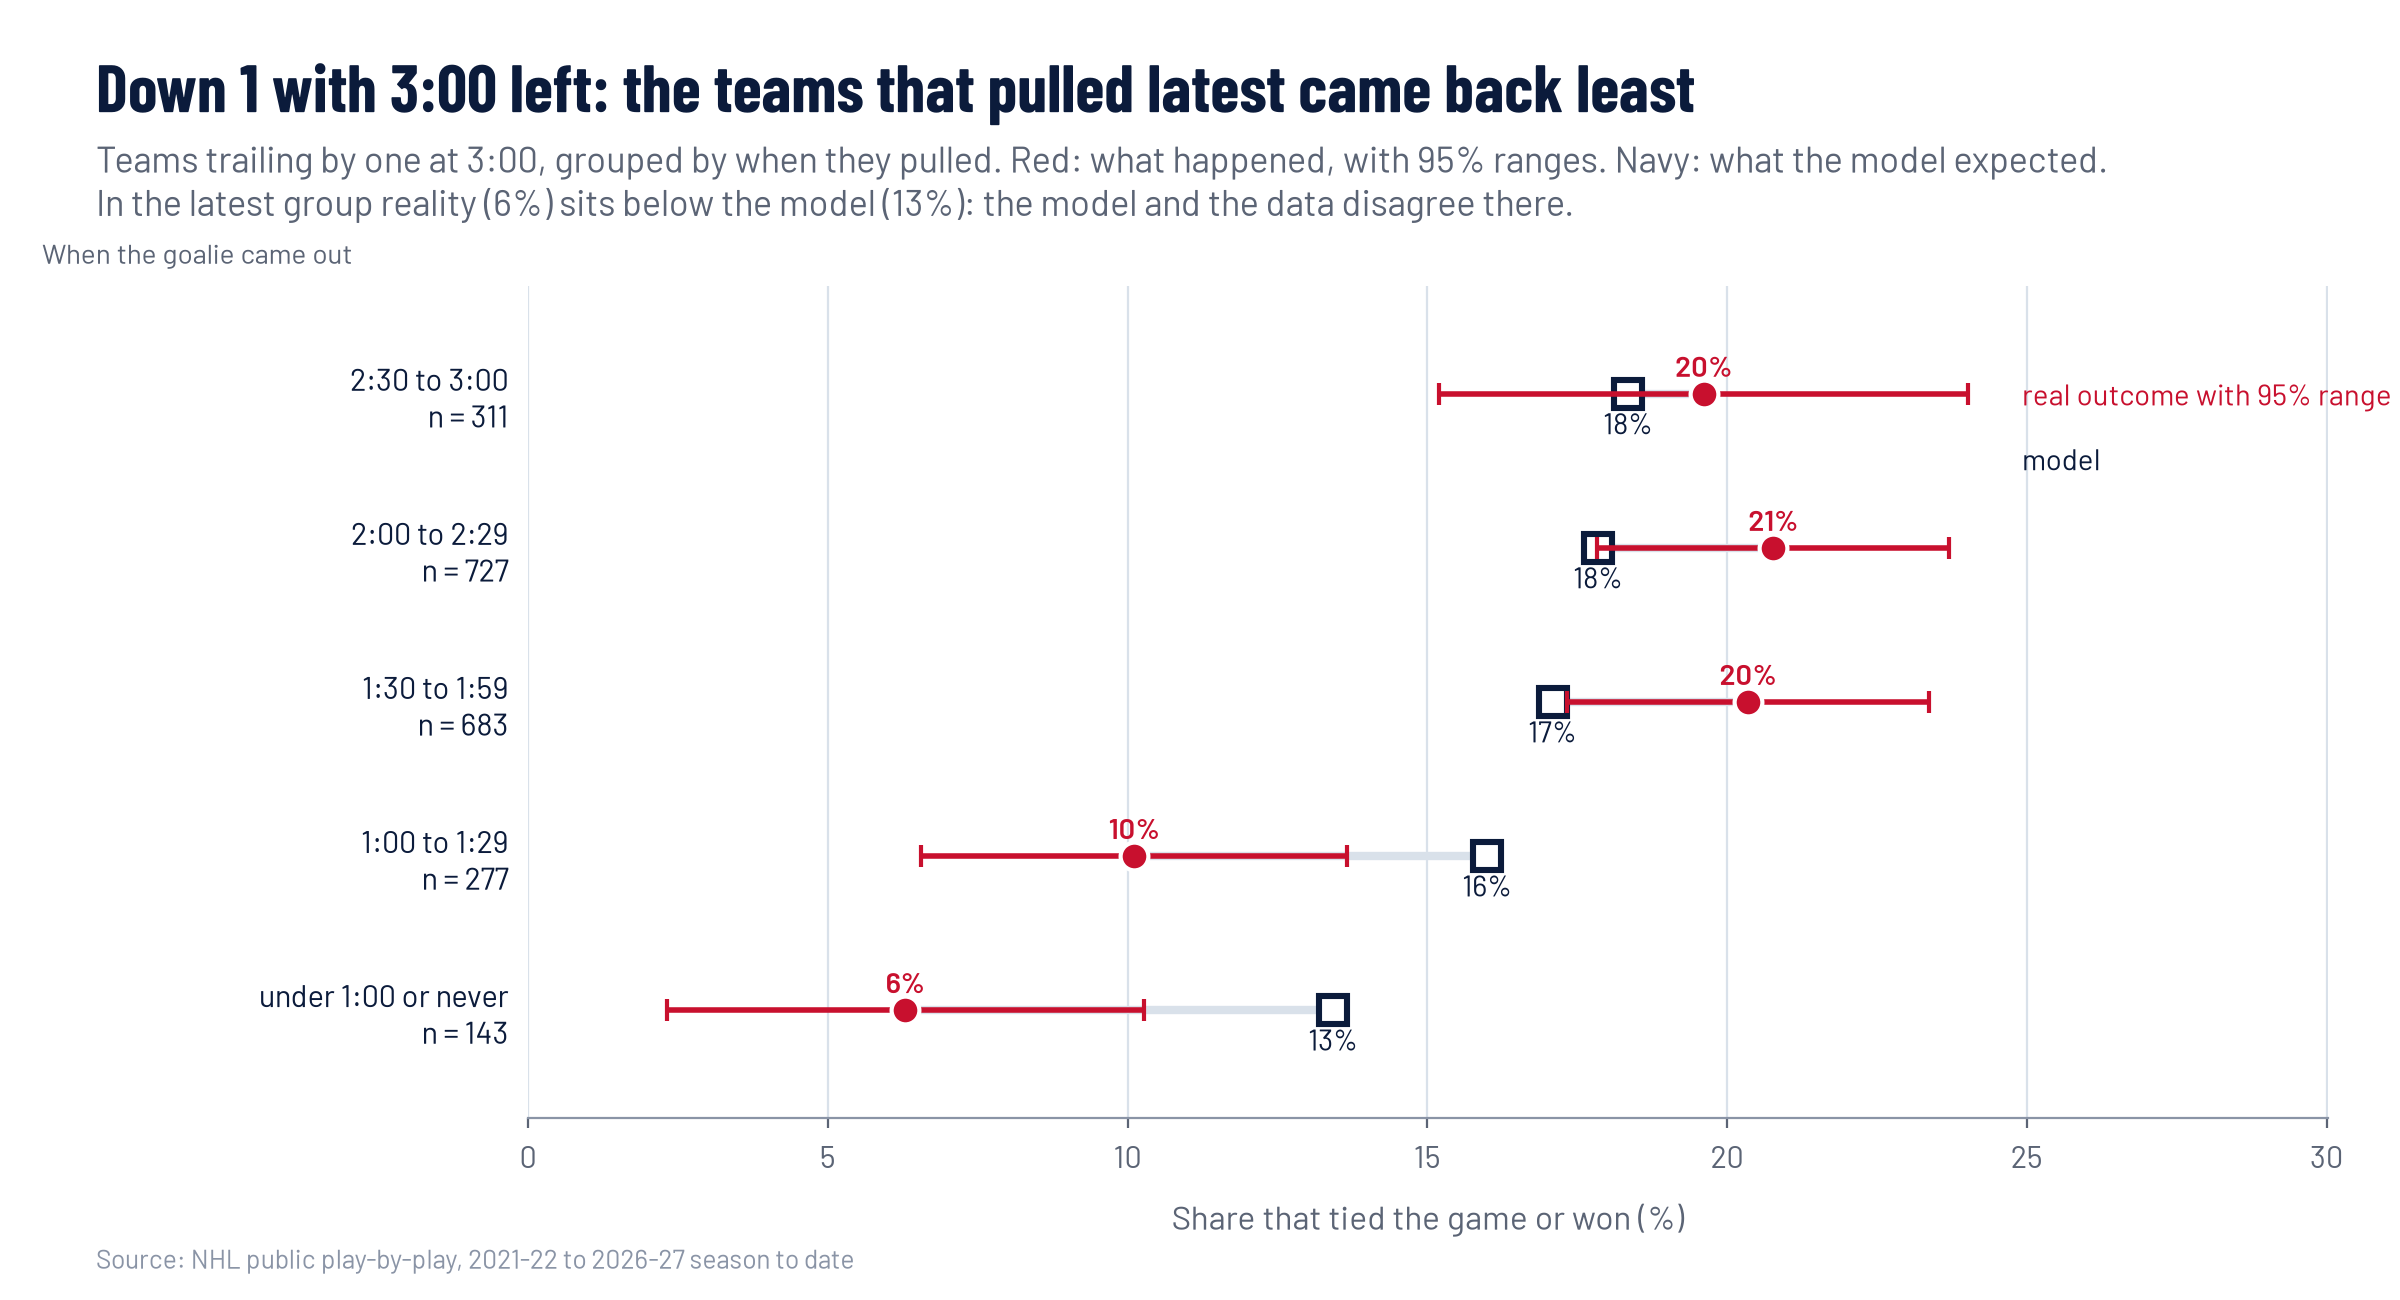
- In the raw data, teams down 1 with 3:00 left who waited until under 1:30 came back 6% to 10% of the time; teams that pulled with 1:30 or more left came back about 20% of the time.
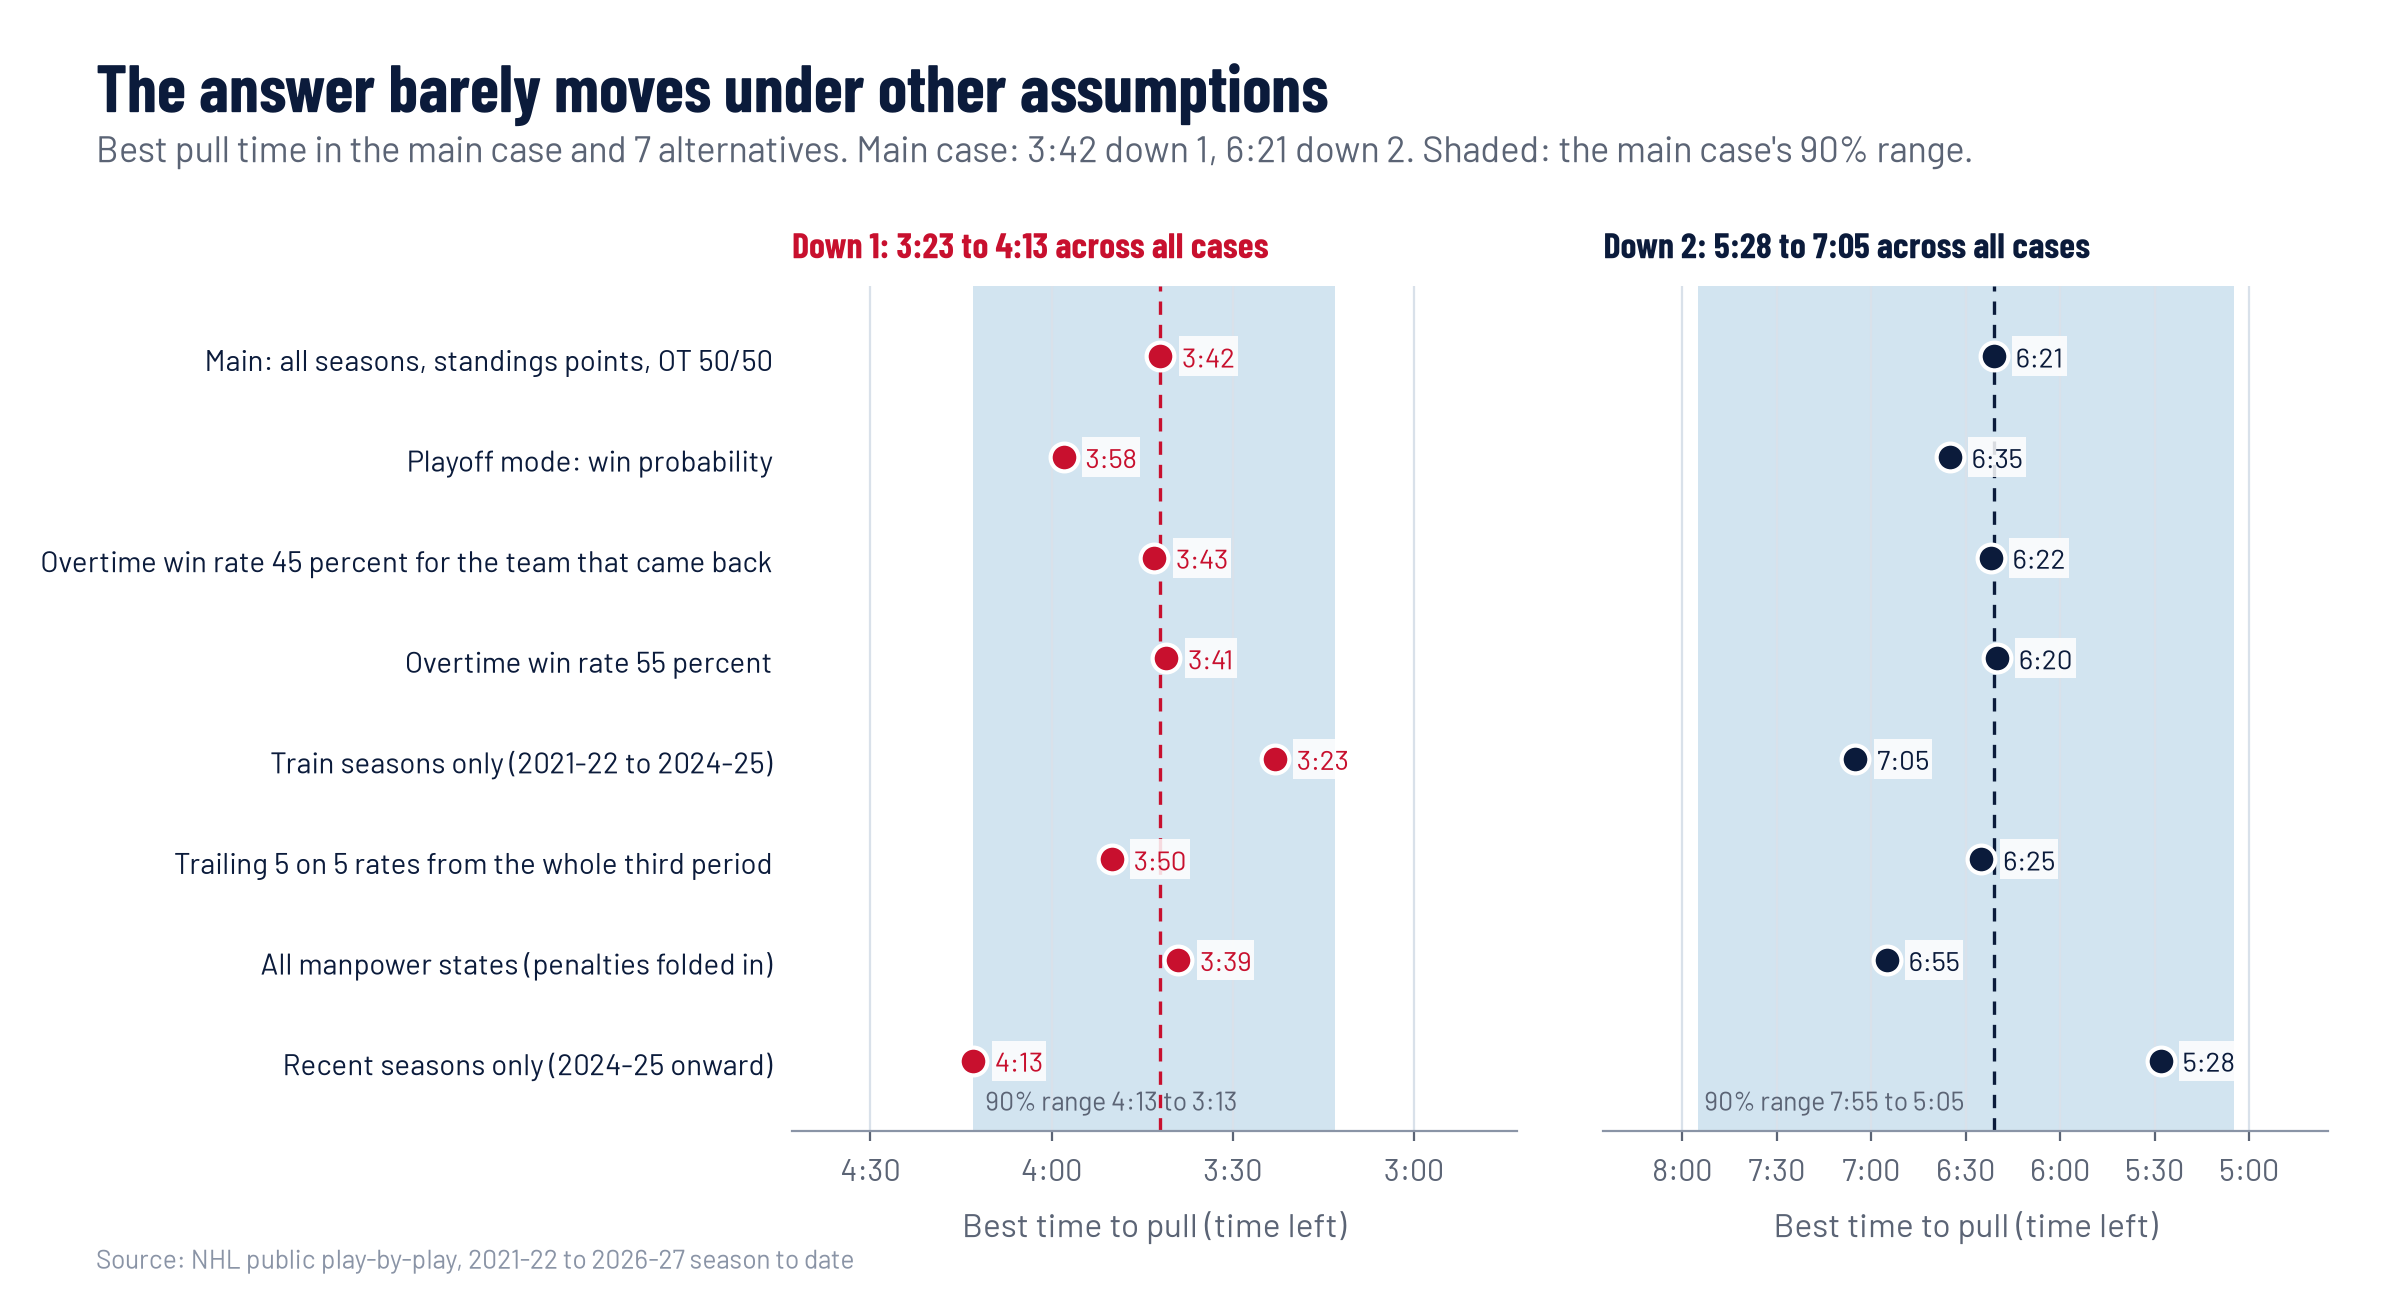
- The best time down 1 stays between 3:23 and 4:13 under every assumption I tested, including playoff scoring, different overtime odds, only recent seasons and penalties folded in.
Actionable impact
- For a coach: a pocket rule. Down 1, start looking for the pull at about 4:00 and have the goalie out by 3:40. Down 2, by about 6:20. In the playoffs, add about 15 seconds.
- For a front office: a cost in standings points for each team's habits, so the conversation is "this is worth up to half a point a year for free", not "analytics says so".
- For broadcasters and fans: a live call that can sit on screen in the last ten minutes of any game.
Challenges I ran into
- Delayed penalties look exactly like goalie pulls in the raw feed. A wrong filter would have made coaches look far more aggressive than they are.
- A goalie pull happens between events, so the exact second is not recorded. Splitting each gap at the midpoint kept the 6 on 5 exposure honest.
- My first model was a little too pessimistic on new games because it ignored late penalties, which trailing teams draw more often. Folding in every manpower state fixed the calibration.
Accomplishments that I'm proud of
- A clear, defensible answer with an uncertainty range, checked on games the model never saw.
- Everything is reproducible from a public feed with free tools, in about fifteen minutes.
What I learned
The case for pulling earlier is not that 6 on 5 is good. It is that a 2 goal loss and a 1 goal loss are worth the same zero points, so giving up an empty net goal costs almost nothing while scoring the tying goal is worth a point and a half.
Try it
- Live dashboard: https://alenzacodes.github.io/aqx-goalie/
- Code, data pipeline and tests: https://github.com/ALENZACODES/aqx-goalie
What's next
- Add faceoff zone and possession so the call can say "pull on this offensive zone draw".
- Opponent adjusted rates, and a power play version.
- A live stream version where chat votes "pull" or "wait" and the model shows the odds next to the crowd. The vote endpoints and overlay are already in the repo.
Built by John Khan, Toronto, Ontario.
Built With
- css
- github
- html
- javascript
- matplotlib
- nhl-api
- numpy
- pandas
- python
- scikit-learn


Log in or sign up for Devpost to join the conversation.