Inspiration
I wanted to build an application that had a real world application. As a professional I focus on verifiable deliverables. When I saw the Public Works dataset I felt that it would be great way to support all communities by helping the public servants dedicated to supporting everything in Champaign-Urbana.
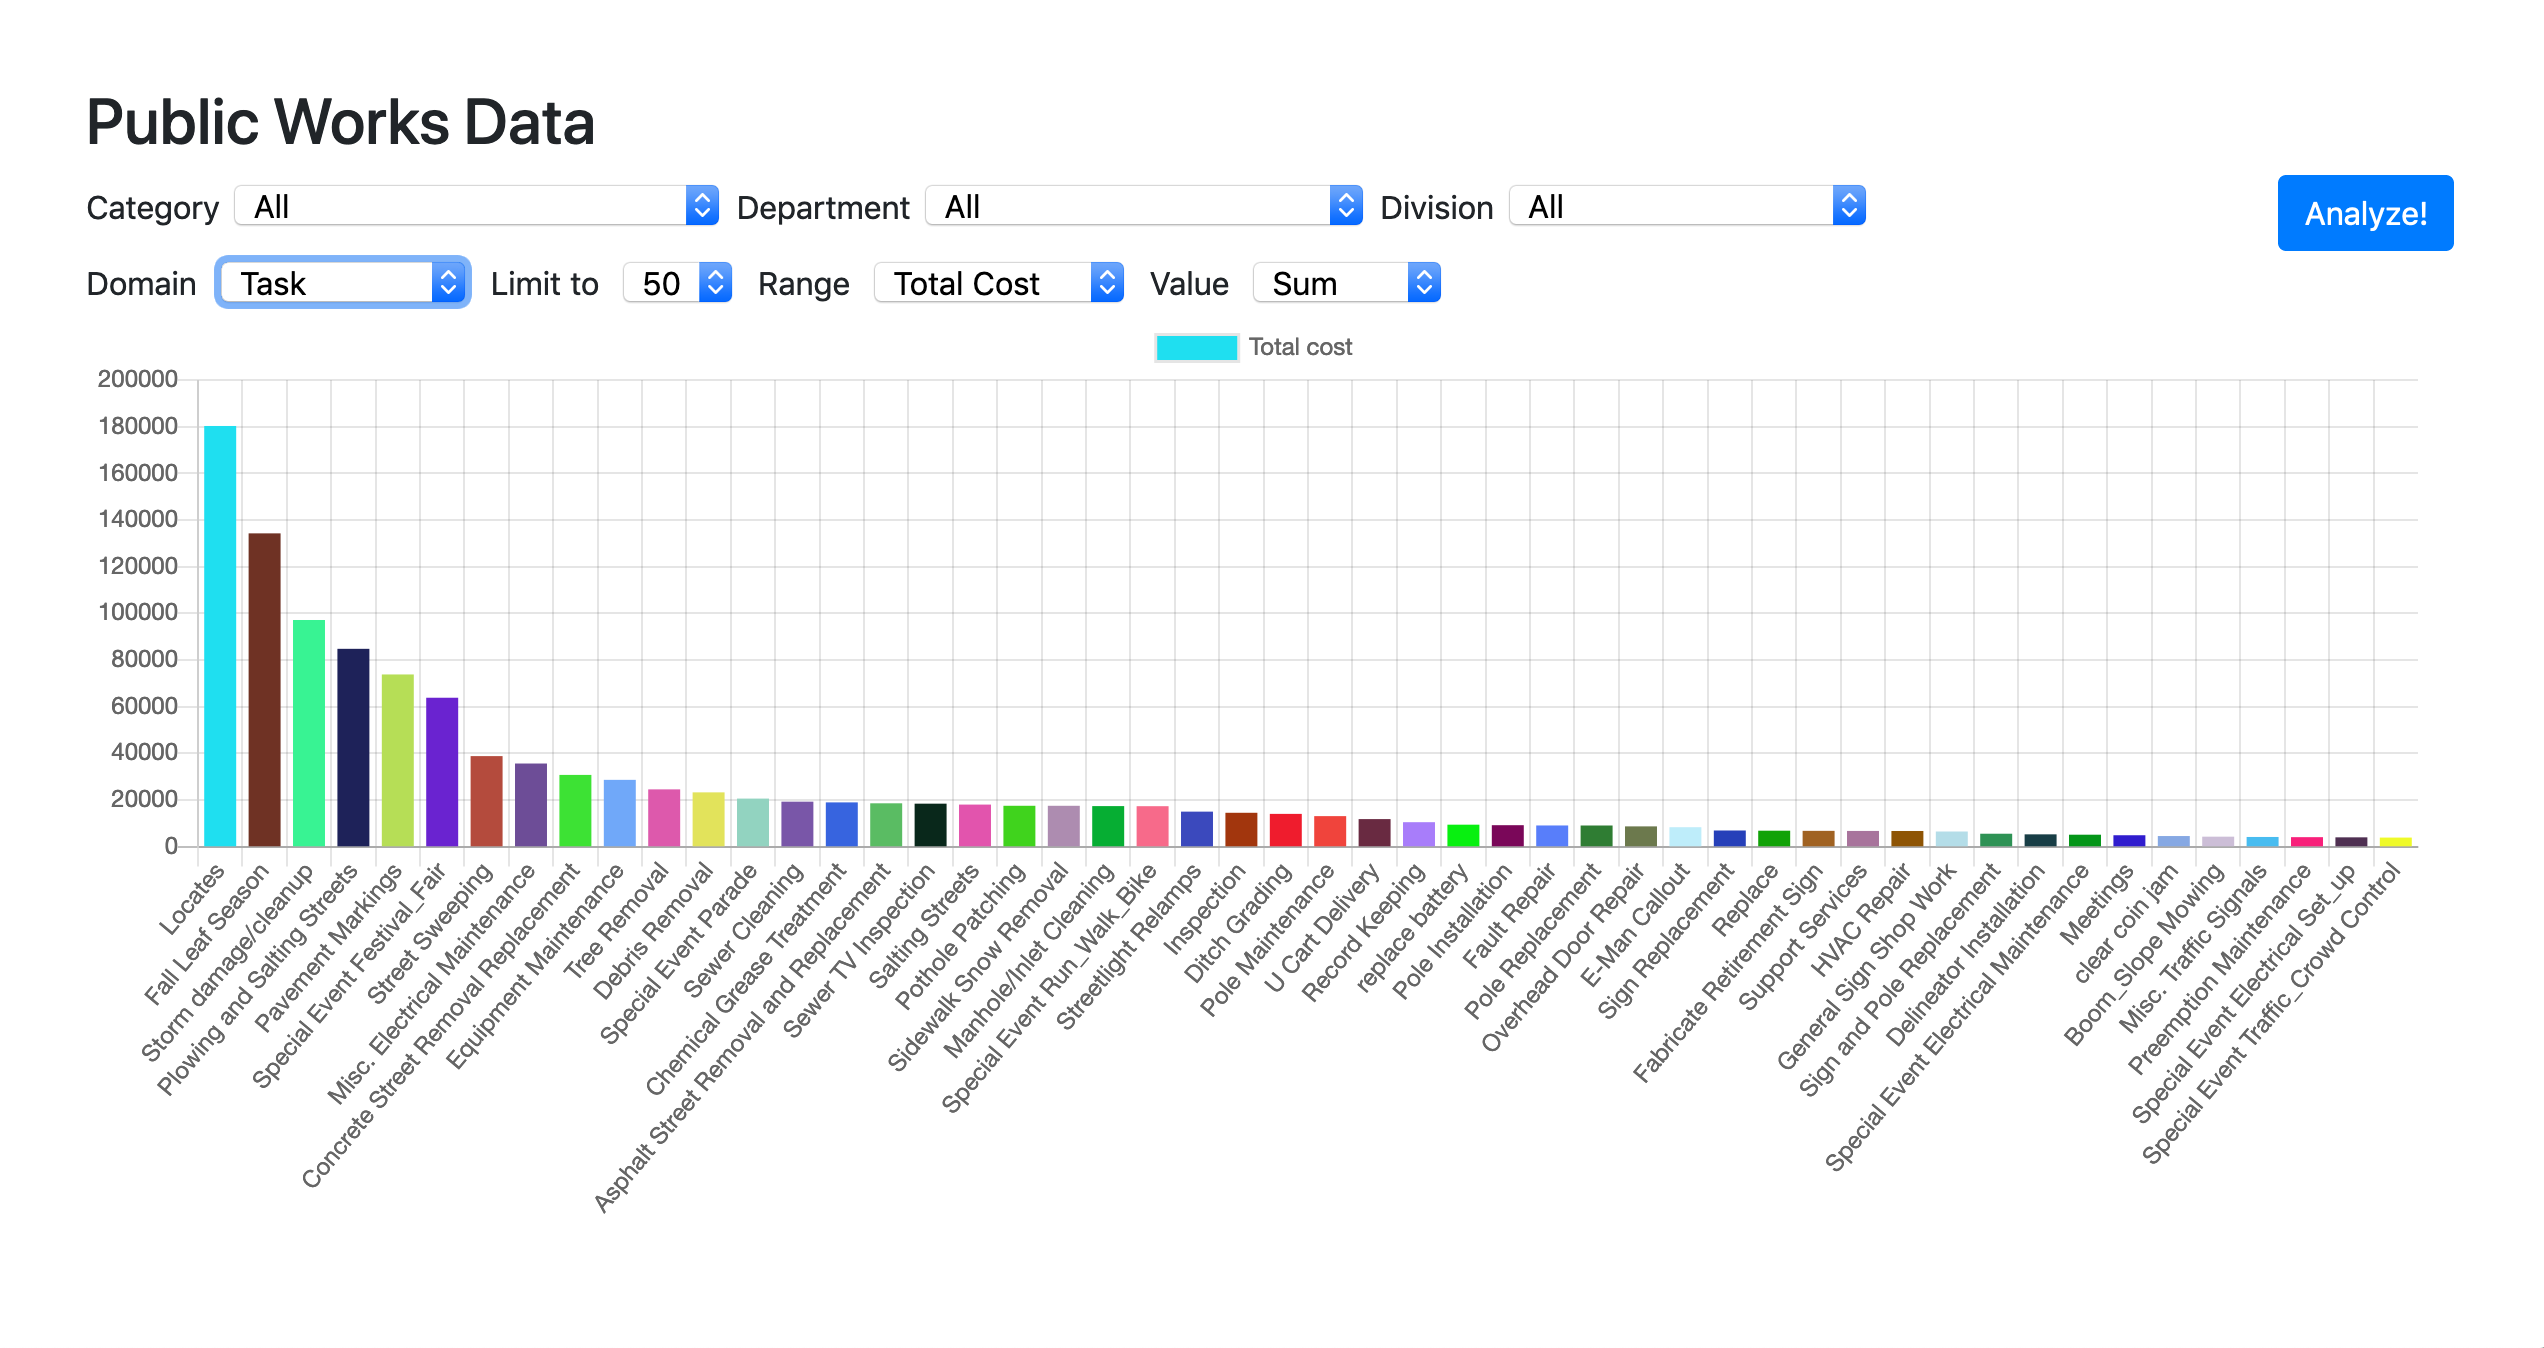
What it does
Provides a visual analysis of costs and work for all work orders from the past 18 months.
How I built it
I created a base design of models and general list of outcomes. I implemented the models, wired up the views and integrated the frontend to show the data.
Challenges I ran into
The data was a bit difficult to normalize and get into a relational database.
Accomplishments that I'm proud of
Pulling the various CSV files into a normalized, relational database and creating a visual representation of the data in ~8 hours.
What I learned
I realized that major projects each season account for most of the costs for Public Works. I also realized that some additional recruiting ahead of the project would have helped tremendously as it would have let someone work on the front-end while I implemented the backend.
What's next for Public Works
- Work with Public Works to correct Category/Department/Divison problems
- Determine how to assign a task to a time to show which months are most costly for which domains.
- Assign geolocations for addresses, facilities and locations to track which areas are most costly.
- Determine if this should be used to track crew productivity
An idea I had that goes beyond this project is if a citizen generated the request, it would be cool if the system automatically sent out text message or emails when the task was complete. This can be done with a hook in the system that when a work order is marked as complete, a message would be sent to the requestor.

Log in or sign up for Devpost to join the conversation.