-
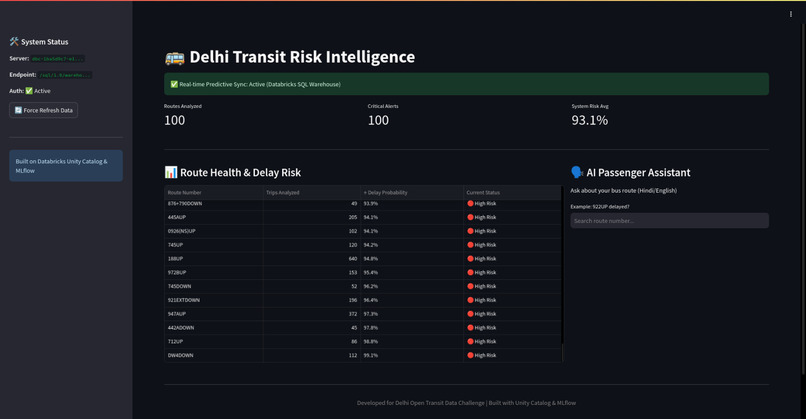
website landing page
🌟 Inspiration
Delhi’s bus network is the lifeline of the city, yet for millions, it remains a "black box." Commuters often face a guessing game of whether a bus is truly delayed or just caught in the void of missing data. We were inspired by the Delhi Open Transit Data (OTD) initiative to move beyond static schedules. We wanted to answer one simple question: Based on 3.7 million rows of history, what is the actual risk that your bus is late right now? 🚌 What it does
Public Transport Analyser (PTA) is an end-to-end predictive intelligence platform. It ingests massive GTFS datasets to:
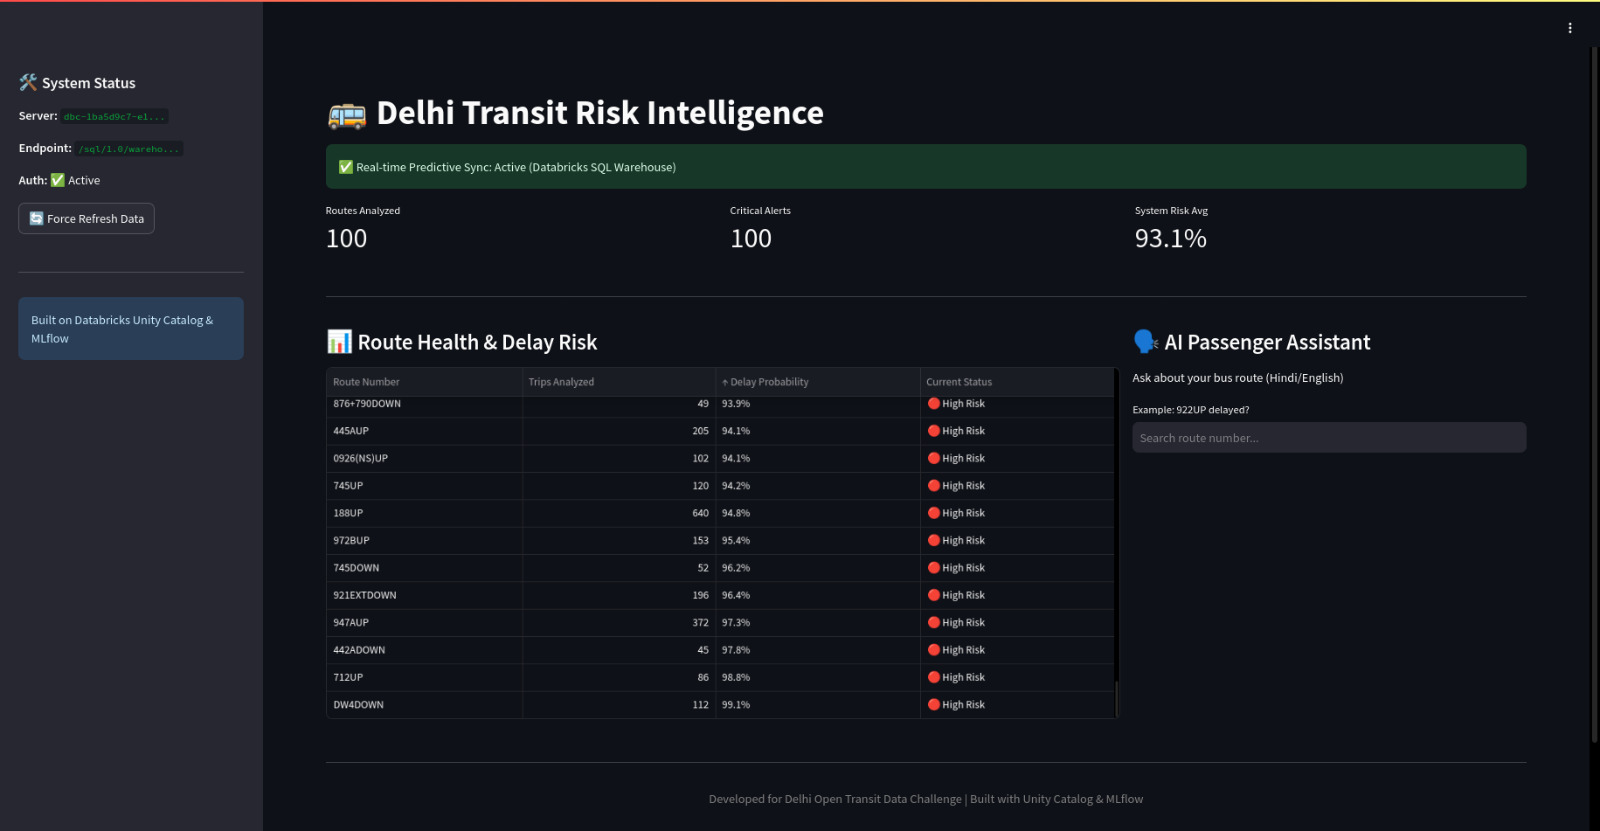
Predict Delay Risk: Uses a Gradient-Boosted Tree model to assign a "Health Status" to every route.

Empower Operators: Provides a high-level dashboard to identify "Red Zones" where the system is failing.

Assist Passengers: Features a bilingual (Hindi/English) AI Assistant that translates complex ML probability scores into simple, actionable advice for commuters.
🏗️ How we built it
We leveraged the full Databricks Data Intelligence Platform stack:
Data Engineering: A "Medallion Architecture" (Bronze/Silver/Gold) built on Delta Lake and Unity Catalog to process 3.7M+ records of Delhi transit data.

Machine Learning: A Spark MLlib GBT Classifier trained to identify delay patterns.

MLOps: Every experiment, hyperparameter, and version was tracked using MLflow, achieving a validated AUC of 0.82.

Frontend: A Streamlit application connected via JDBC/SQL Warehouse to ensure the UI remains fast and decoupled from heavy ETL compute.
🚧 Challenges we ran into
The "Final Boss" of this project wasn't the math—it was the infrastructure. We navigated:
The 1.0 AUC Trap: Our first model was too perfect. We discovered data leakage where the model was essentially "cheating" by looking at the labels. we fixed this by injecting probabilistic noise to create a more robust, realistic model.

The Unity Catalog Curveball: Learning the strict security requirements for UC Volumes and temporary storage while logging Spark models.

Connectivity Hurdles: Debugging JDBC strings and firewalls to ensure our frontend could talk to our data even when clusters were in a pending state.
🏆 Accomplishments that we're proud of
Scale: Successfully processing and modeling over 3.7 million records in a high-pressure hackathon environment.

Architecture Resilience: Building a "fail-safe" UI that serves cached predictive batches when live warehouses are scaling.

Bilingual Accessibility: Creating an AI assistant that speaks the language of the people it's meant to help.
📚 What we learned
Data Leakage is Sneaky: Just because your AUC is 1.0 doesn't mean you're a genius; it usually means you've got a bug!

Decoupling is Key: Separating the "Compute" (Spark) from the "Serving" (SQL Warehouse) is the only way to build a UI that doesn't make users wait 10 minutes for a cluster to start.

Resilience > Perfection: In a hackathon, a working fallback/cache is worth more than a "perfect" live connection that won't start.
🚀 What's next for Public Transport Analyser
Real-Time GPS Integration: Moving from static GTFS schedules to live vehicle positions (GTFS-Realtime).

Multi-Modal expansion: Including the Delhi Metro and Last-Mile Rickshaw patterns for a true "Whole City" view.

Edge Deployment: Optimizing the model for deployment on low-bandwidth mobile devices for passengers with limited data.

Log in or sign up for Devpost to join the conversation.