-
-

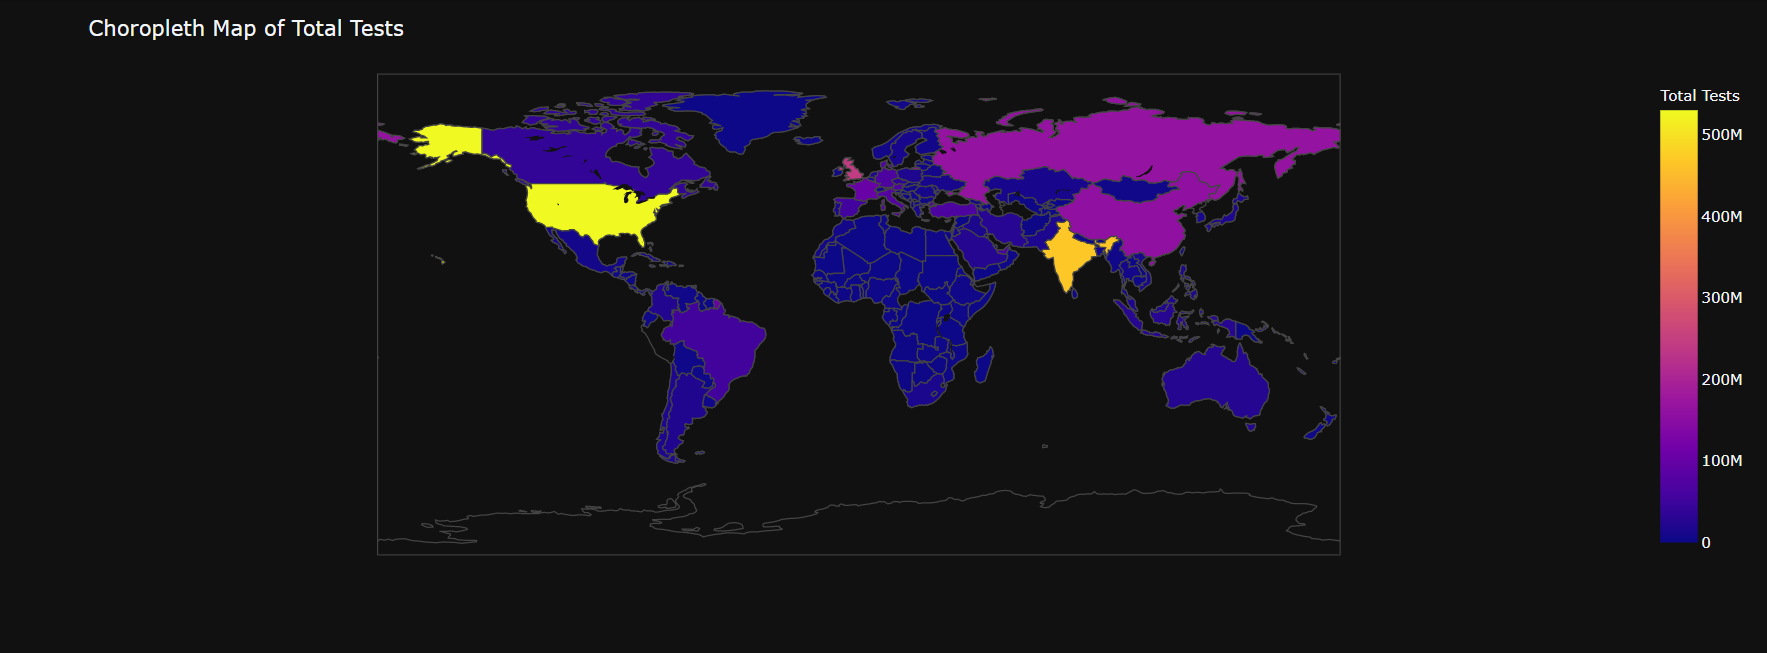
Choropleth-Total Tests
-
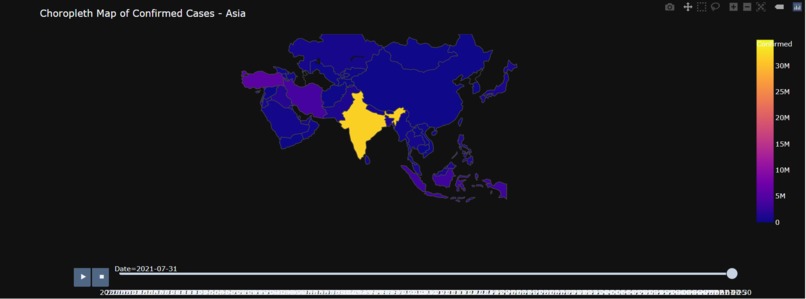
Choropleth-Asian Continent
-
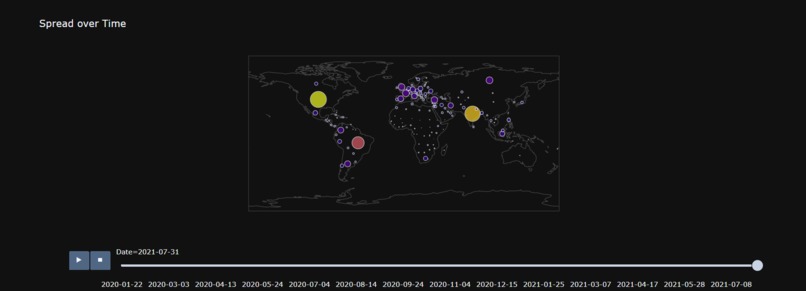
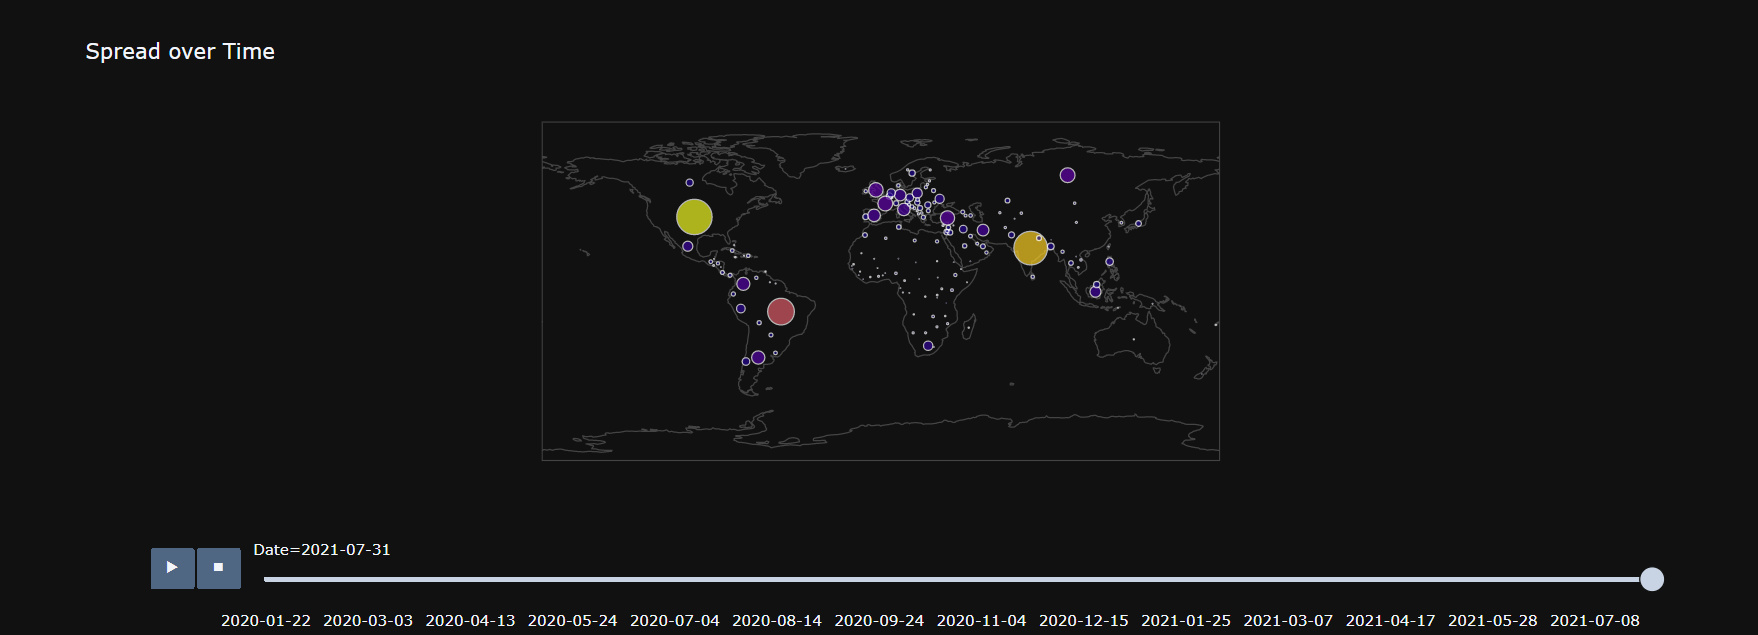
Spread Over Time

Our Motivation:
The current pandemic situation motivated us to develop visualizations to help the general public know more about the pandemic.
This project gives us complete visualizations to better understand the total cases, recovered cases, and death rate.
This project is built using our creativity with the various python libraries available.
Data preprocessing being one of the major challenges that we faced, but we tackled it efficiently.
We also gave our best despite the different challenges that we faced.
In this challenge, we also gained experience working on different plotting libraries and learned to develop beautiful visualizations to better understand data.
In the future, we aim to develop a solution so that the public tracker can generate great visualizations for any pandemic-like situation in the future.
Built With
- colab
- python

Log in or sign up for Devpost to join the conversation.