-
-
proof of drought
Track: Climate Data & Environmental Monitoring. Environmental data is fragmented and hard to verify, and in insurance that costs lives: if nobody trusts the data, nobody gets paid on time. Proof of Drought turns three independent rainfall records into a decision anyone can check, and a payment nobody can withhold.
Inspiration In September 1997, the rain stopped in western Fiji and didn't properly come back for eleven months. By the end, 90% of people in the worst-hit west were on food and water rations, the sugar industry expected to lose F$104 million, and cane-farming families saw their income fall from about F$5,000 to below F$1,500 a year. Fiji's Cabinet declared a natural disaster on 22 September 1998, a year after the drought began (UN OCHA, Fiji Drought Situation Report No. 2). Parametric insurance, which pays on a measured trigger instead of an assessed claim, already exists in the Pacific. Its weak points are trust in the trigger data and payments that arrive after the damage is done. I wanted to see whether public climate data and a smart contract could fix both. Then, while I was building it, NOAA forecast a strong to very strong El Niño for 2026–27, with the Pacific already warmer than at the same point in 1997.
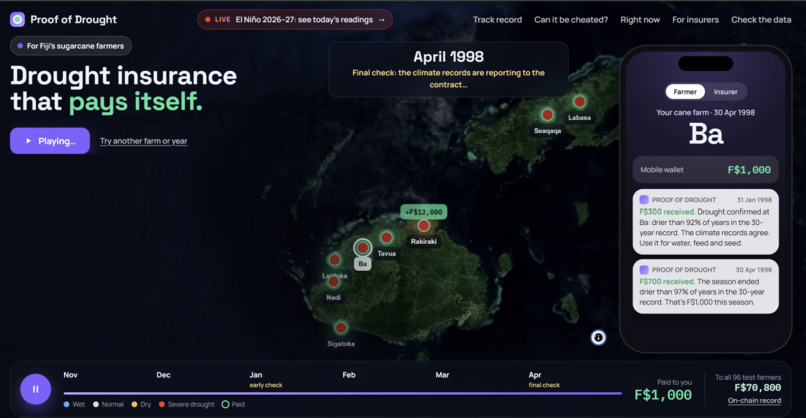
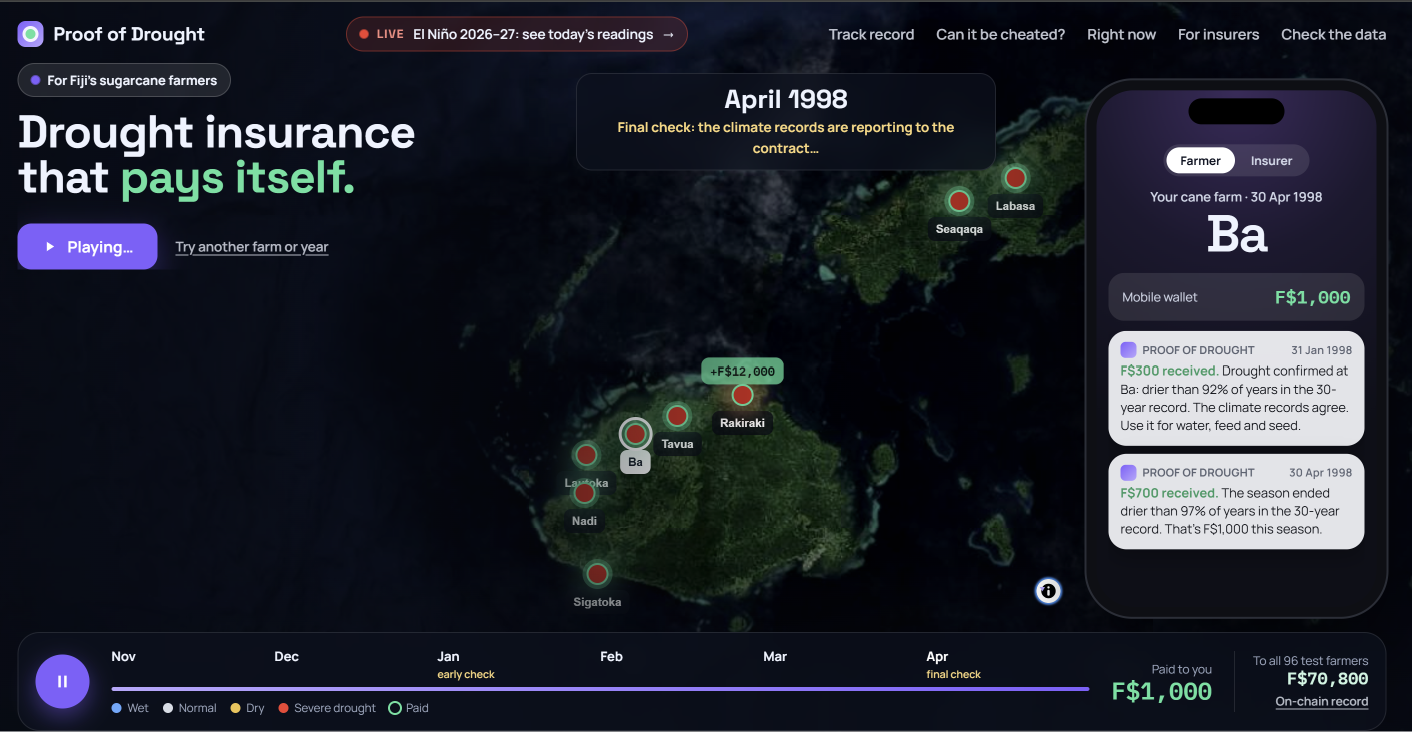
What it does Three independent records watch the rain in Fiji's eight cane districts, daily since 1981: Copernicus ERA5 (Europe) and NASA MERRA-2 (USA), weather models fed with satellite, station and balloon observations, plus CHIRPS, satellite rainfall checked against rain gauges. A drought index anyone can recompute. For record $s$, this season's rainfall $R_s$ and soil moisture $M_s$ are ranked against the same months in 1991–2020: $$D_s = \tfrac{1}{2}\big(P(R_s) + P(M_s)\big), \qquad P(x) = \frac{#{\text{baseline seasons} \le x}}{30}$$ Two of three must agree. When $|D_{\text{ERA5}} - D_{\text{NASA}}| \le 0.25$, the index is $I = \tfrac{1}{2}(D_{\text{ERA5}} + D_{\text{NASA}})$ and CHIRPS is logged as a witness. Otherwise CHIRPS breaks the tie. A faked or broken record gets outvoted. The contract pays. End of January: $I \le 0.10$ pays 30% of cover, in time to save stock and replant. End of April: $I \le 0.10$ pays the rest of 100%, $I \le 0.20$ pays 50%. Every farmer in the district is paid in one transaction. An AI data guard (anomaly detection trained on 30 years of real Fiji weather) checks every reading. Its verdict goes on-chain, and a flagged payout is held until the satellite record is in. Every reading is sealed with a SHA-256 fingerprint of its raw daily data. The website re-downloads the data from Copernicus, NASA and CHIRPS live and checks it against the seal. A live tracker for 2026–27 shows today's readings for every district, ranked exactly as the contract will rank them. A forecast and a fair price. A logistic model on the August–September Niño-3.4 temperature, $p = \sigma(\beta_0 + \beta_1 \min(N, N_{\max}))$, gives a 60% chance a district pays this season, against 17% in a normal year. The same model sets the premium, and a sponsor pool lets a government or donor pay the extra in risky years, with every sponsor dollar traced on-chain to the district it protected.
Results I ran the rules over 45 real seasons (1982–2026) and compared them with Fiji's actual cane harvests (FAOSTAT):
El Niño drought years that cut the harvest (1983, 1987, 1992, 1998, 2010) all paid Cyclone and flood years (1985, 2012) paid nothing, as intended 1998 paid January, eight months before the disaster declaration Average payout 10.5% of cover per year, the fair price before costs CHIRPS agreed with the decision 86% of checkpoints AI guard on real data flagged 1.1%, never delayed a real payout At Fiji's scale (about 10,200 cane growers, F$1,000 of cover each), 1998 would have paid F$2.7 million in January and F$10.2 million by April. Priced by the forecast, the pool needs F$15.1 million set aside at the start and stays solvent over all 44 seasons.
How I built it Data pipeline (Node.js): daily data from the Open-Meteo archive (ERA5), NASA POWER, ClimateSERV (CHIRPS) and NOAA, with yields from FAOSTAT. AI: a Mahalanobis-distance anomaly detector on three features that real weather keeps consistent (rain vs soil moisture, a district vs its neighbours, and a daily water-balance model), plus the logistic El Niño forecast, tested by leaving one season out at a time. Smart contract: Solidity 0.8.37, with 28 automated tests, including one that runs 40 random seasons through the contract and checks it decides exactly like the backtest. Website: Vite and MapLibre on a Sentinel-2 satellite map. The contract also runs on a real Ethereum virtual machine inside the browser (EthereumJS), so visitors can replay any season, or try to fake a drought, without a wallet. Automation: GitHub Actions for the scheduled oracles, with a key check that posts nothing.
Challenges Getting the science right. My first headline said "satellites check the rain", but ERA5 and MERRA-2 are reanalyses, not satellite measurements. I added CHIRPS as a real satellite record. It measures rain only, so it reads drier in dry years, and mixing it straight into the index raised the average payout from 10.4% to about 14%. Using it as a tie-breaker and witness instead kept the backtest almost unchanged and made the system harder to fake. The archive changed under me. Open-Meteo revised some ERA5 values by 0.1 mm between two days, and every seal stopped matching. I re-downloaded the data, and now the check explains a revision (how much changed, and whether the decision would change) instead of just saying "mismatch". Bugs in money handling. Reviews found that sponsor money, and money owed to a farmer whose wallet refused a payment, sat in the shared pool where another district's payout could spend it. I fixed both and redeployed before the season. Version 3 is live, and versions 1 and 2 stay on the record with the reason they were replaced. Making it understandable. The first version had sixteen big numbers on the screen. I cut it down to two: "8 months earlier" and "60%".
What I learned How parametric insurance works and where it fails: basis risk, and people buying cover only when they can see a drought coming. With one flat price, those buyers would have been paid F$3.13 for every F$1 of premium, so the price has to follow the forecast. I also learned that a blockchain is most useful here for something simple: a public, timestamped record that I can't edit after the fact.
Limits I haven't solved Fiji publishes cane yields only for the whole country, so district payouts can't be checked against district harvests. Nobody in Fiji has reviewed this yet: not farmers, the Sugar Cane Growers Fund, the Fiji Meteorological Service or an insurer. I run all three oracles, with test money. A real scheme needs independent operators. Paying out to M-PAiSA or MyCash mobile money is a proposal; it needs a licensed partner and Reserve Bank of Fiji approval. If Copernicus and NASA disagree, the payout waits about three weeks for CHIRPS.
Code: https://github.com/tiasella1802-alt/Proof-of-Drought Contract (verified): https://sepolia.etherscan.io/address/0x99f3f126366dc90718bC4b1a697130dEA25F90cf
Built With
- blockchain
- chirps
- copernicus-era5
- css3
- data
- ethereum
- ethereumjs
- ethers.js
- etherscan
- hardhat
- html5
- javascript
- maplibre
- maps
- nasa-power
- node.js
- sentinel-2
- sepolia
- solc
- solidity
- sources
- sourcify
- vite