Inspiration
Everyone has an opinion about which technologies will meet next, but those predictions are rarely checked, and many turn out to be a measure of size: big fields combine with big fields. We wanted a forecaster that shows its evidence and is graded against what actually happened.
What it does
Prometheus turns 9.45 million US patents (1976–2025) into a graph of 123 technology fields. Two fields are linked when patents carry both, and every link stores the year it first appeared, so "the graph as of any year" is just a Cypher filter.
From that graph it ranks the pairs of fields most likely to combine next, explains each pick (the fields both already share, and what both build on), and checks the ranking against the following ten years.
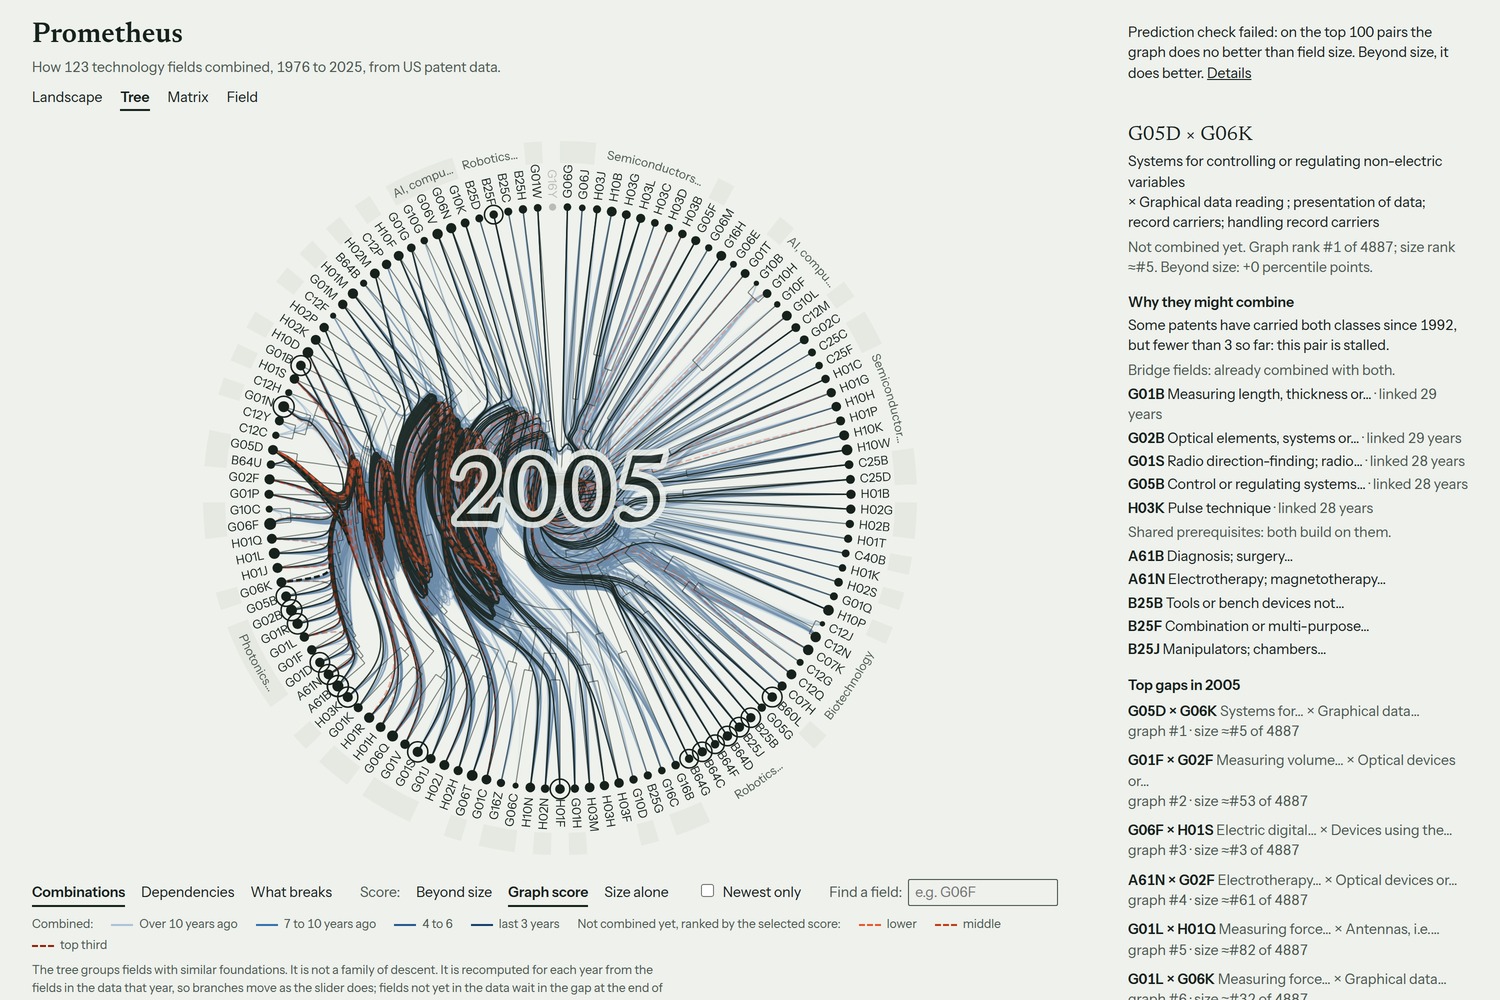
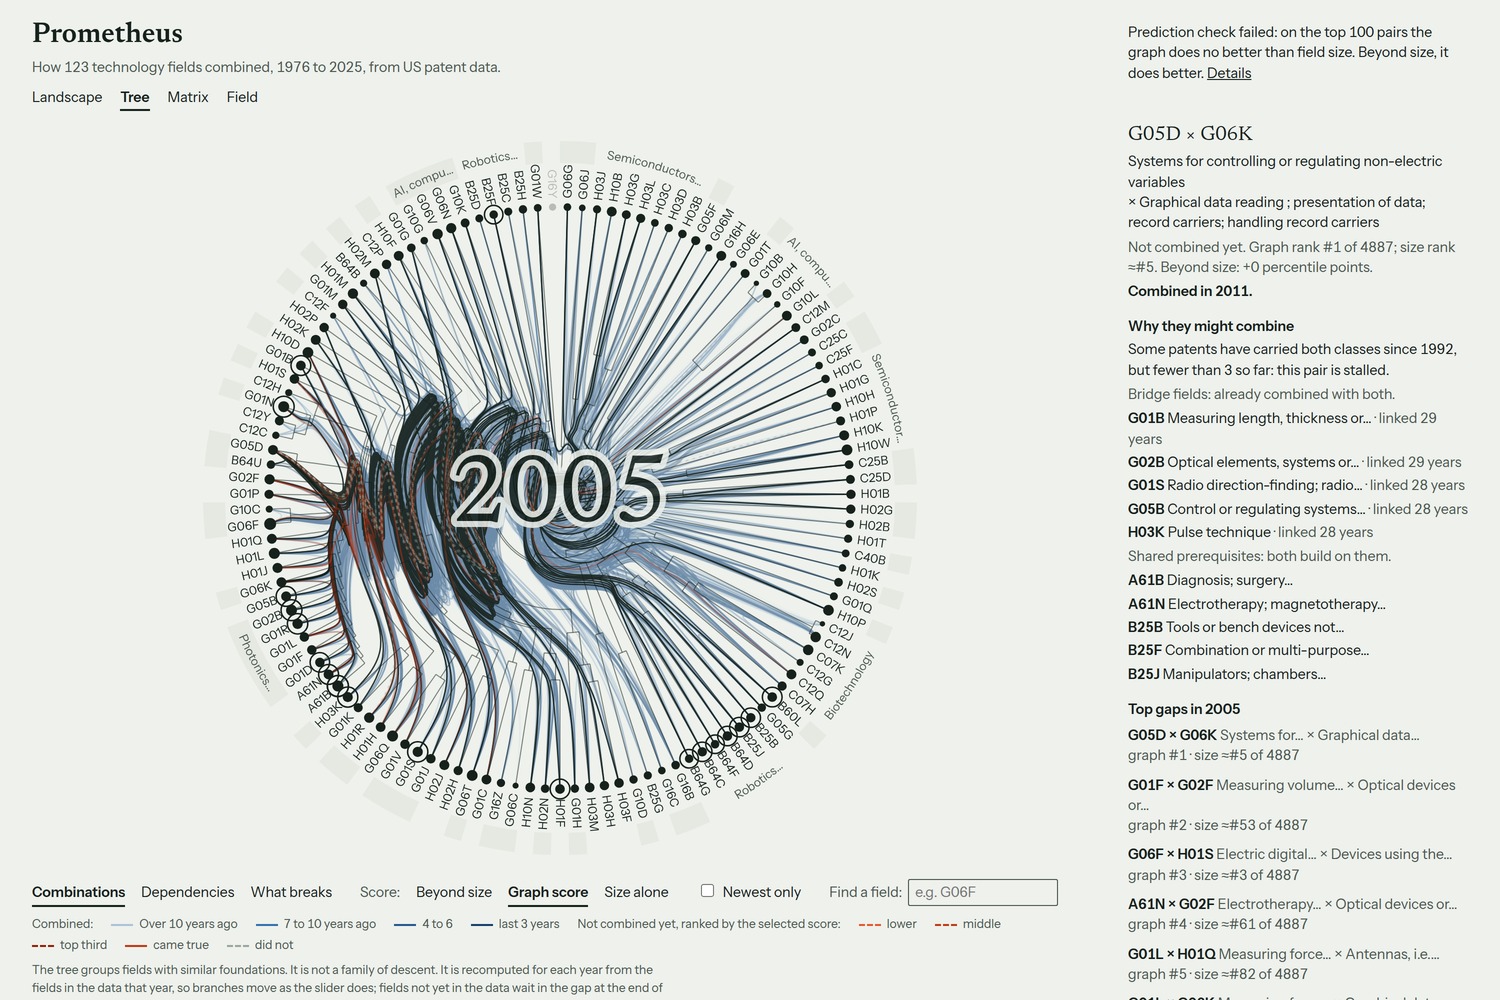
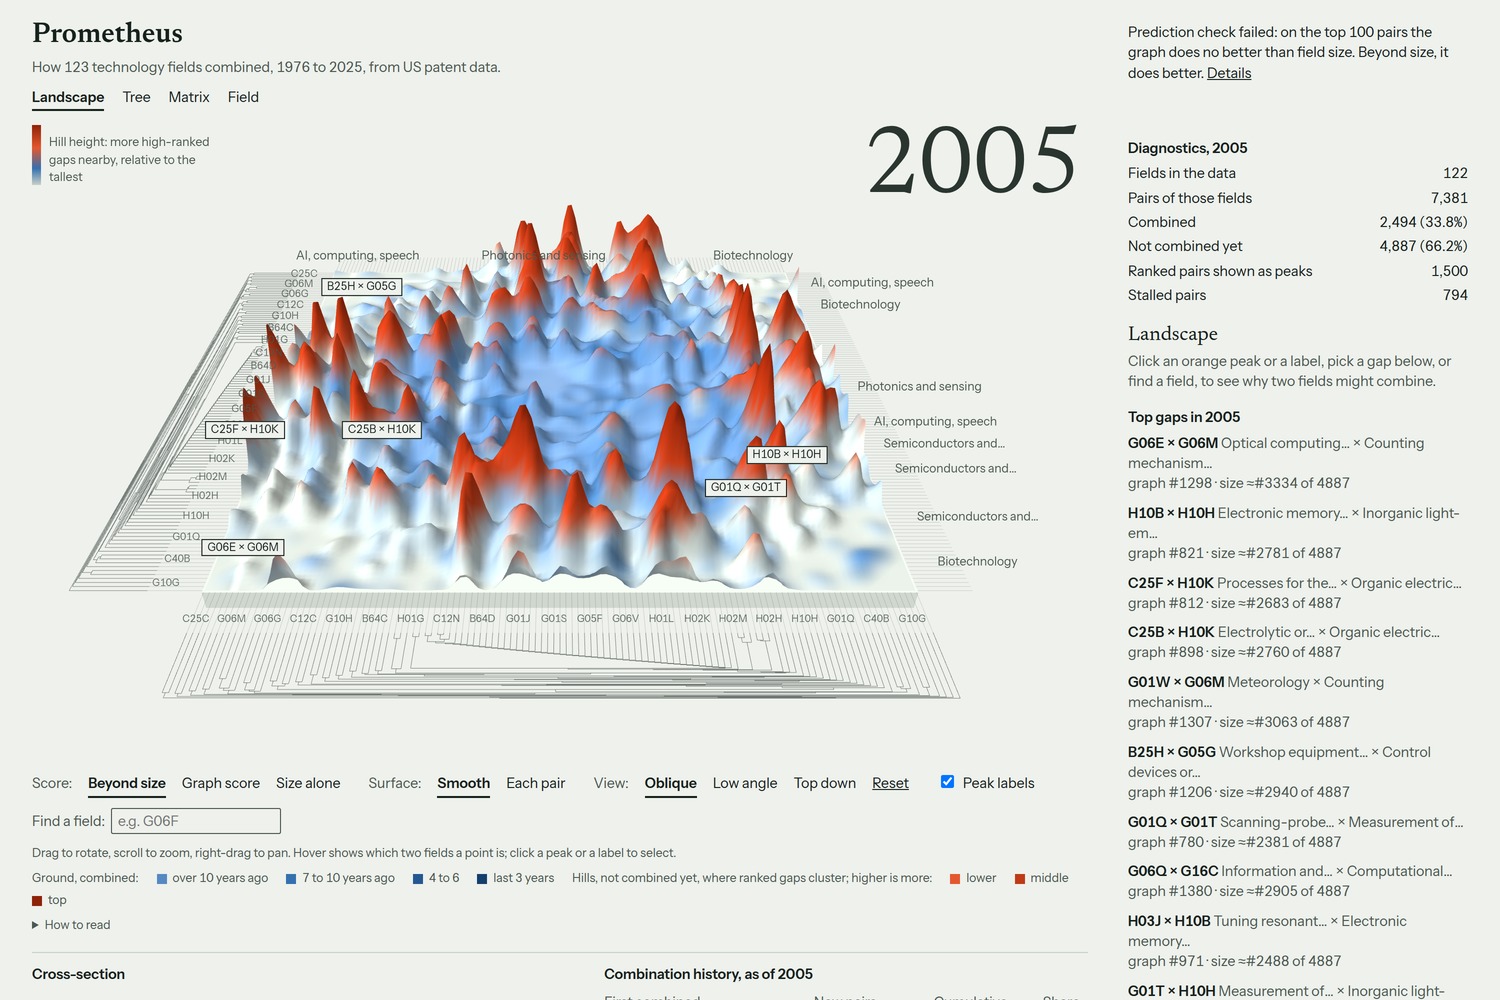
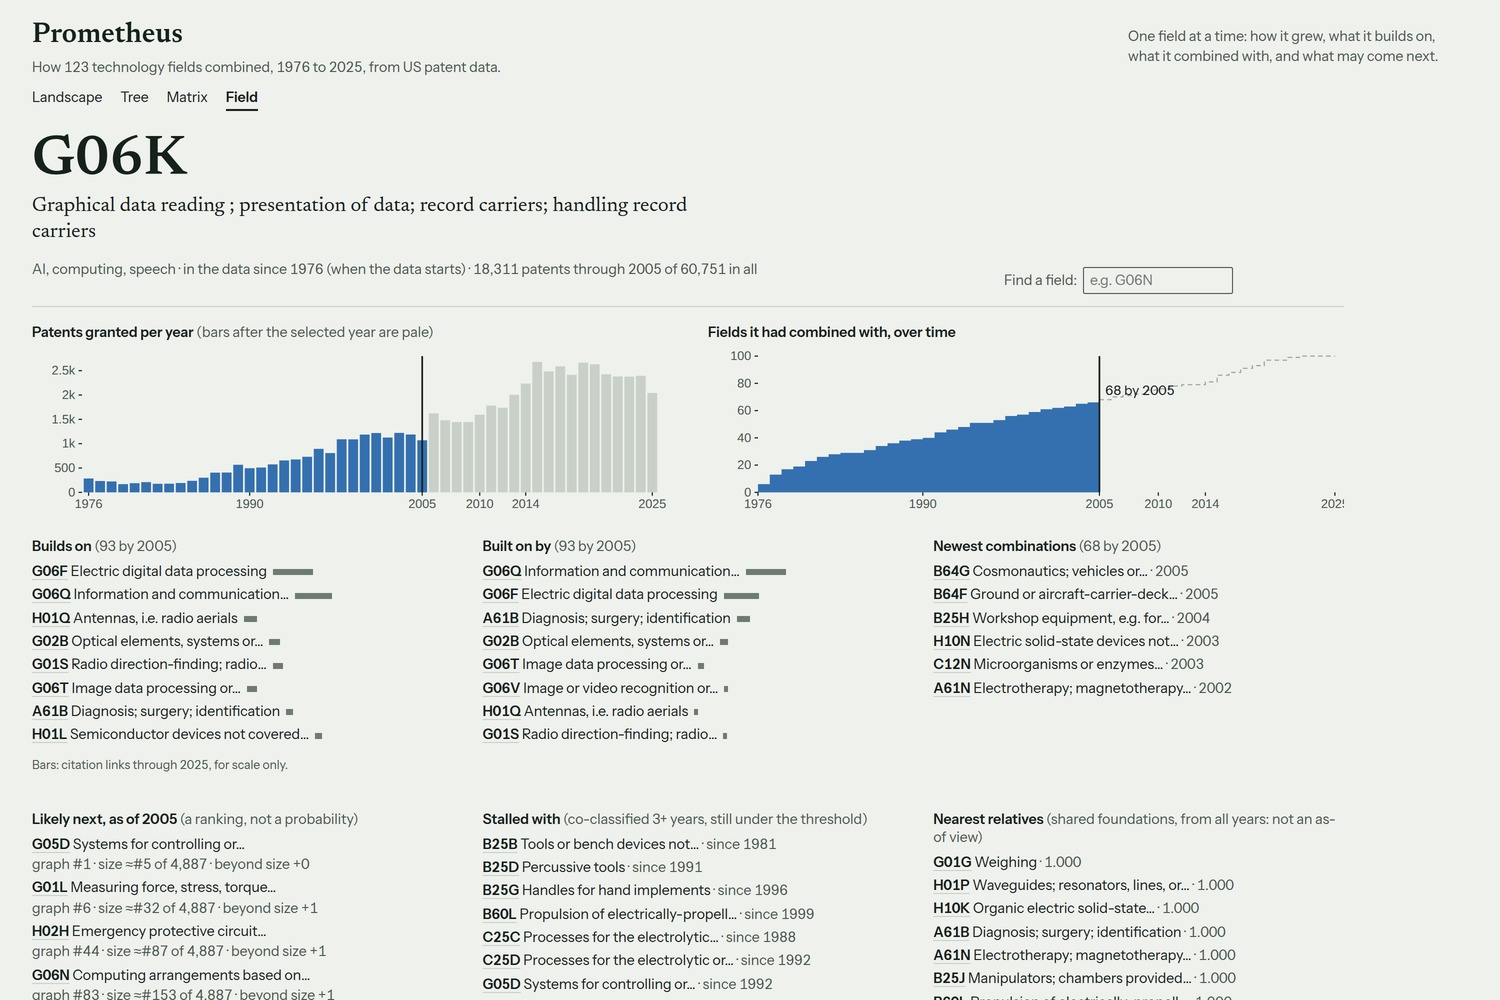
- Web views: a tree, a 3D landscape, a matrix and a field profile, all asking Relate live.
- AI agents: they read the same graph through Relate's read-only MCP server, from sealed, blinded yearly snapshots, and write their forecasts into a shared ledger.
One example: in 2005 the graph's top pick was control systems × reading data (G05D × G06K), two fields that had never combined. They combined in 2011, and 368 patents carry both today.
How we built it
- DuckDB reduces 15.5 GB of PatentsView tables to a few small CSVs, in under 30 seconds.
- Relate holds everything else: the graph in one file, every query in Cypher, a vector index, a sealed snapshot file per year for blind tests, the MCP interface for agents, and a shared ledger where each forecast is one transaction.
- Python does the scoring; d3 and three.js draw the views.
- 67 tests cover leakage, capsule sealing, a placebo, and agreement between the Cypher and Python scorers.
Challenges we ran into
- No peeking at the future. A prediction as of year Y must not see anything after Y. We made time travel a filter rather than a copy, kept end-of-data totals out of every feature, froze the weights on 1990–2000, and served agents blinded snapshots with anonymous field ids.
- A 10.9 GB citation file on a laptop with about 5 GB of free disk: we streamed only the two columns we needed.
- One writer per file. Relate locks a file for a single writer, so several agents write through one MCP server, each forecast in one transaction. A stress test of 100 concurrent writes lost none.
- An honest result. The size rule is very strong at the top of the ranking.
Accomplishments that we're proud of
- It predicts on years it never saw: 0.84–0.86 AUC, above the size rule every time.
- It adds the most where size says least: on pairs the size rule ranks low, it adds +0.09 to +0.23 AUC.
- Blinded agents did well: they picked 9 of 30 pairs that came true, where chance expects 1.5.
- We report the failure too: the stricter test we set in advance (2× the size rule in the top 100) was not met, at 1.04×. The front page of the app says so.
What we learned
Most "technology convergence" signal is size. The graph's real value is where size is silent, and in explaining why a pair might combine. Keeping time-travel, blind snapshots and shared agent state in plain Relate files made the whole experiment easy to reproduce and audit.
What's next
- Open the "Beat the graph" challenge so others can submit forecasts on the sealed snapshots.
- Run larger agent rounds.
- Extend the graph to more fields and to other patent offices.
Built With
- cypher
- d3.js
- duckdb
- javascript
- mcp
- python
- relate
- three.js
