-
-
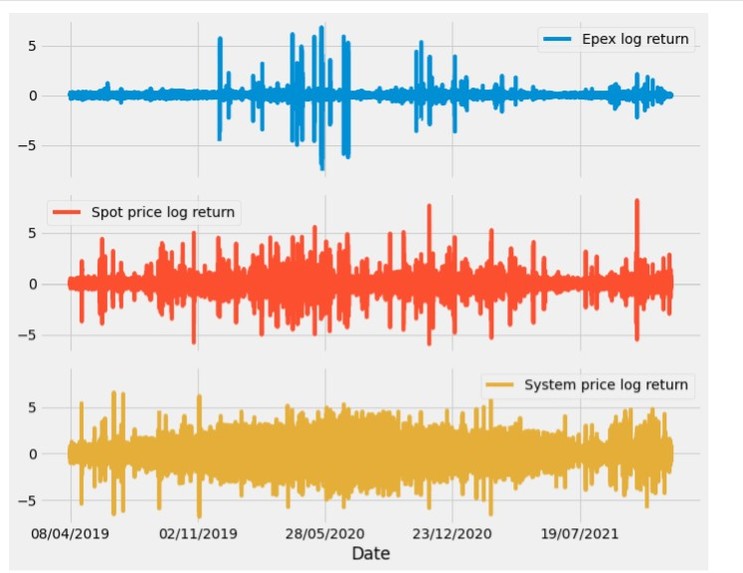
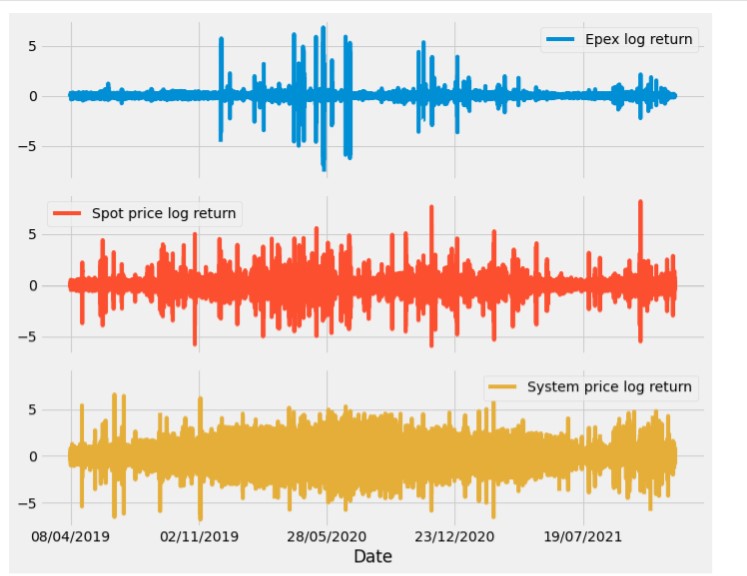
Log return graph of prices
What it does
Energy price.ipynb: Cleans the three price datasets, ensuring they line up, imputing missing values, removing erroneous data, merges the three datasets together, adds daily average temperature data Scales and picks features to feed into Machine Learning Algorithm for predicting the impending System Price AI_Hackathon.ipynb: Uses the three price dataset to produce graphs that show the characteristics of each dataset, how they relate to each other, their volatility, seasonality, etc
How we built it
Using pandas, python on GoogleCollab and Jupyter. The histogram image relied on Excel
Challenges we ran into
Dealing with the minute details of the data preprocessing stage took a lot of time
Accomplishments that we're proud of
The data is finally ready to be put into forecast, and the graphs offer great insight into the data
What we learned
Data preprocessing is hard and takes a lot longer than anticipated
What's next for Energy Price Forecasting
Acting on the recommendations listed in the end of the jupyter notebook to improve the forecasting models performance


Log in or sign up for Devpost to join the conversation.