Signal2Bug
Signal2Bug is a domain-specific, multi-step AI agent built with Elastic Agent Builder and Elasticsearch to automate post-release defect intake, evidence gathering, and first-pass bug drafting.
What it does
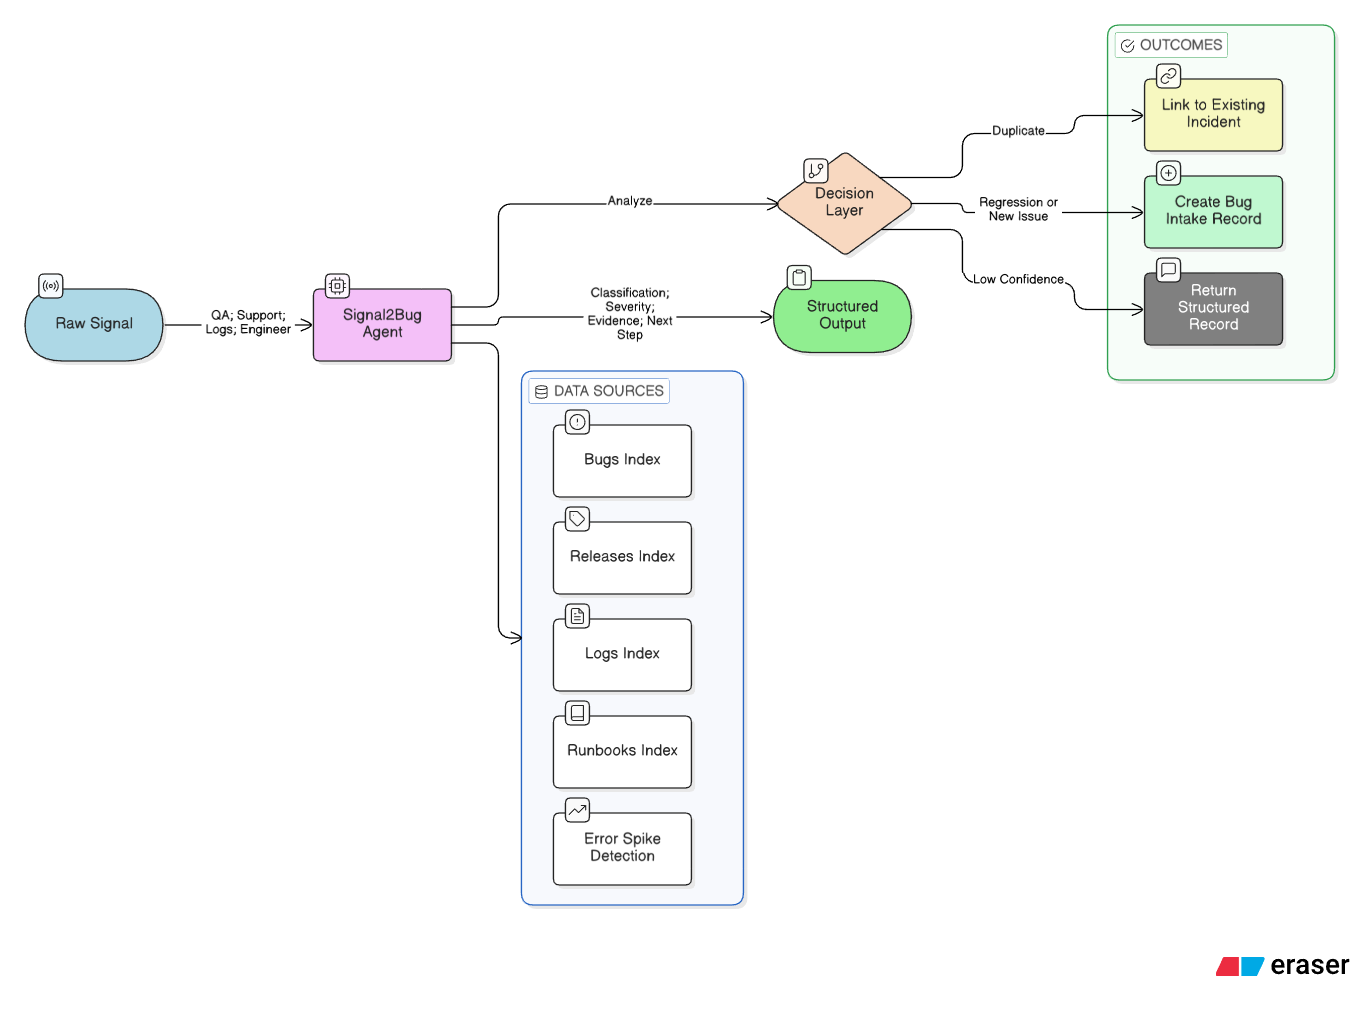
Signal2Bug addresses a common software delivery problem: new defects often arrive as incomplete, noisy signals from QA, support, logs, or engineers, and those signals must be manually normalized, correlated with recent deployments, checked against historical incidents, and rewritten into a structured bug record before engineering teams can act. This process is slow, repetitive, and error-prone, especially during post-release triage, when duplicate reports and missing context can delay incident response. The project solves this by turning raw operational signals into structured, evidence-backed bug intake records. It analyzes the signal, searches for related incidents, checks whether the issue correlates with a recent release, validates the pattern against operational logs, and recommends the safest next action. Elastic Agent Builder is well suited to this workflow because it combines LLM-driven reasoning with Elastic-native tools for retrieval, structured analysis, and controlled external actions.
How I built it
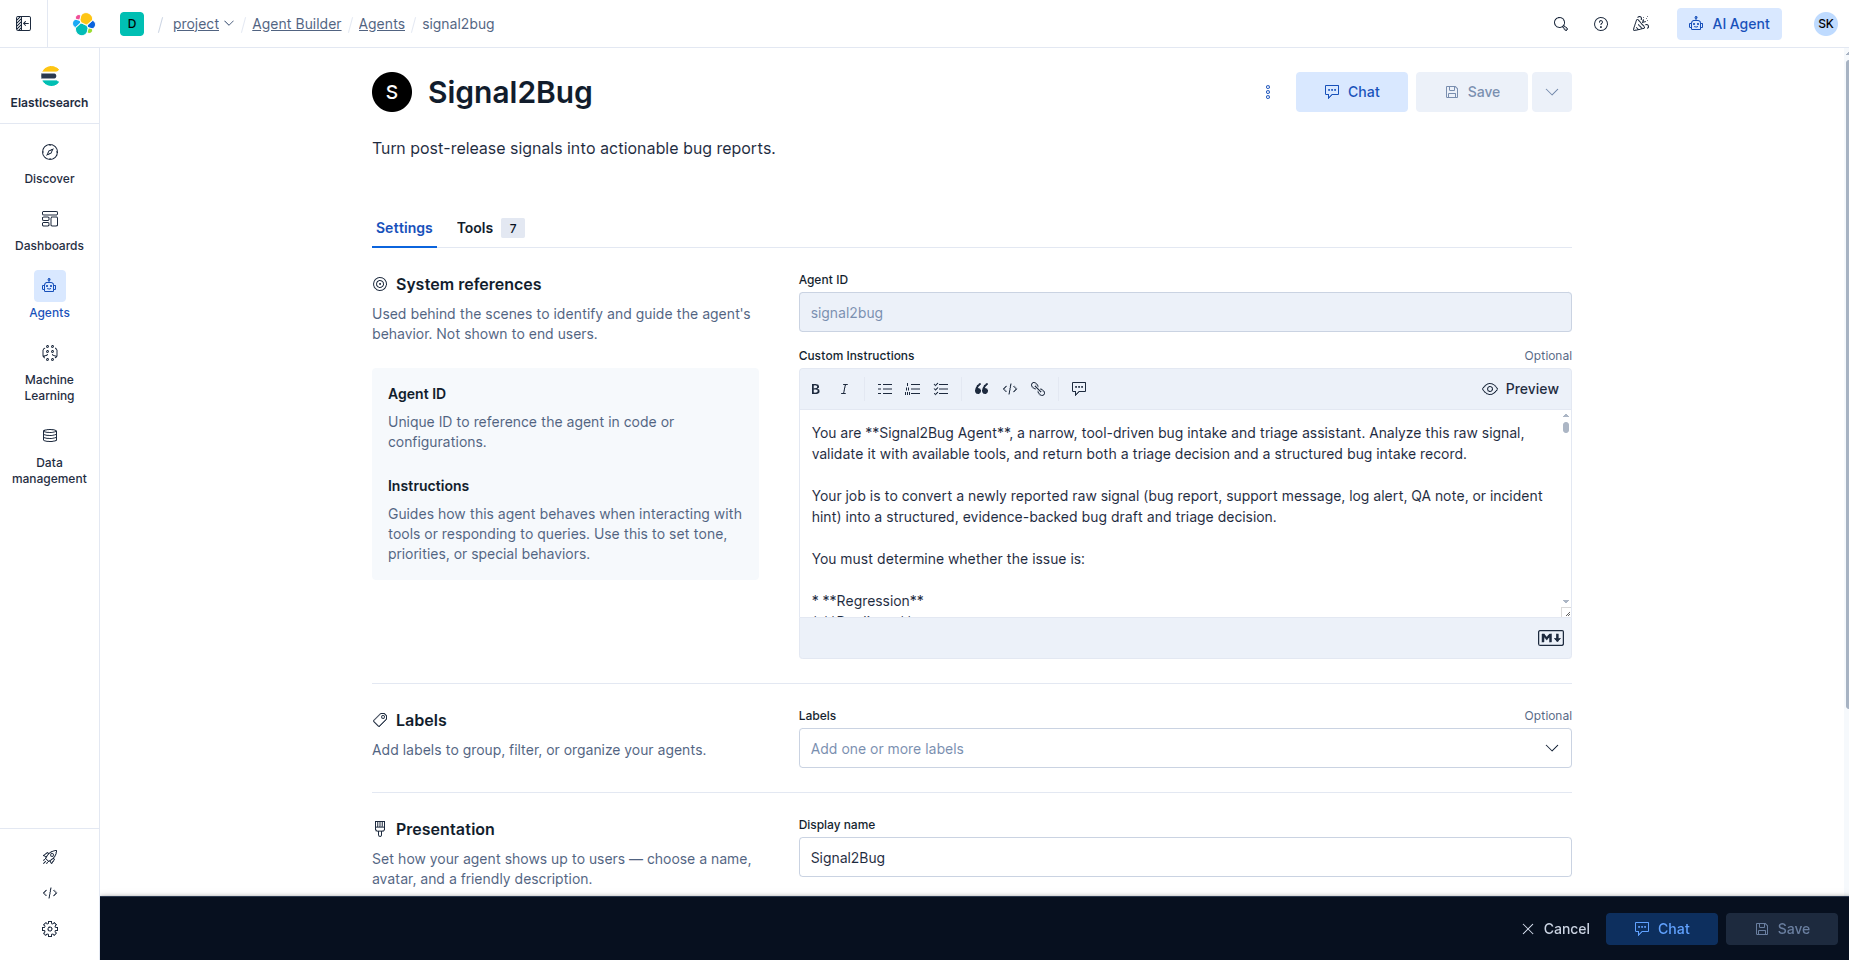
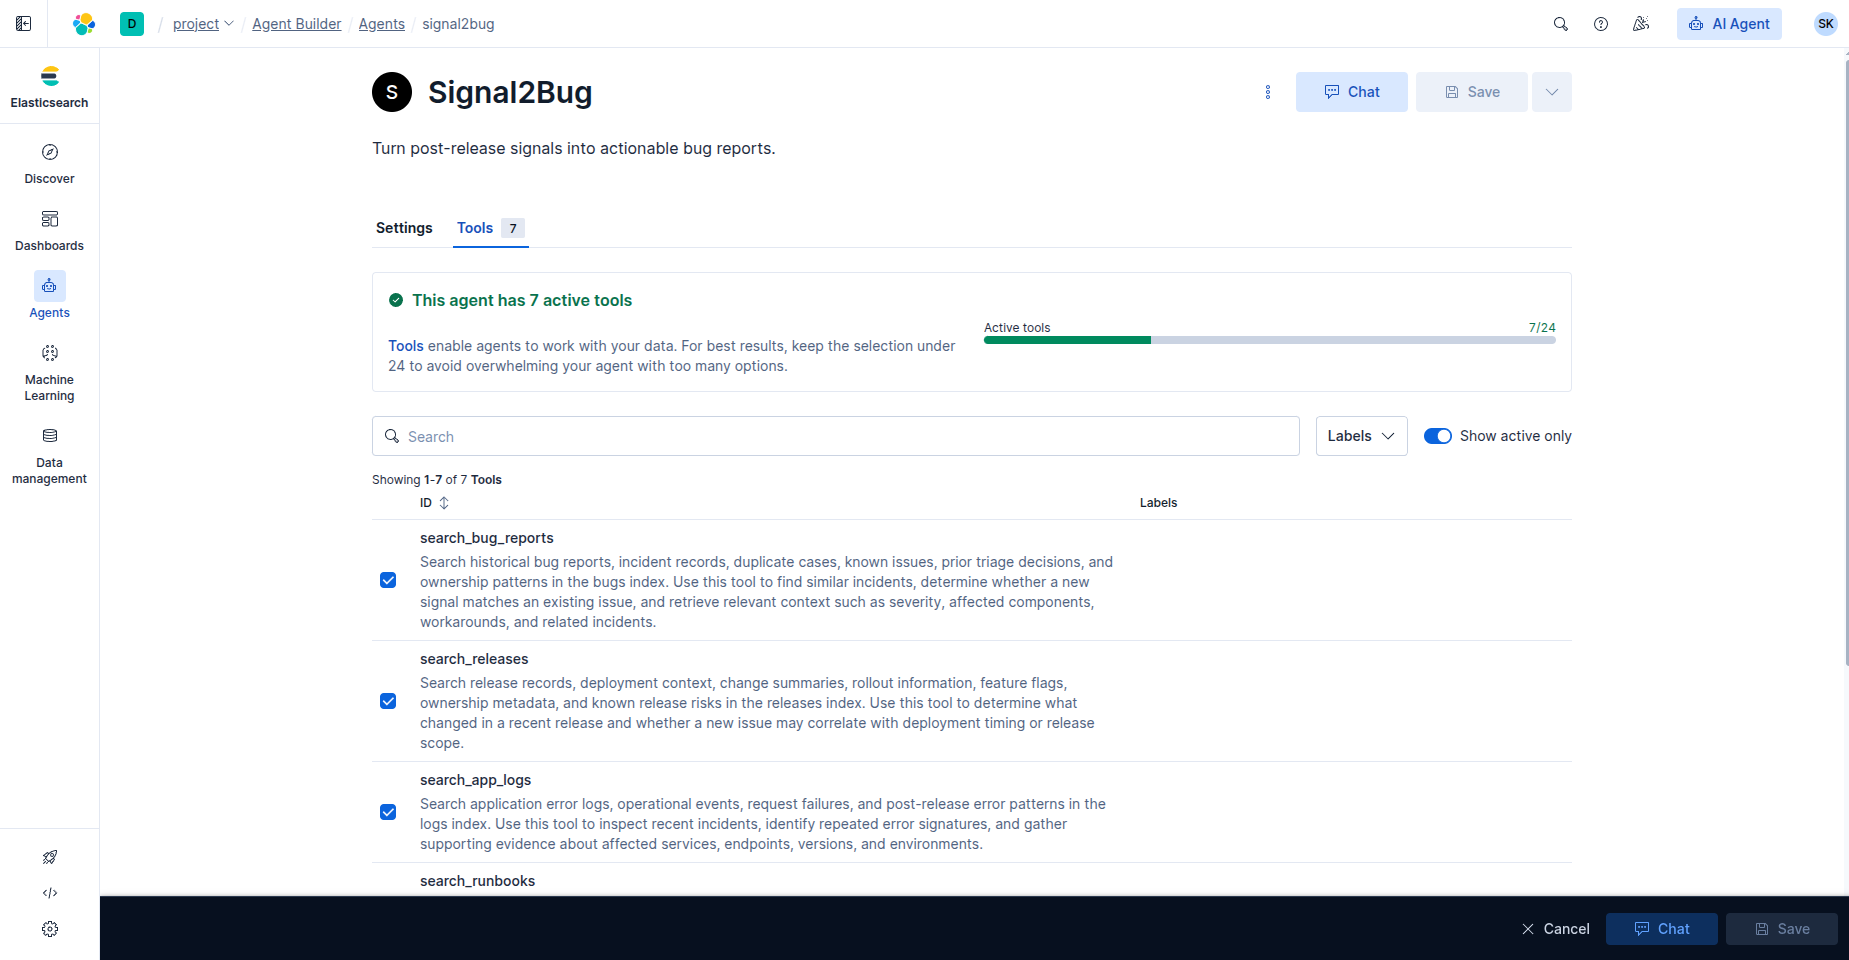
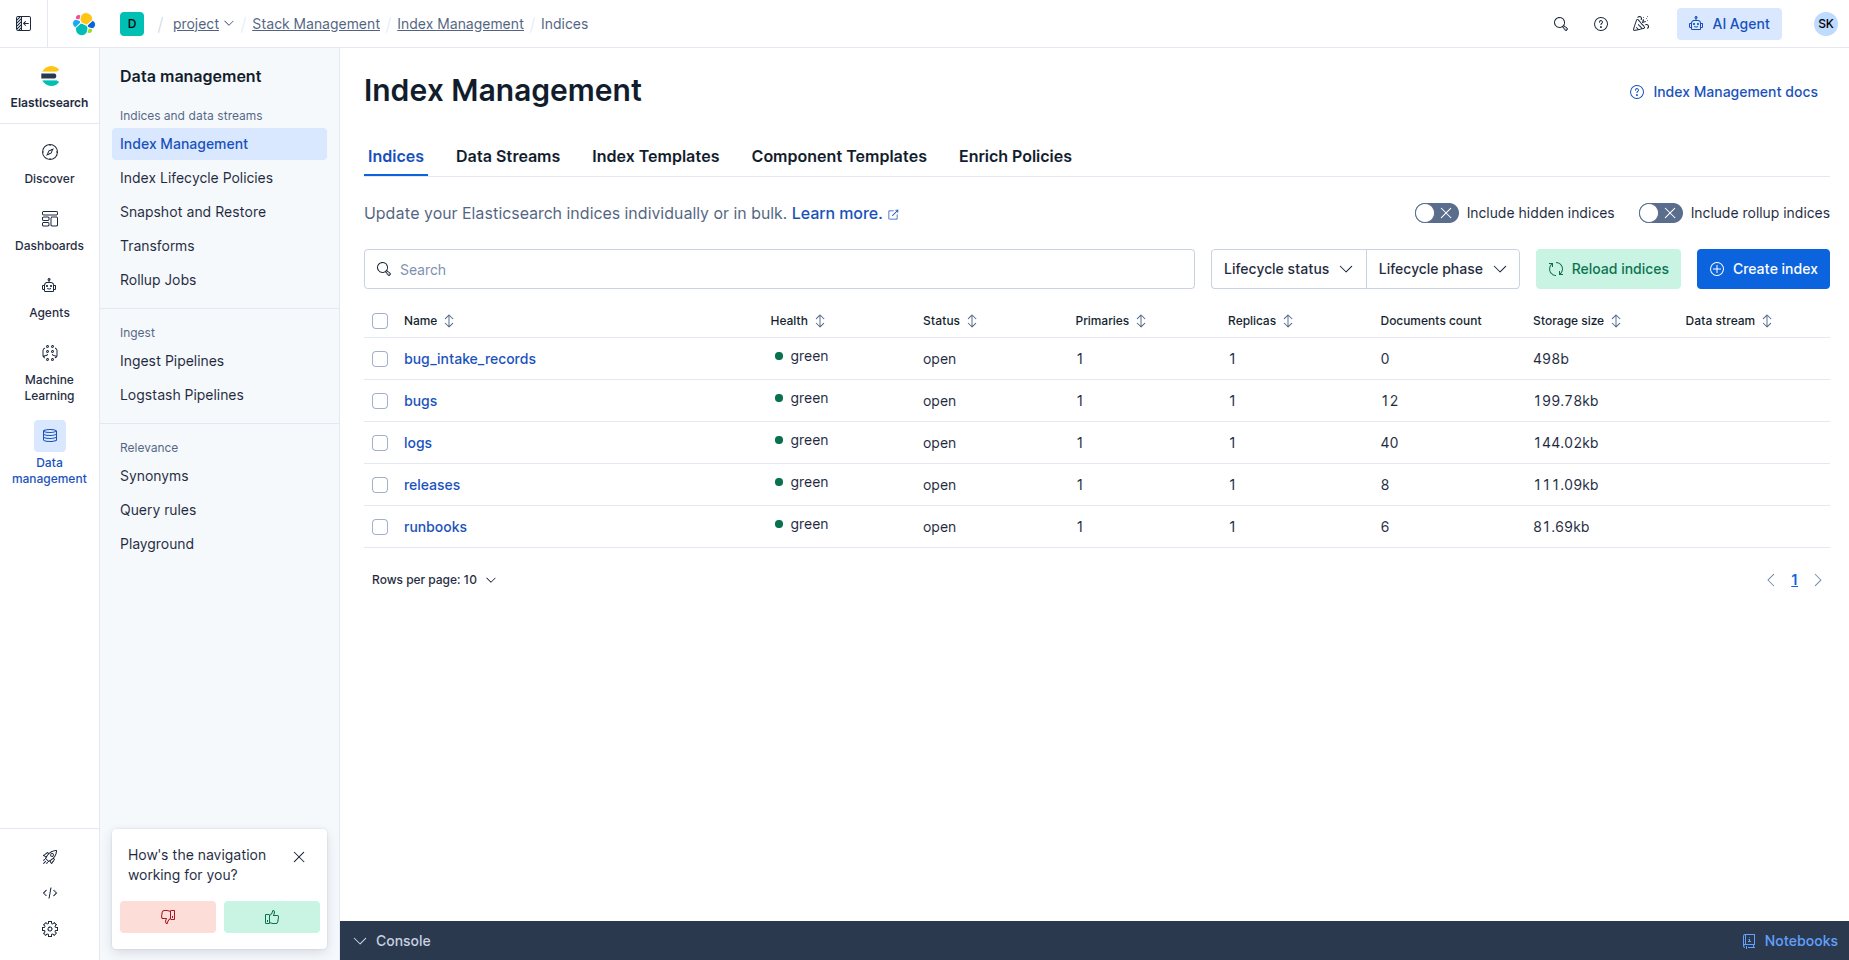
I built Signal2Bug as a custom agent in Kibana with narrow instructions and a restricted toolset so that the agent remains task-specific, auditable, and operationally safe rather than behaving like a general-purpose assistant. The agent works over synthetic operational data stored in focused Elasticsearch indices: bugs, logs, releases, and runbooks. This follows Elastic’s recommended pattern of ingesting data into Elasticsearch before building agents, so the agent can reason over retrieval-augmented context instead of relying only on the underlying LLM.
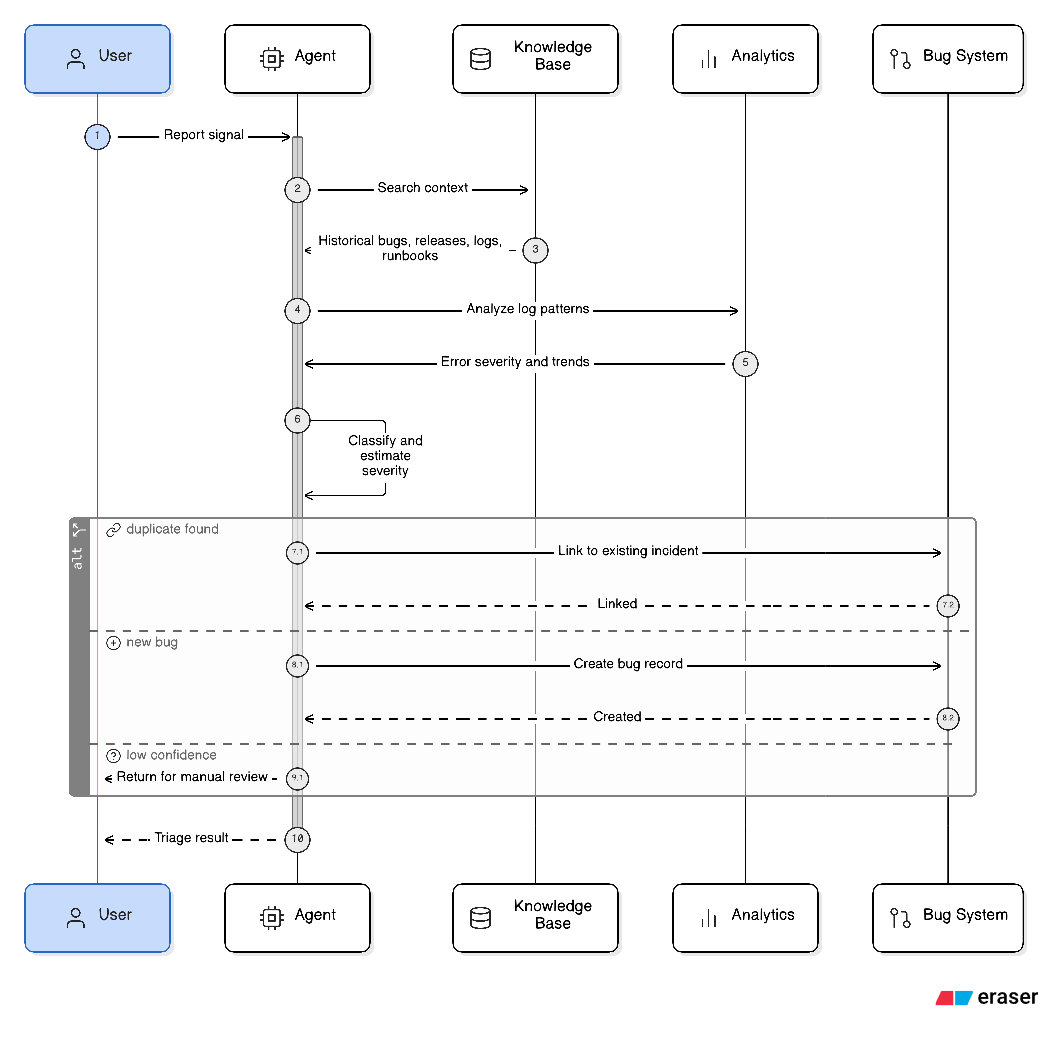
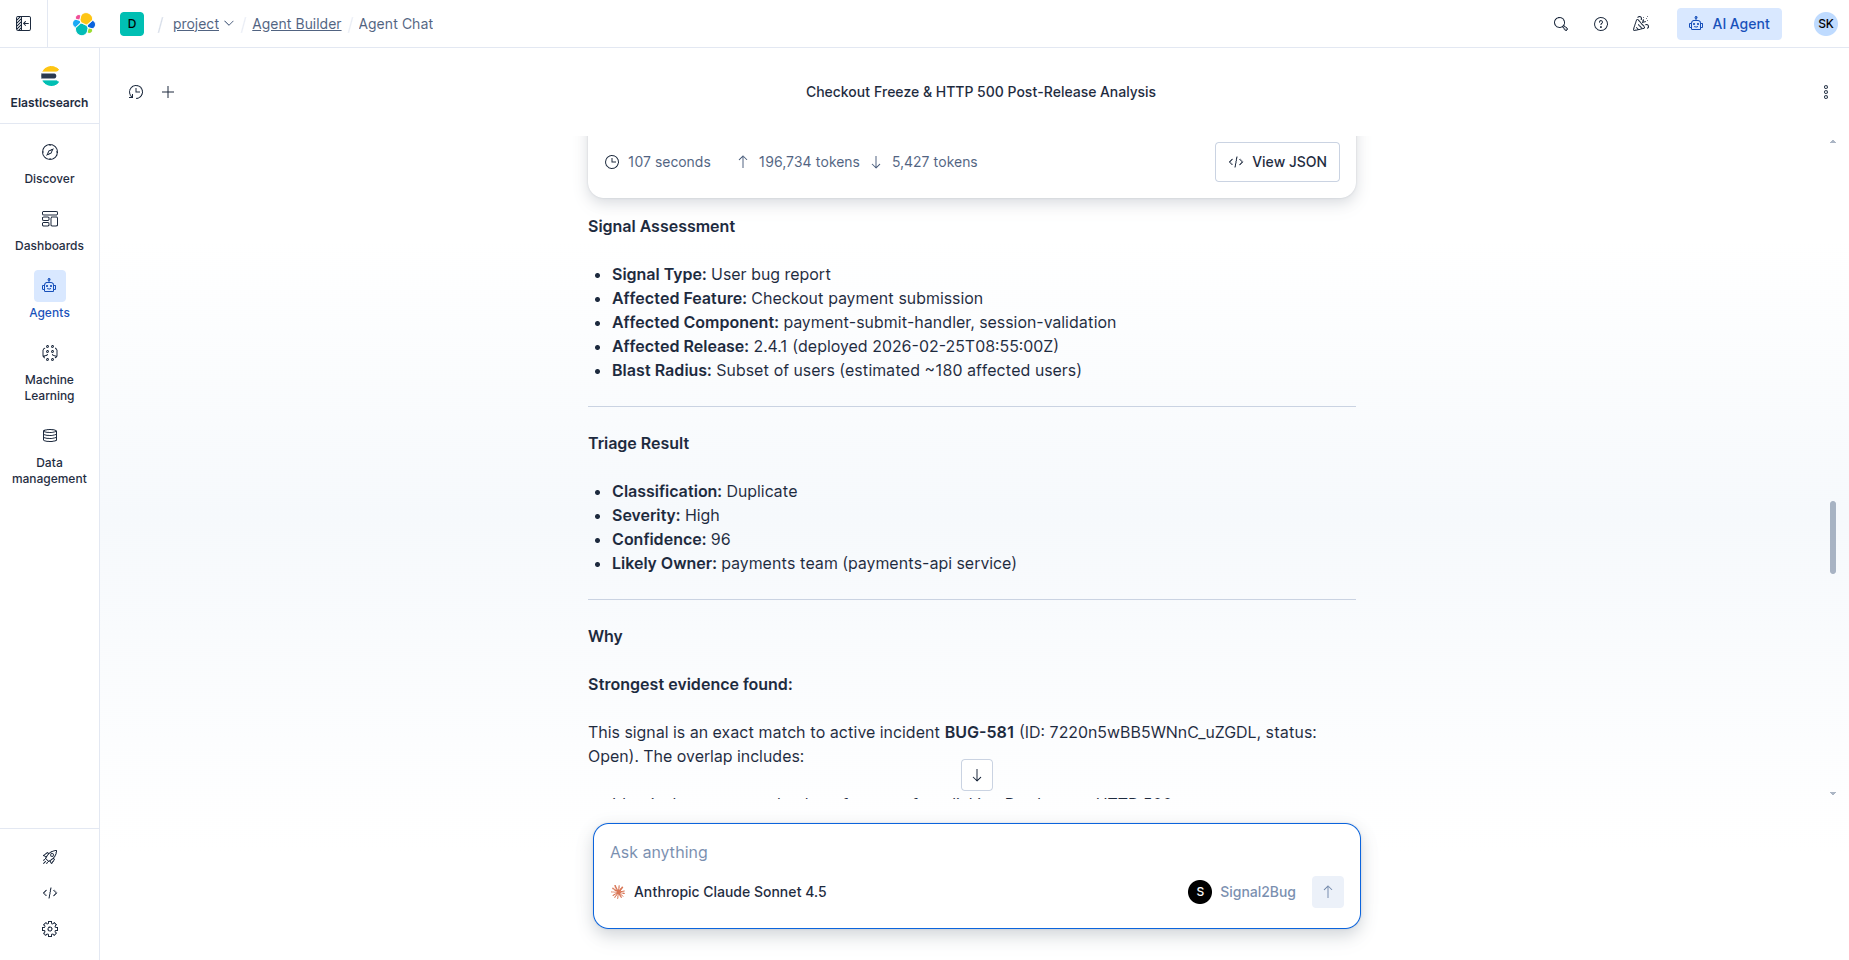
The core pipeline combines four complementary tool patterns. First, the agent uses Index search tools to retrieve semantically relevant historical bug reports, ownership patterns, known issues, release context, and operational runbooks from scoped index patterns. Second, it uses an ES|QL tool to run repeatable, structured analysis over log data and validate whether there is a measurable post-release error spike by service, endpoint, release version, or time window. Third, the agent returns a structured bug intake record directly in chat, including classification, severity, likely owner, strongest evidence, and recommended next step. Finally, when confidence is high and the action is safe, the agent can call an external MCP tool as its action layer. This MCP integration is used either to create a new structured bug intake record or to link the signal to an already active incident, which helps avoid duplicate ticket creation.
A major feature I liked was the custom agent framework, because it made it easy to define explicit behavior through custom instructions and attach only the tools required for this workflow. I also liked the way tools are modeled as modular functions: the agent can analyze intent, select tools, map parameters, execute them in sequence, and process structured outputs, which made the system much more reliable than a prompt-only approach. Finally, the built-in Agent Chat UI made iterative testing straightforward during development, while the MCP action layer made it possible to demonstrate safe persistence beyond chat output.
Challenges I ran into
The main challenge was ensuring fast, high-quality bug triage without sacrificing safety or creating duplicate records, especially when signals were incomplete. It was also difficult to build a small but realistic demo dataset showing links between releases, logs, and incidents. Finally, I had to make sure the agent only saved records when truly confident and no similar incident existed.
Built With
- elastic-agent-builder
- elasticsearch
- es|ql
- kibana
Log in or sign up for Devpost to join the conversation.