-
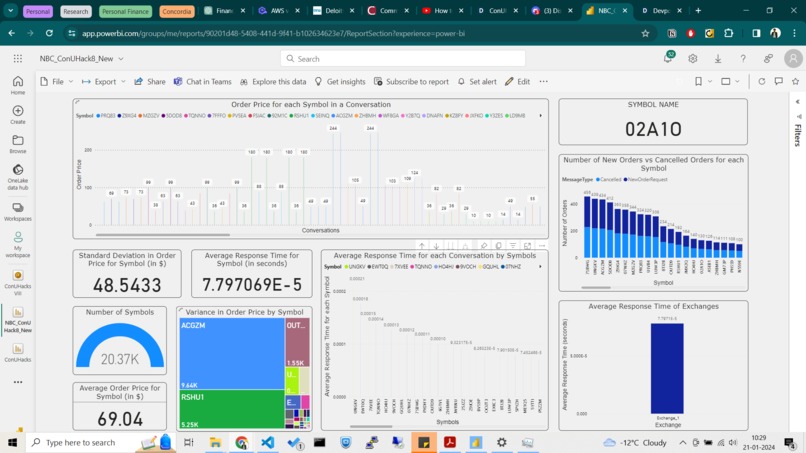
A snapshot of the Data Visualization on the Power BI Dashboard

Inspiration
Data Visualization of Buy/Sell Transactions can help identify Economic Indicators and Market Trends, which can greatly benefit Commercial Banks and Non-Banking Financial Corporations, to improve the trade accuracy, and predict future values and also to reduce losses by identify anomalous transactions/conversations.
What it does
The Equity Flow Visualizer uses the National Bank Conversation data to create visualizations which enables us to identify different insights from the data, and also detect possible anomalies or outliers in the transactions.
How we built it
Challenges we ran into
Using Power BI, as the entire team was new to Data Visualization. Streaming the json data into Power BI.
Accomplishments that we're proud of
Worked on 3 different Data Ingestion techniques, to generate streaming data instead of just using static-json values, which helped us delve deeper into Power BI, identifying its limitations and potential.
What we learned
What's next for Project Vis
Create a Mobile Dashboard Scale the streaming dataset and remove the delay to send values as they come in, instead of with a delay, which was forced due to license issues with Power BI
Built With
- api
- power-bi
- python
- streaming-data

Log in or sign up for Devpost to join the conversation.