-
-
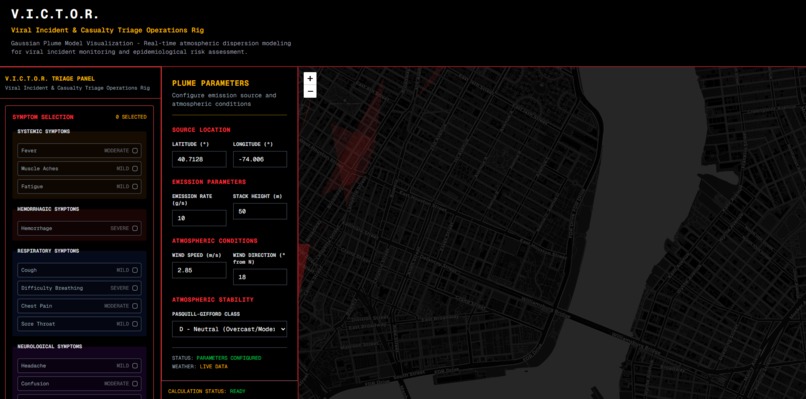
Main view
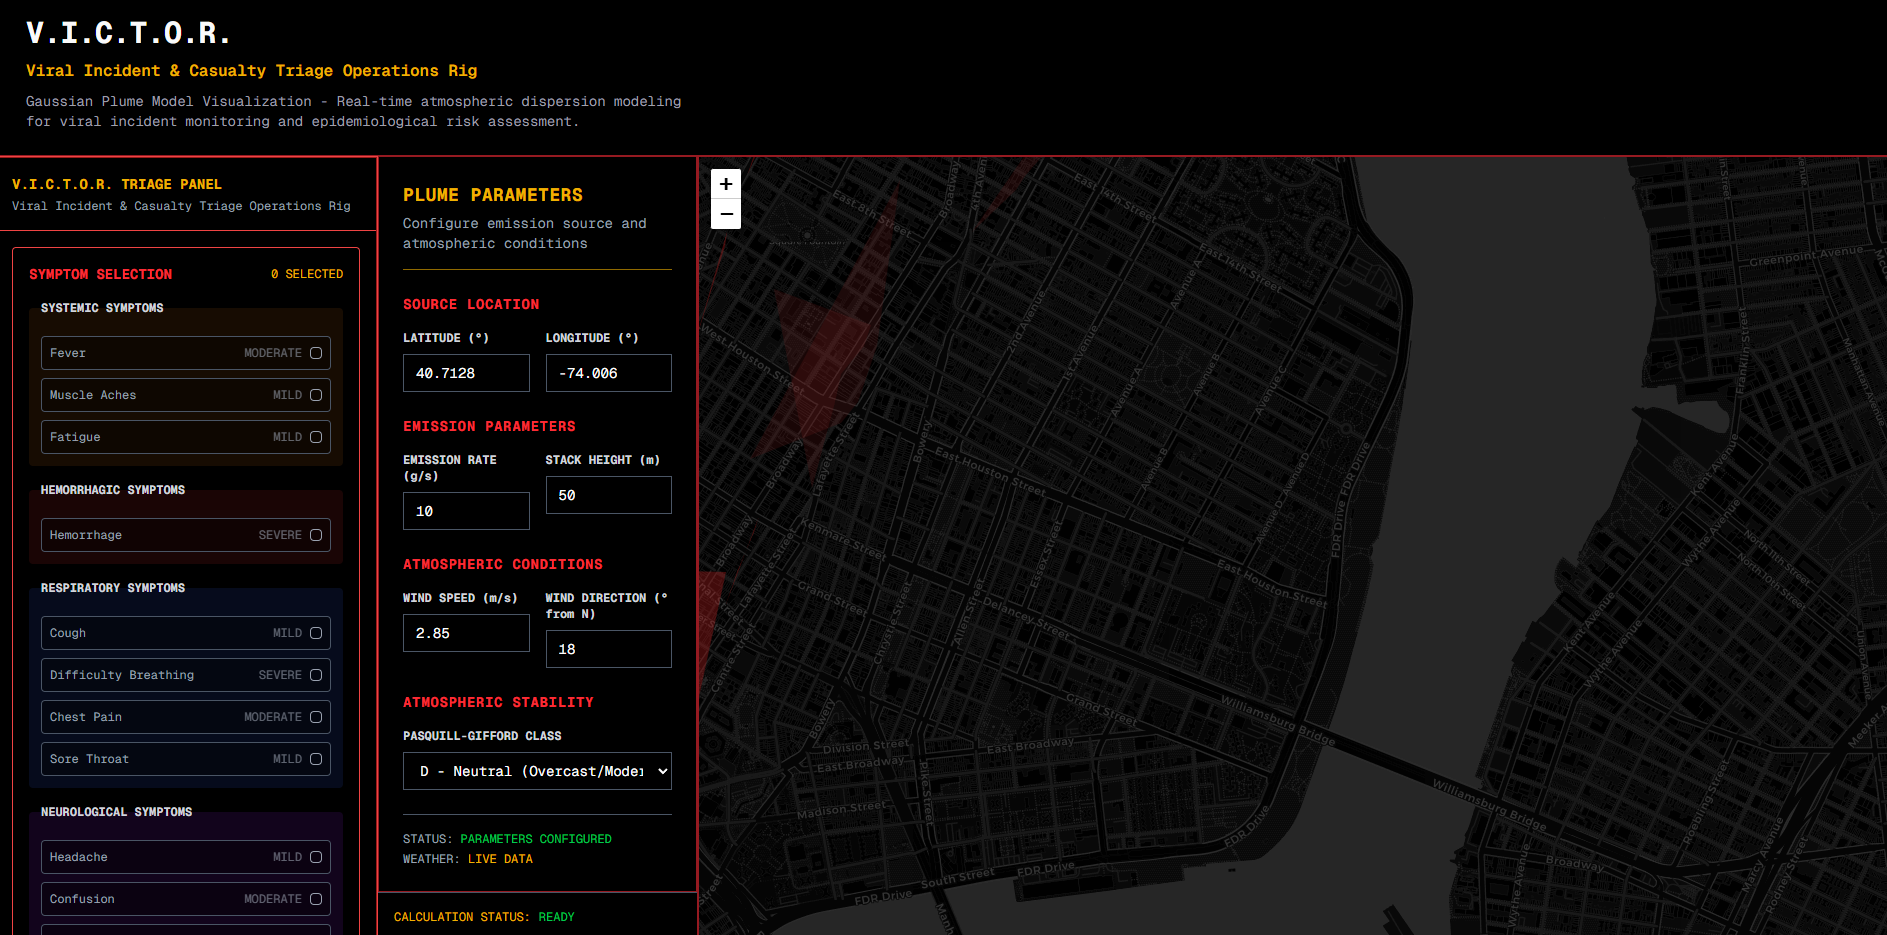
Inspiration
Biological threats don't wait for lab results. When a field agent arrives at a crash site or an outbreak zone, they need to know three things immediately: What is it? Can it survive here? Where is it blowing? I wanted to build a tool that answers these questions by stitching together data streams that usually never touch.
What it does
V.I.C.T.O.R. is a situational awareness engine.
- Inputs: It takes observed symptoms from the user.
- Stitches: It cross-references those symptoms with a database of pathogens, then immediately validates them against live local weather conditions (Humidity/Temp). If a pathogen can't survive the current air, it's ruled out.
- Visualizes: Once a threat is identified, it uses a Gaussian Plume Model to draw a dynamic "Infection Zone" on the map, shaped by real-time wind data.
How I built it
I built a chimera. I used Next.js for the shell, Supabase for the biological data, and Open-Meteo for the atmospheric data. The core challenge was implementing the Gaussian Plume Equation in TypeScript to bridge the gap between "Wind Speed" and "Infection Risk."
How I used Kiro
This was a "Spec-Driven" build. I wrote the architectural specs in Kiro that defined the mathematical boundaries of the app. Kiro's MCP (Model Context Protocol) allowed me to fetch live documentation for the Weather APIs, ensuring our integration was perfect without leaving the IDE.
Challenges I ran into
The biggest challenge was the "Coordinate Hell" of stitching physics onto a map.
- The Cartesian vs. Geographic Conflict: The Gaussian Plume equation works in Cartesian coordinates (meters X/Y/Z), but the Leaflet map uses Spherical Mercator coordinates (Lat/Lon). I had to build a translation layer that takes a wind vector in degrees, converts it to radians, calculates the plume spread in meters, and then projects that back onto the Earth's curvature.
- The "Stitch" Latency: I needed to filter pathogens based on live weather. Initially, the app waited for the user to select symptoms before fetching the weather, causing a delay. I had to architect a parallel fetching system where the weather conditions are retrieved the moment the GPS pin drops, so the triage logic is instant.
- Designing "Fear": Making a standard web app look like a "Biosafety Terminal" was difficult. I had to fight the default styles of UI libraries to enforce the "Void Black" and "Scanline" aesthetic.
Accomplishments that I'm proud of
- The Math Engine: I am not a physicist, but V.I.C.T.O.R. successfully runs the Gaussian Plume Equation ($C(x,y,z)$) in real-time in the browser. Seeing the red infection zone stretch and morph based on actual live wind data from Open-Meteo was a massive "It's Alive!" moment.
- Zero-Hallucination API Integration: By using Kiro's MCP (Model Context Protocol) to read the official Open-Meteo documentation, I implemented the API client correctly on the first try without guessing parameters.
- The Atmosphere: I tried to build a mood. The app genuinely feels like a classified tool used in a containment zone.
What I learned
- Spec-Driven Development is a Hackathon Cheat Code: Usually, in hackathons, you "code and pray." With Kiro, I wrote a
.specfile defining the math and the database schema first. It felt like I was the architect and Kiro was the contractor. It prevented spaghetti code even under the 19-hour deadline. - The Power of "Frankensteining": I learned that innovation often lives in the gaps between industries. Epidemiology and Meteorology are boring separately, but when you stitch them together, you get something critical.
- Fluid Dynamics: I learned more about how gas disperses in the atmosphere (Pasquill stability classes) in the last 12 hours than I ever thought I would.
What's next for Project V.I.C.T.O.R.
V.I.C.T.O.R. is currently a prototype, but the use case is real.
- Hardware Integration: I want to connect the app to local Bluetooth anemometers (wind sensors) for hyper-local wind data instead of relying solely on API weather stations.
- 3D Terrain Modeling: Currently, the plume assumes flat ground. The next version will use Mapbox 3D terrain to calculate how hills and buildings block the spread of the pathogen.
- GovTech Deployment: I believe this logic has genuine value for First Responders and HAZMAT teams. I plan to refine the pathogen database and pitch this as a lightweight, open-source alternative to expensive proprietary defense software.
Built With
- gaussian-plume-model
- kiro
- leaflet.js
- next.js
- open-meteo
- postgresql
- supabase
- tailwind-css
- typescript

Log in or sign up for Devpost to join the conversation.