-
-
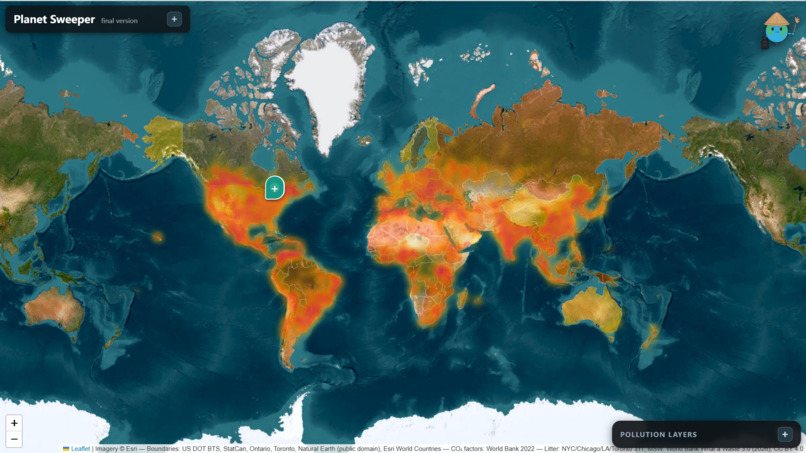
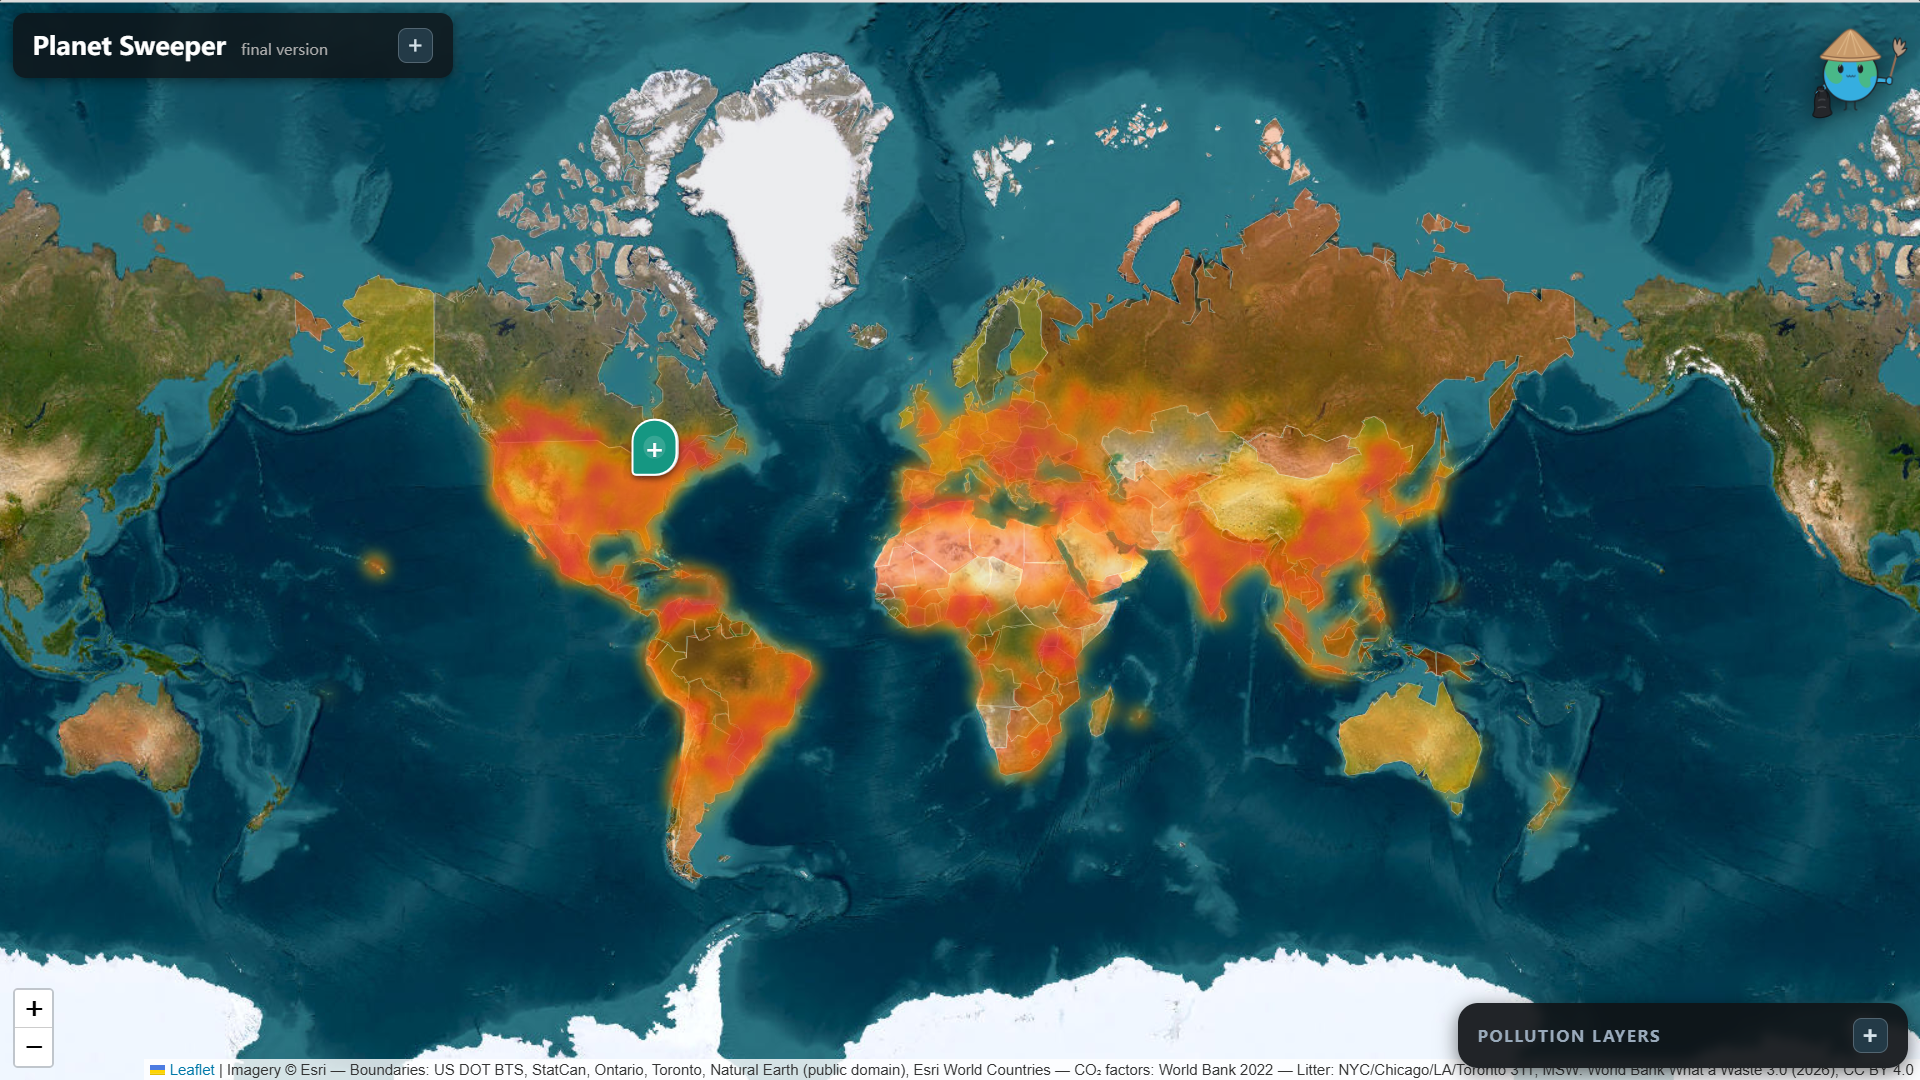
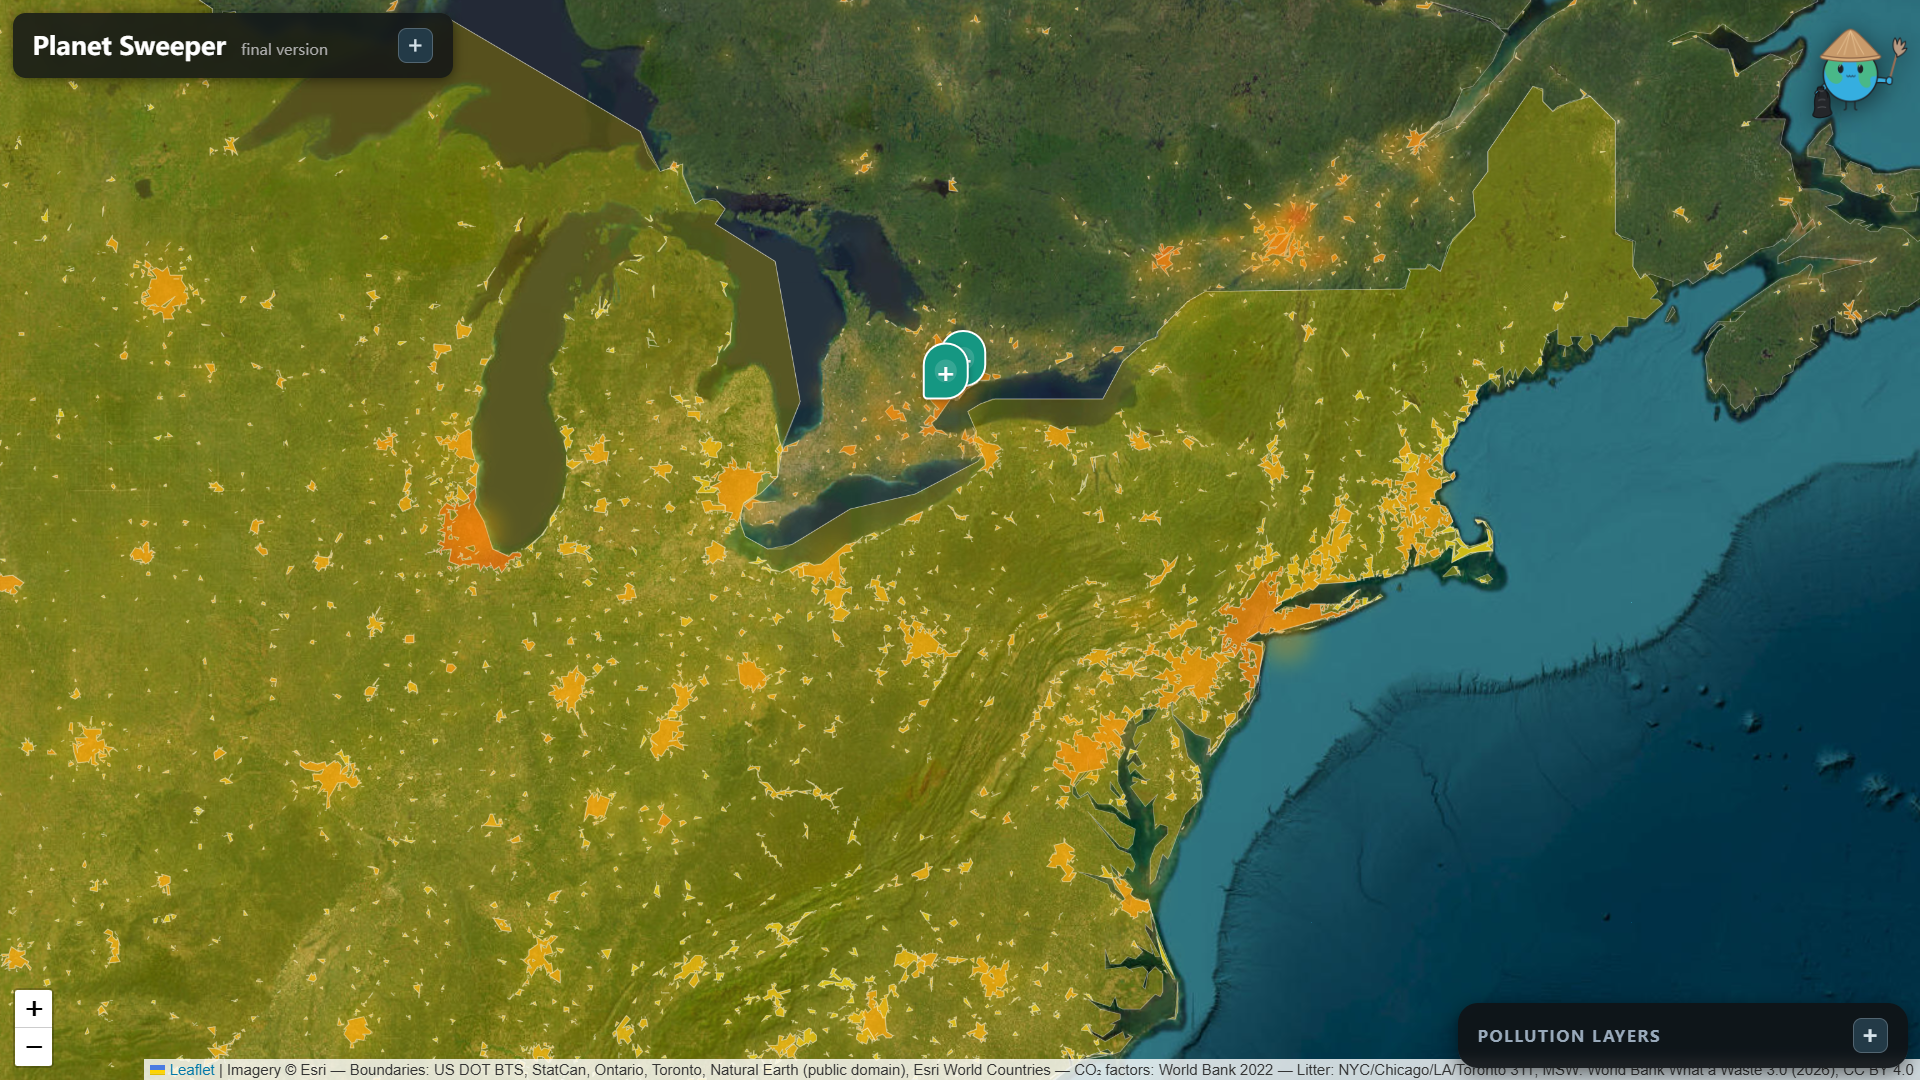
Litter and Waste pollution map, average concentrations are representated by the yellow hazes.
-
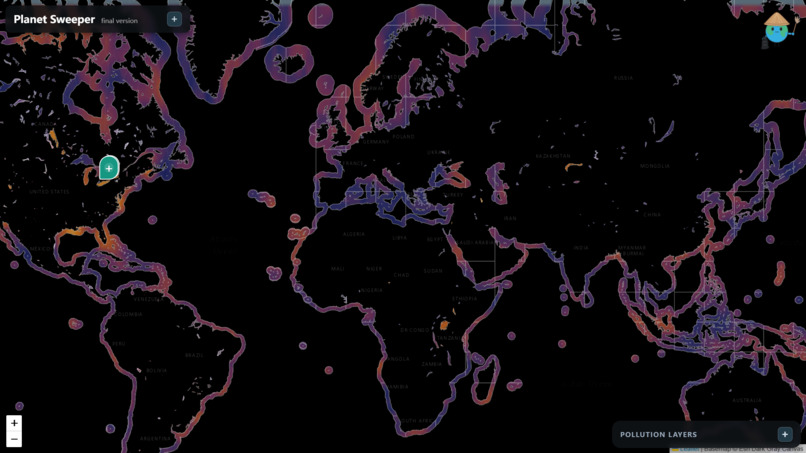
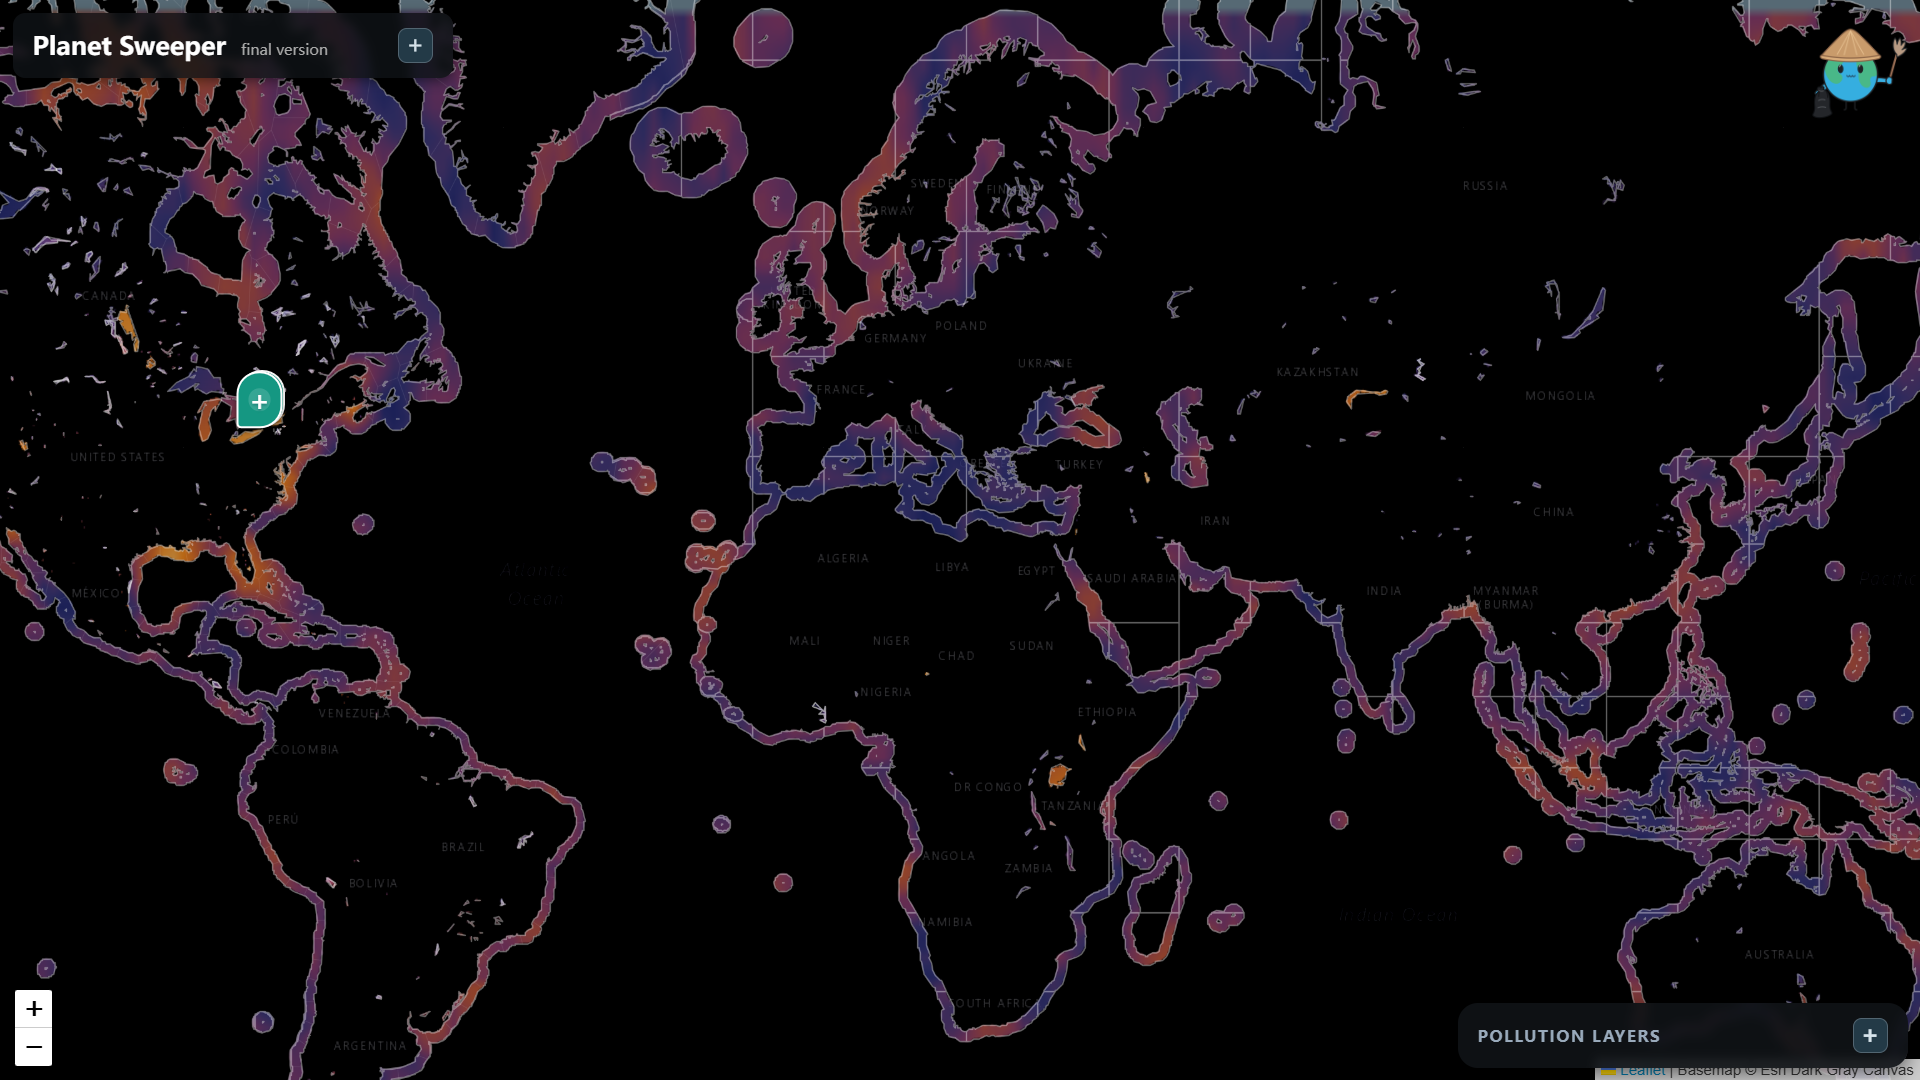
Ocean and water pollution map, ranging from blue(clean) to yellow(polluted). All coasts are modelled, along with every lake on Earth.
-
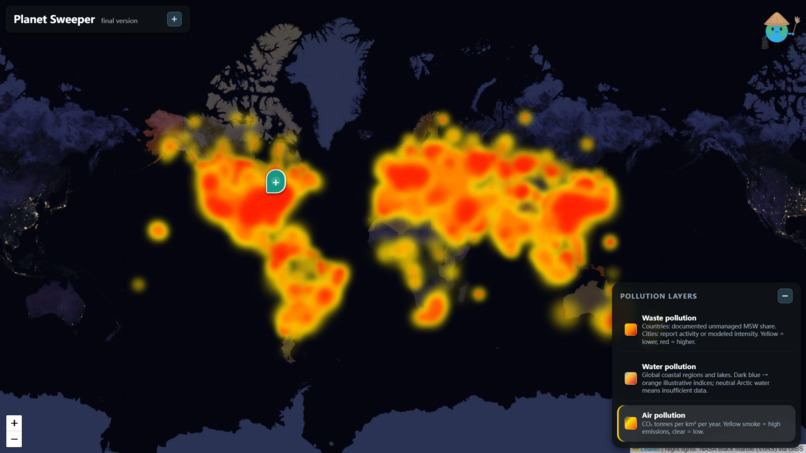
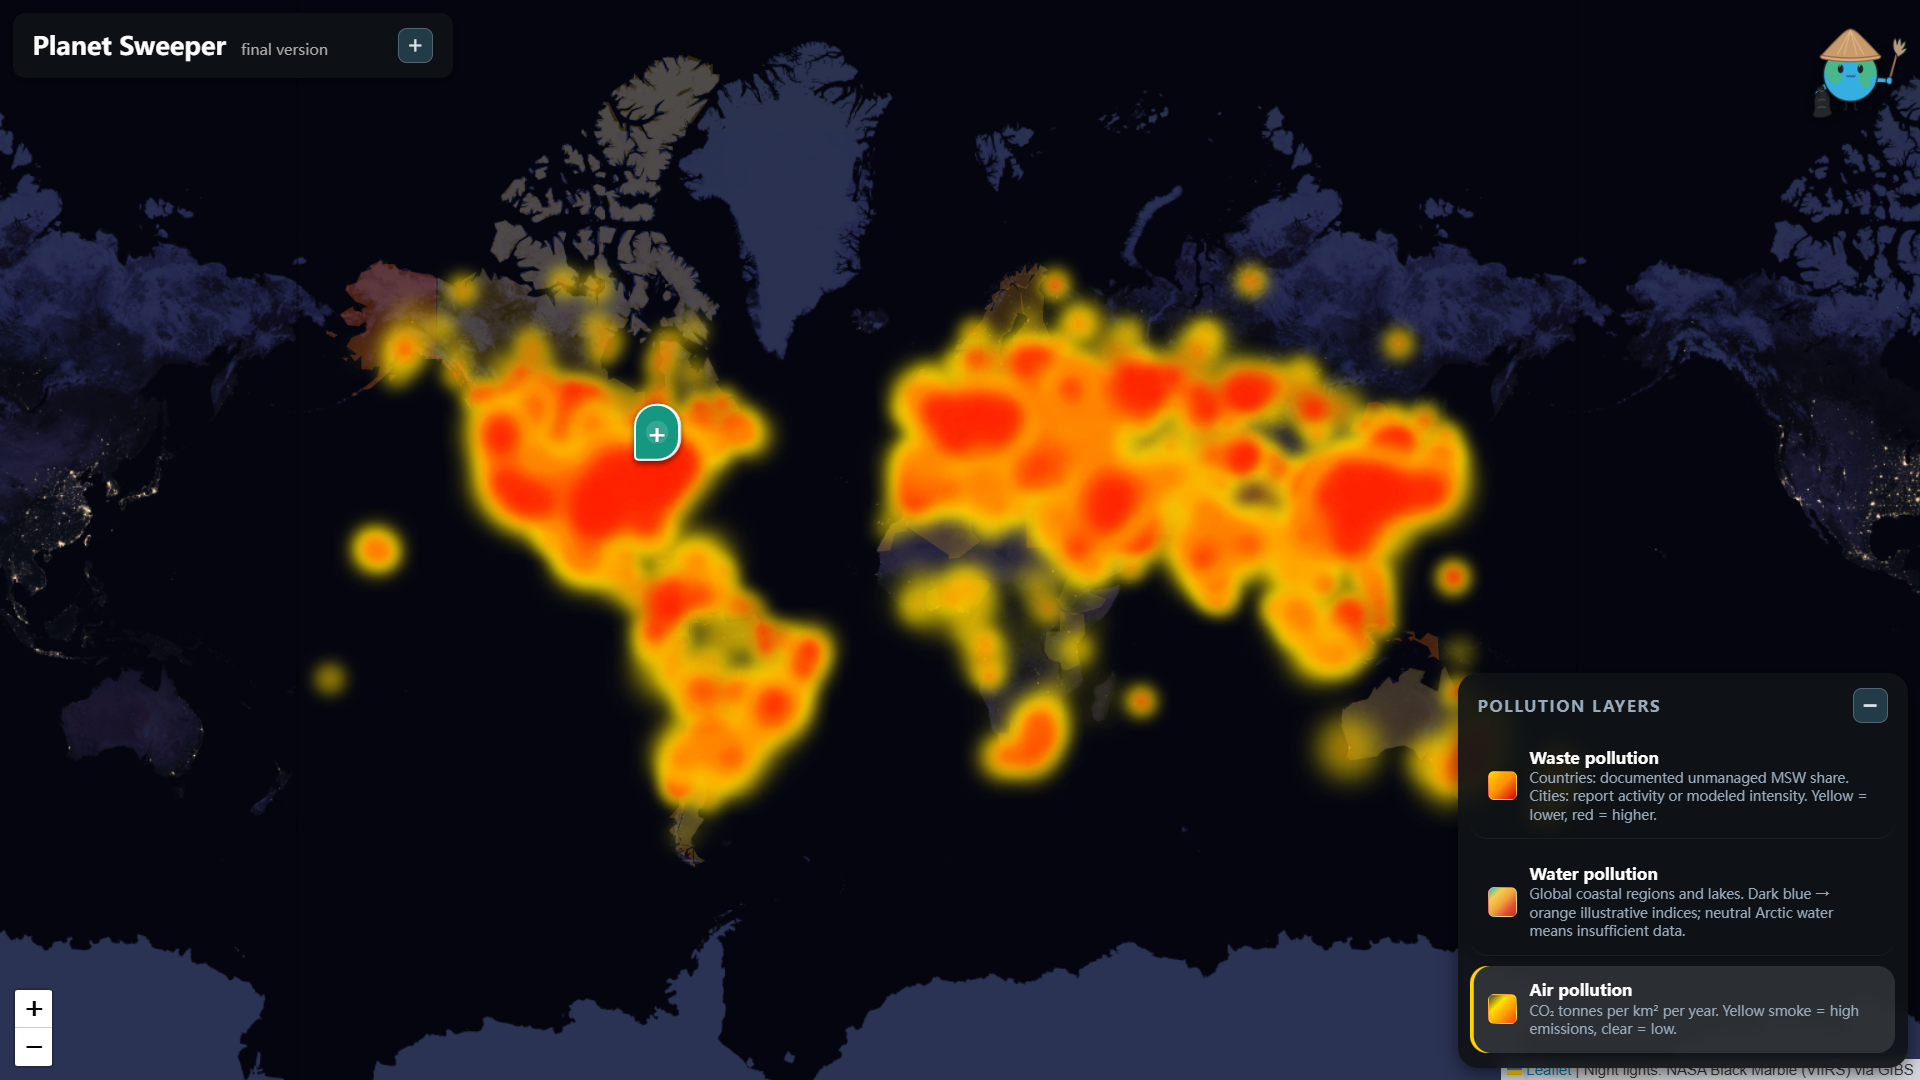
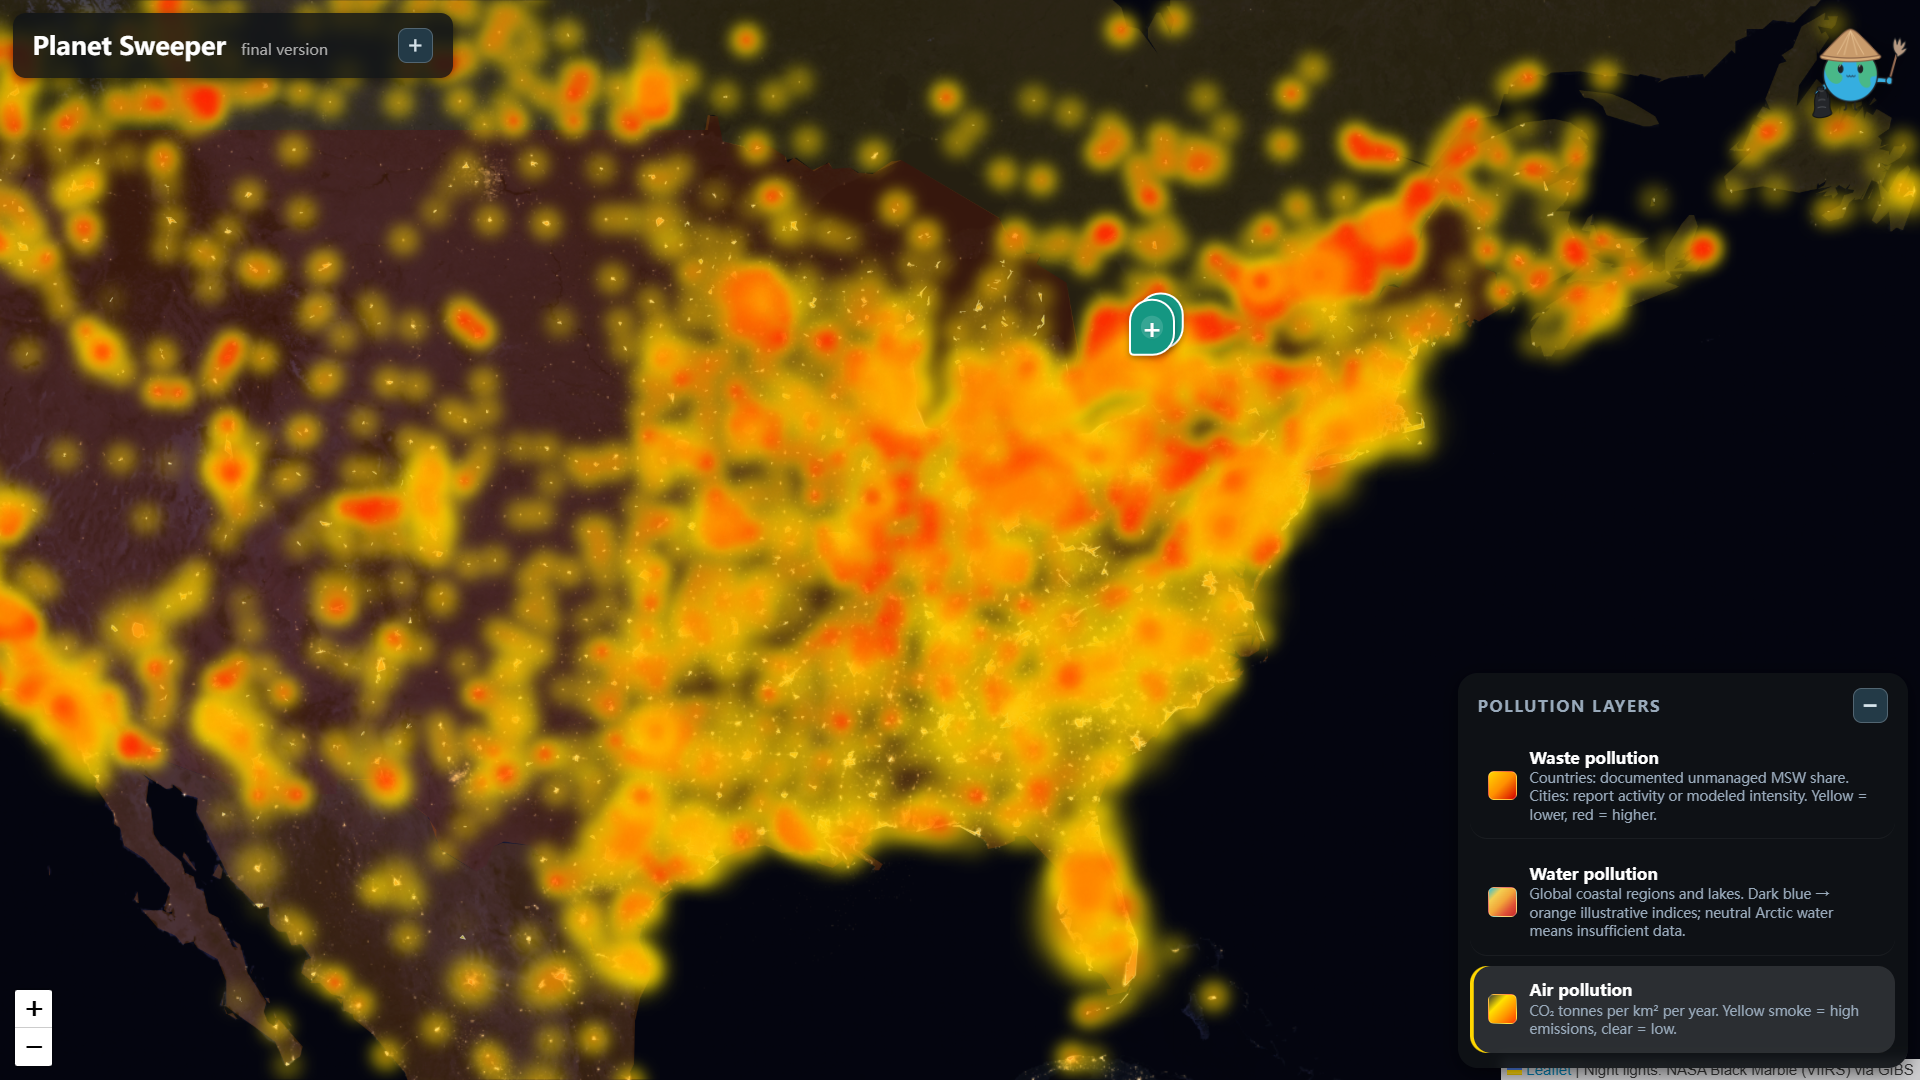
Air pollution map, same format as the litter pollution map, but hazier.
-
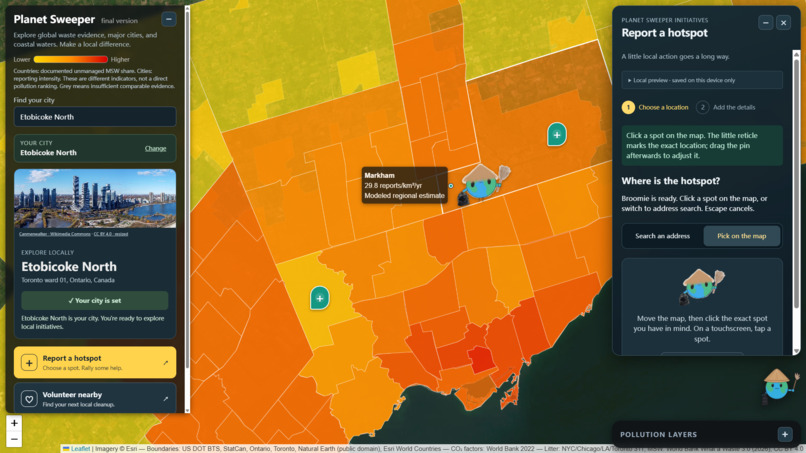
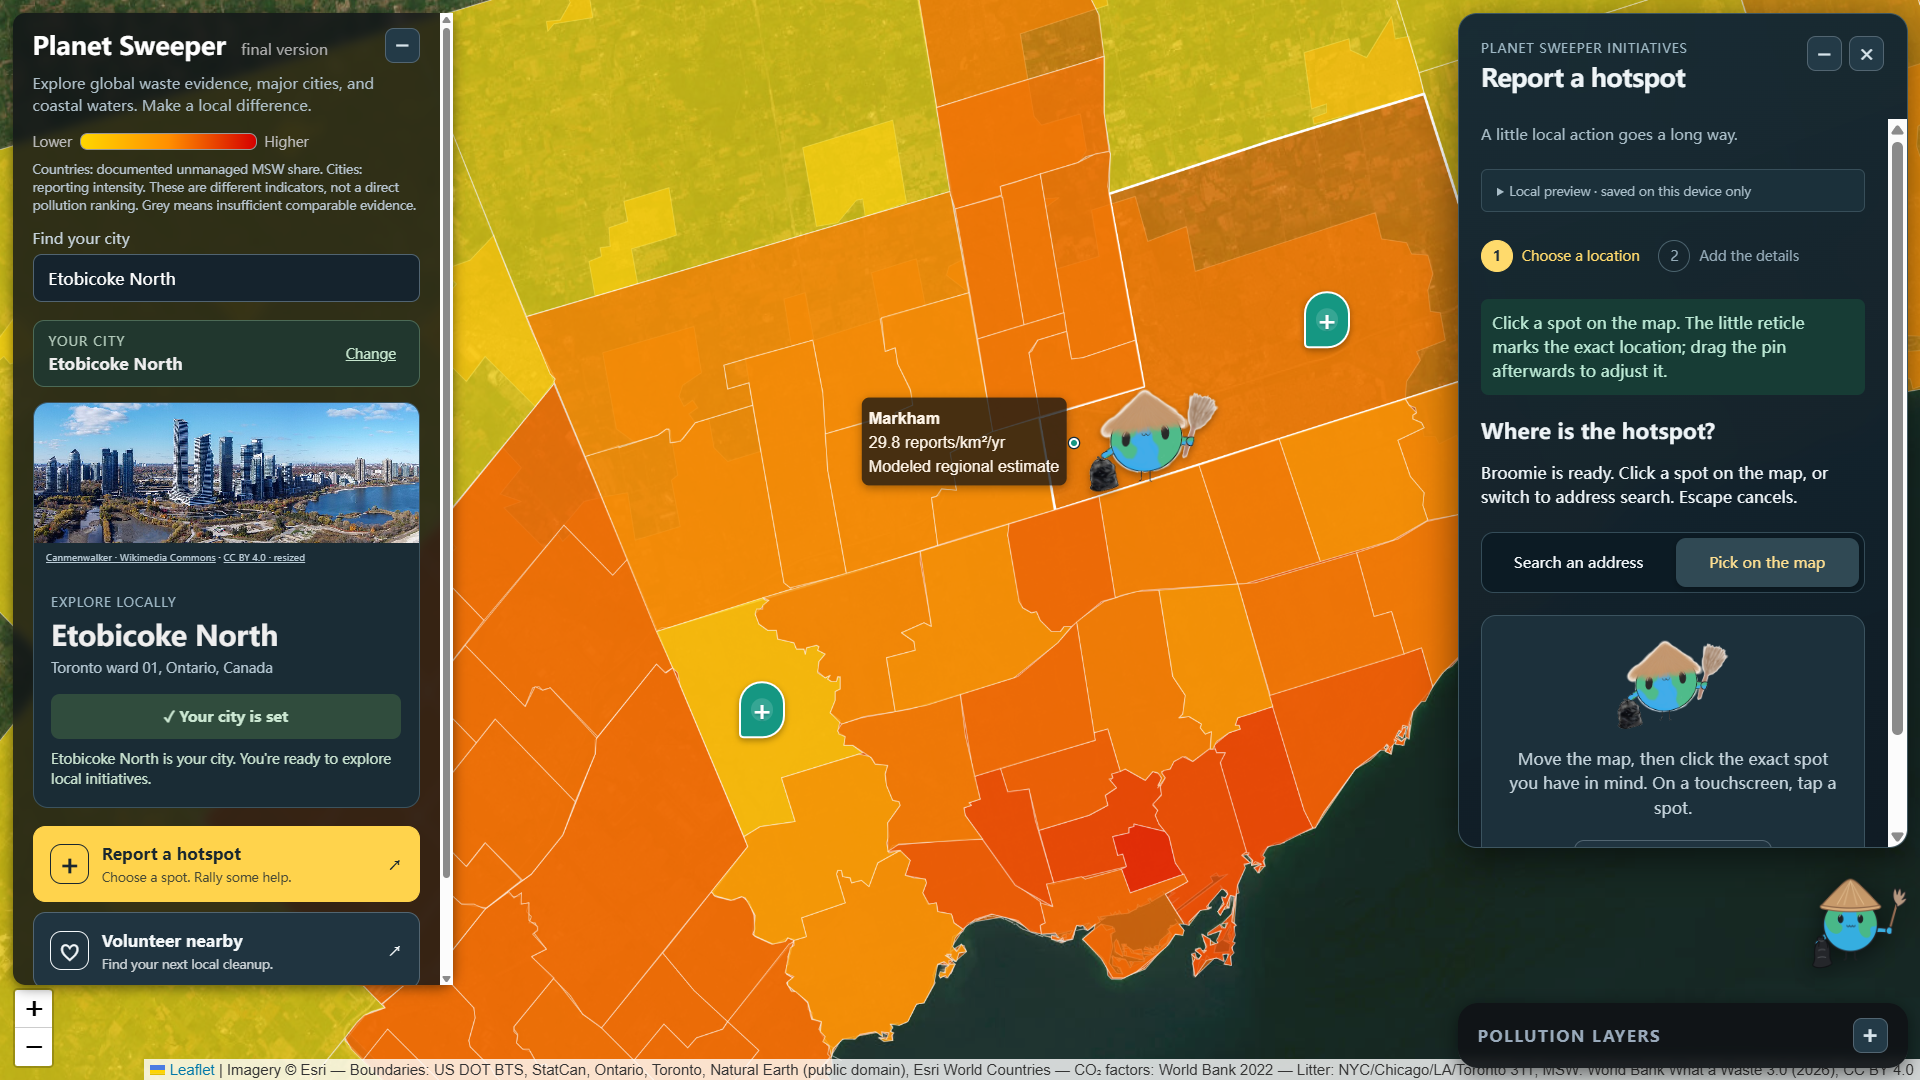
A look into our littering hotspot report system, our mascot Broomie pops up!
-
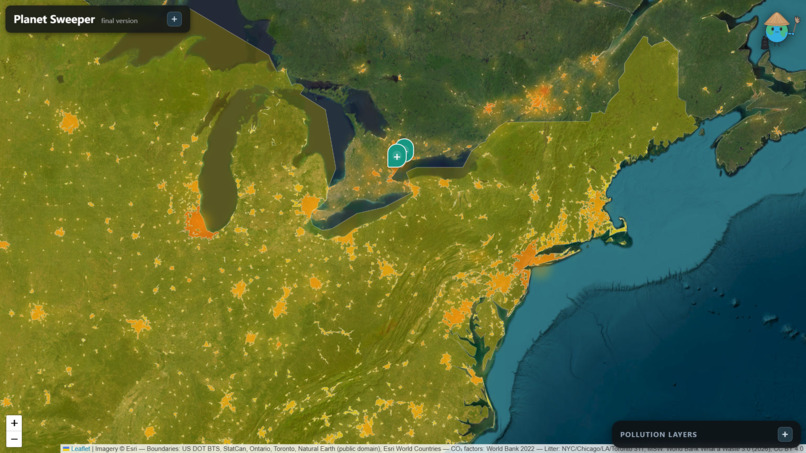
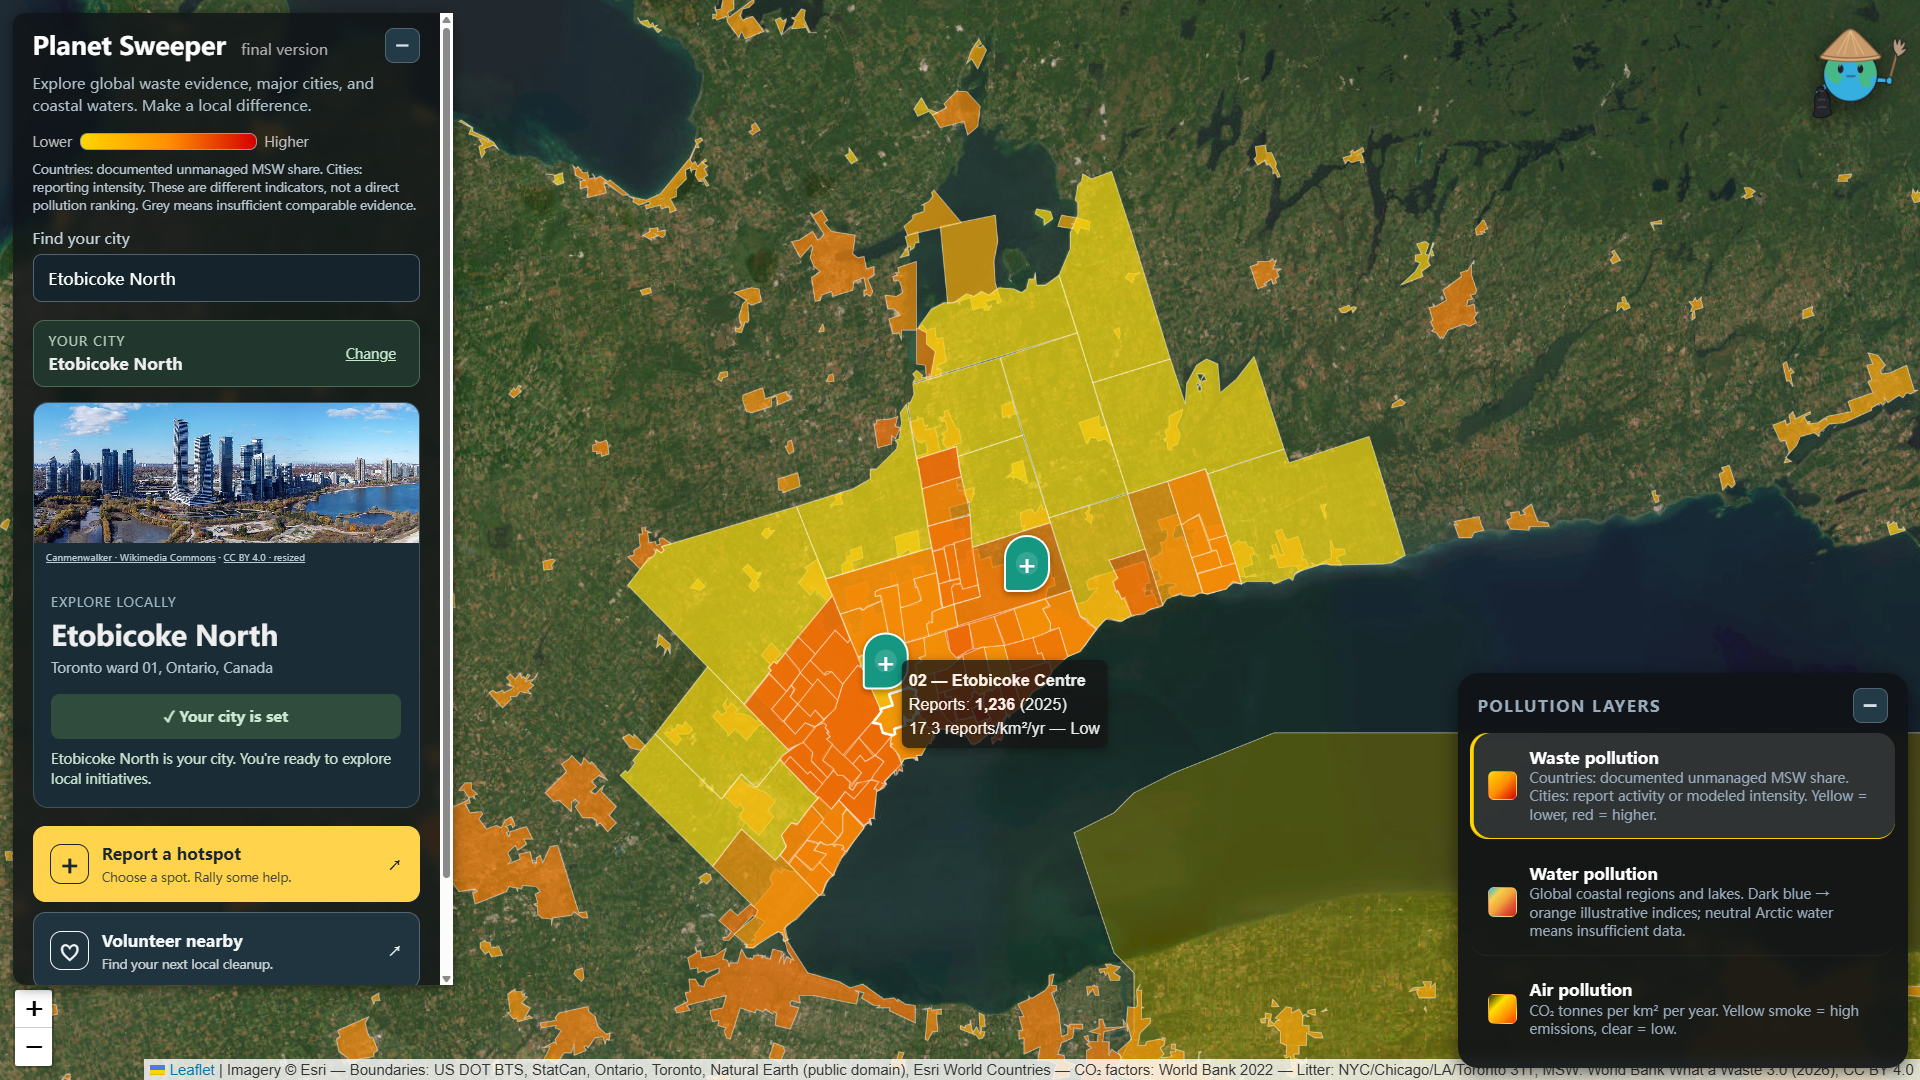
A zoom into the litter pollution map, each city has detailed statistics and researched data.
-
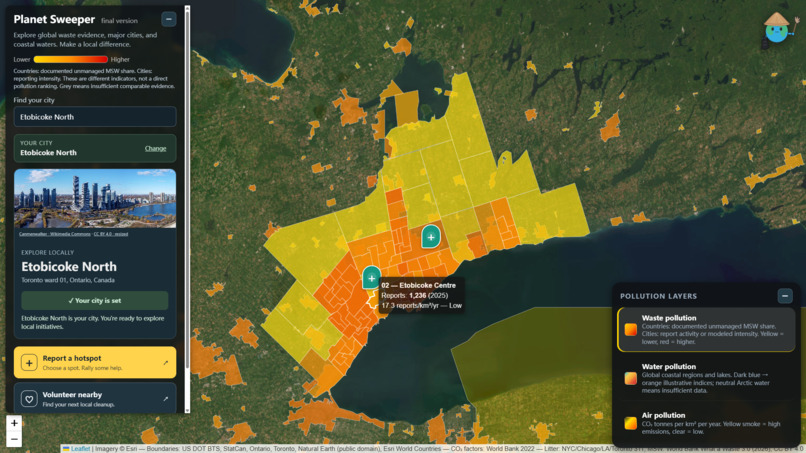
Each subdivision of the Greater Toronto Area has extensive detail for litter concentration.
-
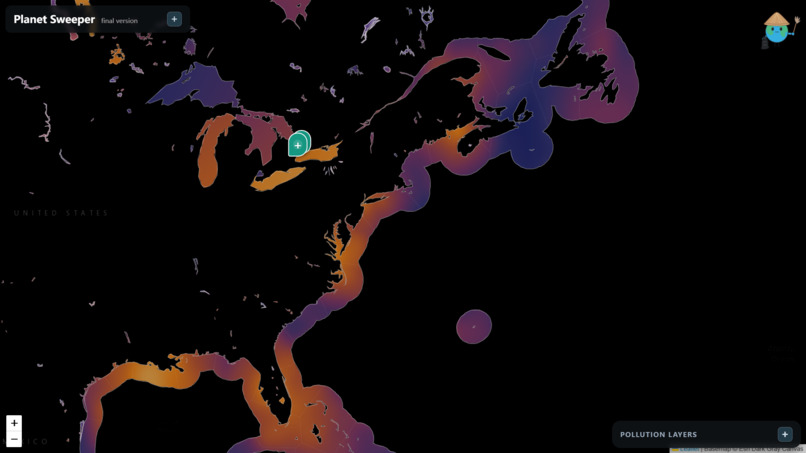
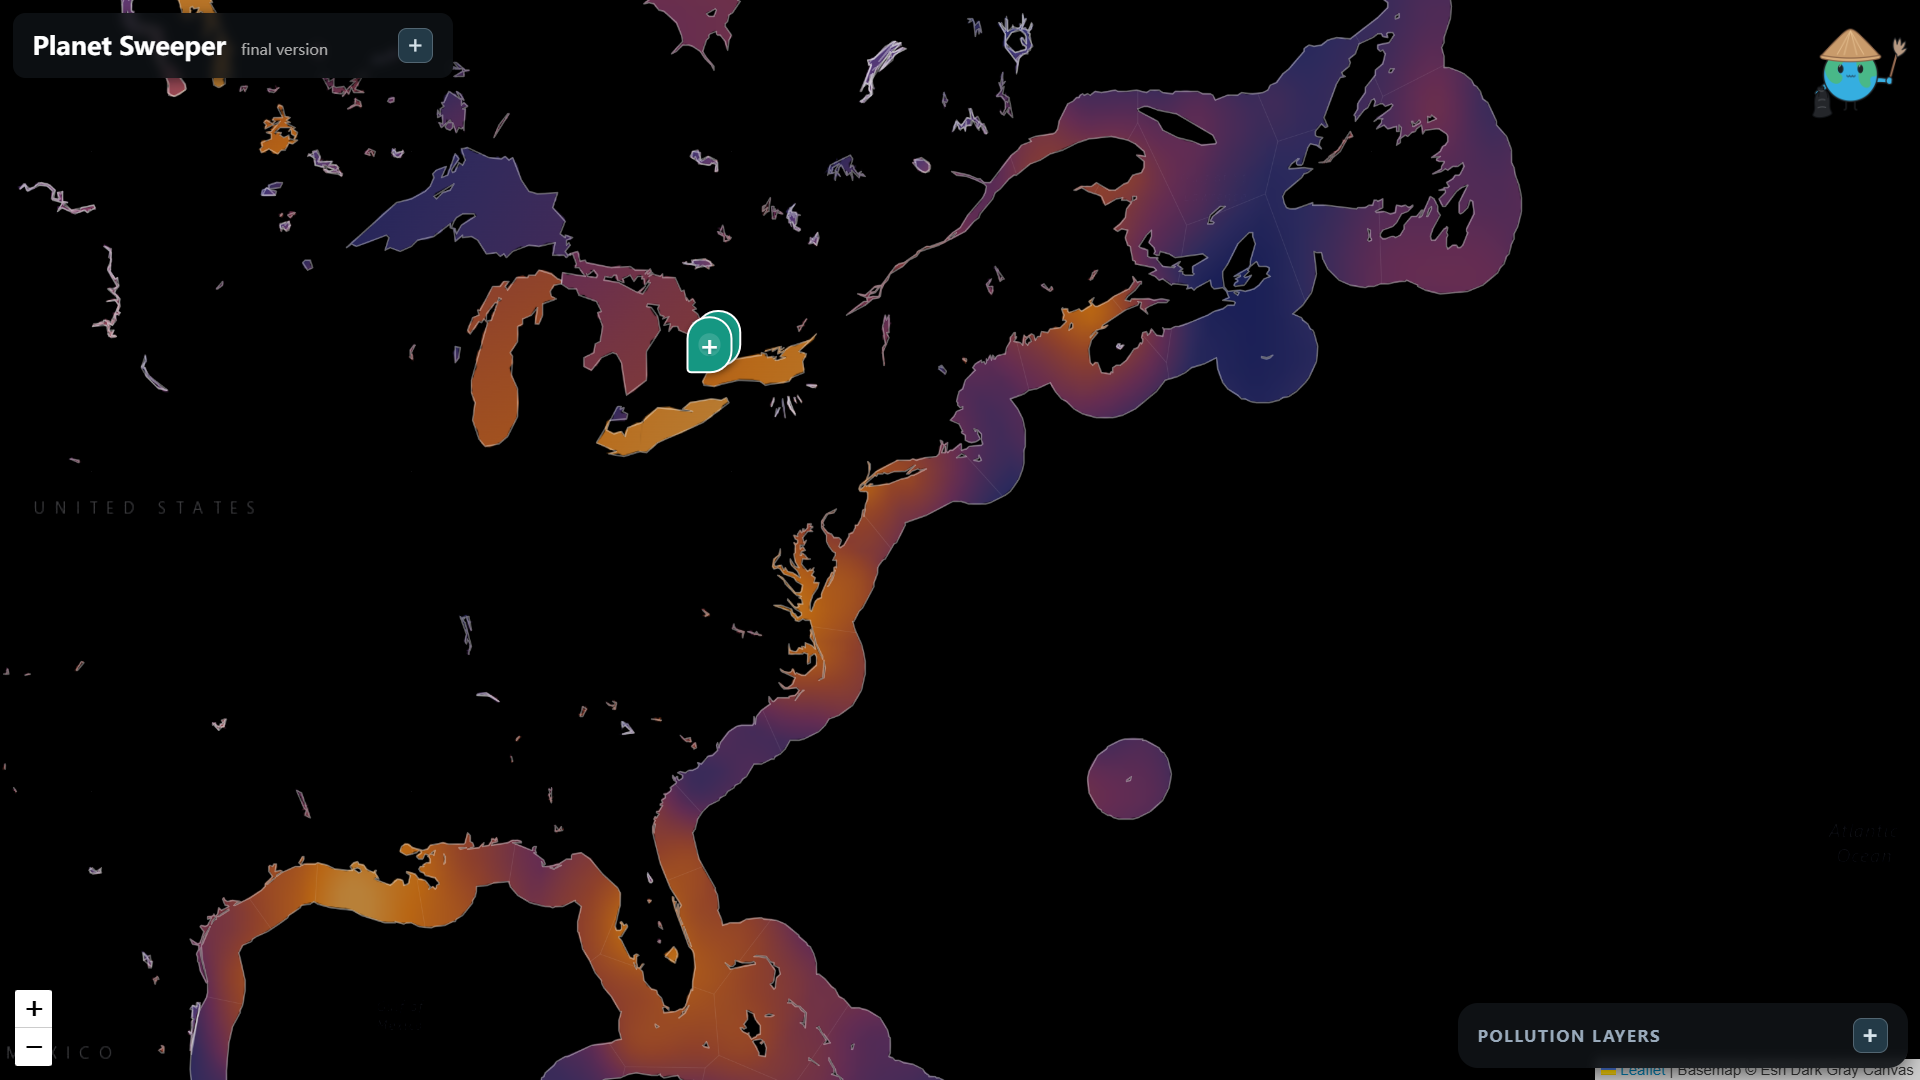
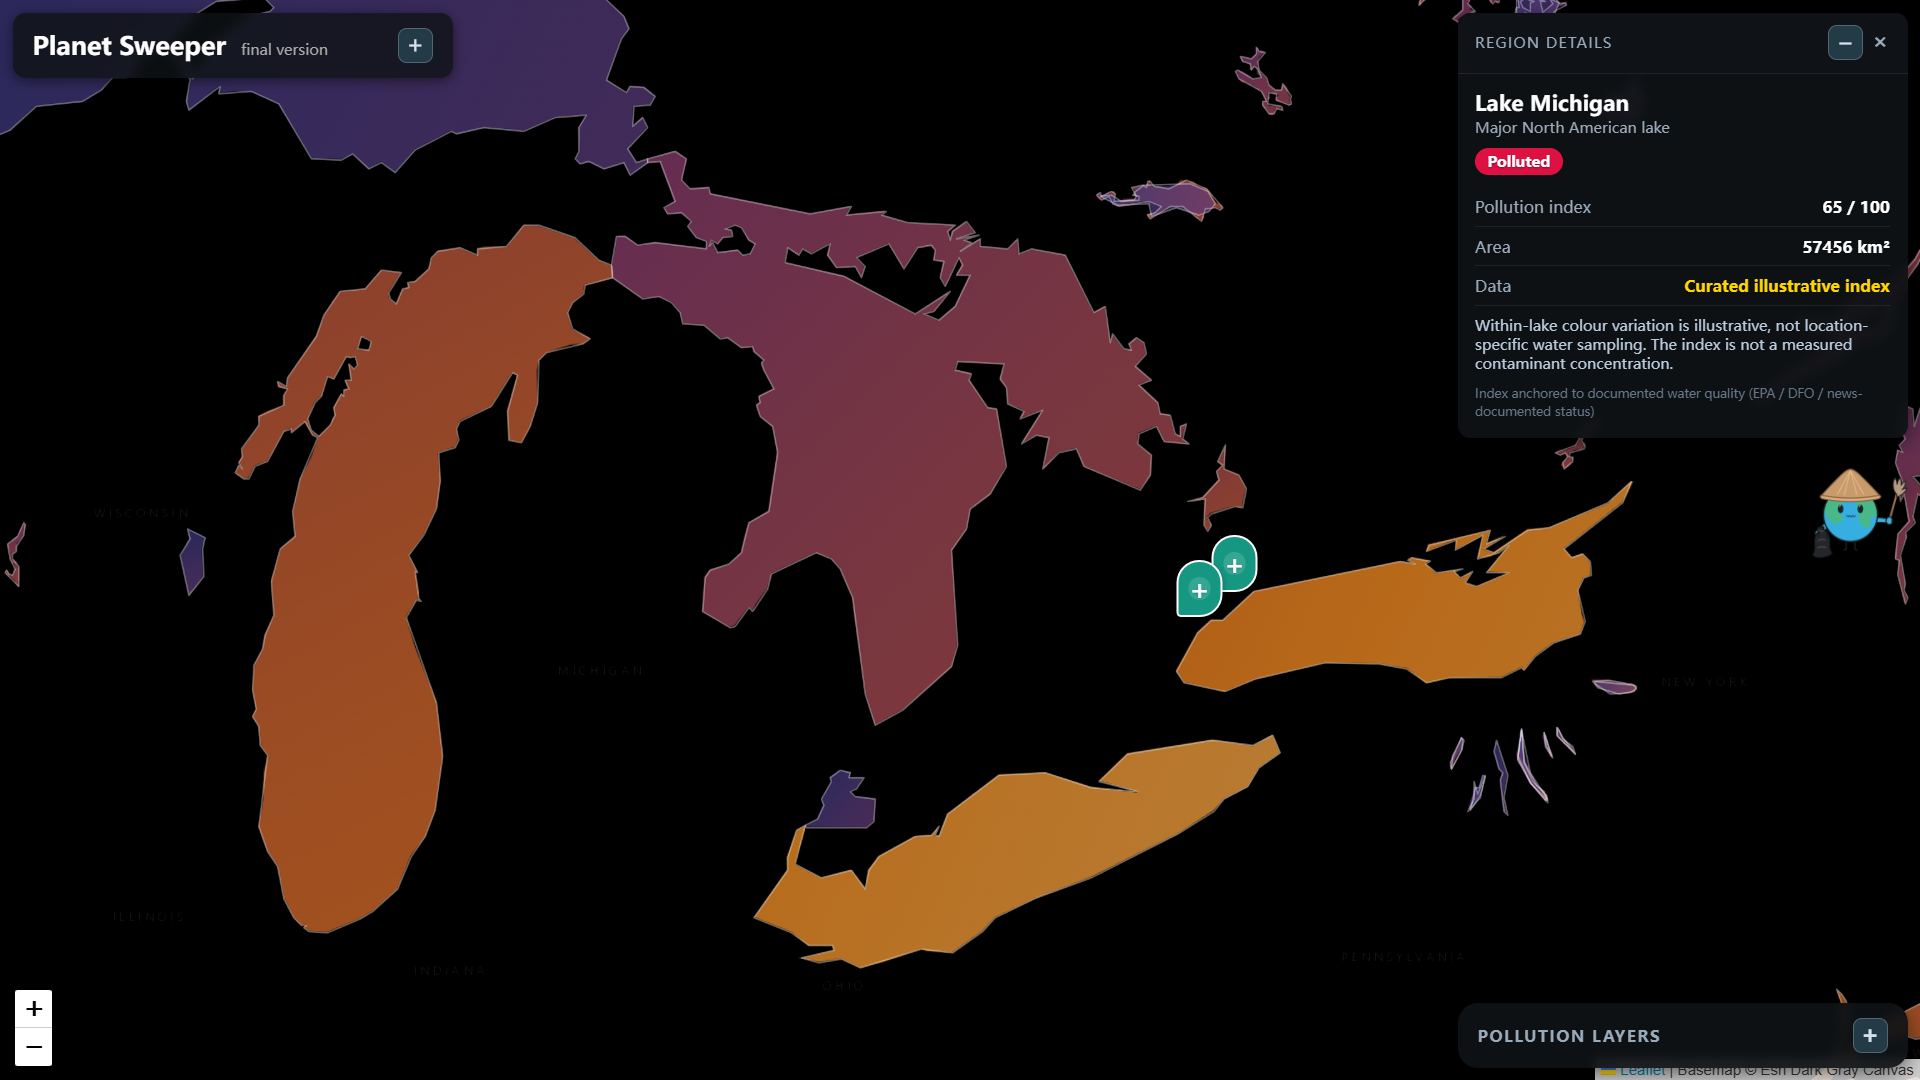
A zoom into our ocean and water pollution map, each area of the coast will have local data..
-
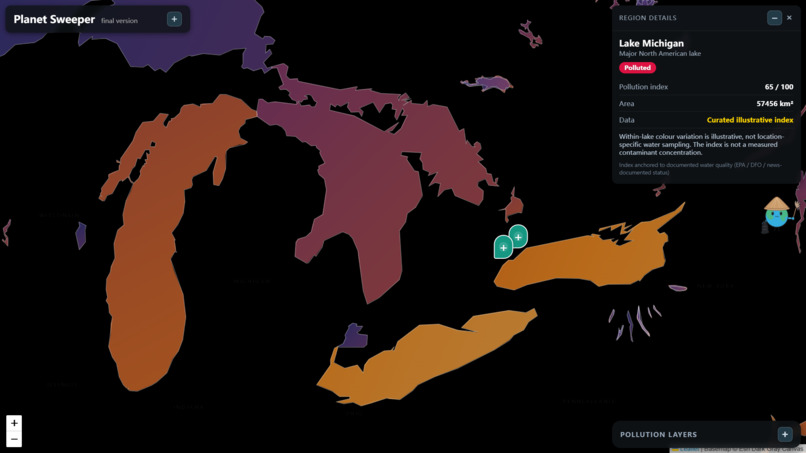
Water pollution map, zoomed into the Great Lakes.
-
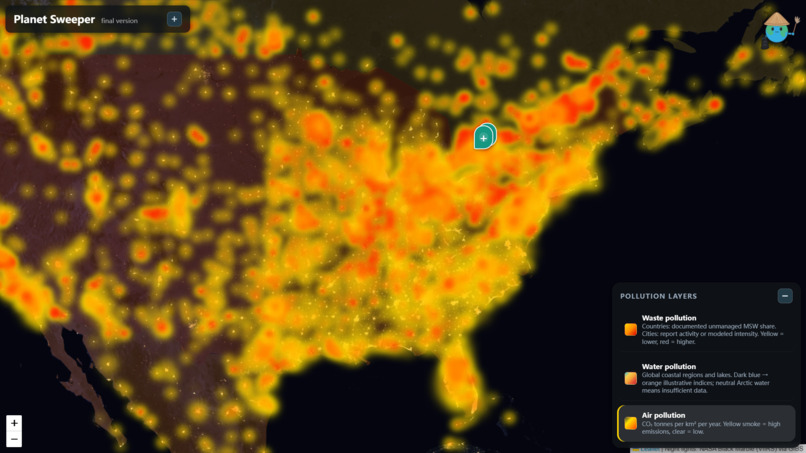
A zoom into the air pollution map.
Inspiration
We came up with the general idea for PlanetSweeper the night before Hack the Skies. We took inspiration from existing interactive GIS models such as BiomeAtlas and Google Earth. We wanted to integrate our unique mission and different features on top of the base maps. We noticed the substantial amount of trash around our home city, and we wanted to educate people about environmental sustainability through our maps. This culminated into our mission and thought processes behind PlanetSweeper.
What it does
PlanetSweeper is an interactive GIS-powered map and volunteering web app that combines visual models for environmental awareness and real-world action through volunteering opportunities. As mentioned, it has two main components:
1) Environmental education: We have interactive geographic visualizations of global waste production, waste pollution, air quality, and water pollution. This helps users explore environmental challenges and interesting statistics about affected regions.
2) Community-driven action: Users can report local litter hotspots, creating cleanup initiatives for other users to explore. You can share details and photos about your mission, find nearby opportunities, sign up to volunteer, and ultimately chat and coordinate efforts with other community members.
How we built it
We used examples from GIS satellite interactive maps, and connected google maps. We then used Opencode to push a version-1 to Github as an example, and so that we could design a nice template for the site. After version-1, we uploaded all of the international data, and expanded the map to the entire world. After finishing waste pollution, we moved on to water pollution, and finally, air pollution. After lots of tweaks and fine tuning, we finished the site including all features that we initially wanted to include.
Challenges we ran into
One of our biggest challenges was finding, evaluating, and organizing reliable environmental datasets from different regions of the world. Our group member Vincent single-handedly found governmental sources for most countries in the world, regions, and bodies of water. We solved the datasets that were missing or non-existent by using placeholders, showing that the region has "insufficient information" and marking it gray on the map. Another challenge we ran into was on the day of our pitches, as the presentation format was changed from 10 minutes to a 5 minute pitch, this time constraint forced us to re-evaluate what we had to keep and prioritize key points and really understand our mission.
Accomplishments that we're proud of
We faced many challenges during development, and overcoming them was one of our proudest accomplishments. We’re especially proud that we made the interactive map work seamlessly with the data, which had been one of our main concerns from the start. We're also proud of the overall look and cleanliness of our geographic models, as we spent a lot of time to make sure it is easily accessible for users and detailed.
What we learned
We learned that planning, brainstorming, and creating a final product is not always a smooth and easy process. Many times, there are obstacles that we must overcome. We learned that the point of development is not to get a perfect creation first try, but to work at the issues, solving them one-by-one, and eventually learning from previous mistakes to create a product that fits into our goal. Splitting up the different tasks to our different expertises was a great direction, as it allowed us to cohesively put together a convincing presentation. Marco and Justin worked on the backend, Vincent worked on the data collection and research, while Natalie helped us put everything together in presentations, demos, and pitches.
What's next for PlanetSweeper?
The PlanetSweeper map model is completely functional and filled with data, but we can add sections of our web app for specific education and provide resources for overviews about detailed environmental education. The volunteering aspect, although completely functional, does not have databases to store these requests. The chats are also local, but a paid databse would be sufficient to satisfy PlanetSweeper's future needs. PlanetSweeper will be funded by environmental NGOs across Canada; the resources, outreach, and cost will be provided by them and drive our sustainable mission. We believe PlanetSweeper can sweep its way around the world, inspiring communities to collaborate, organize, and create actual environmental change.
Built With
- css
- esri
- github
- glm
- html
- javascript
- opencode
- typescript

Log in or sign up for Devpost to join the conversation.