-
-
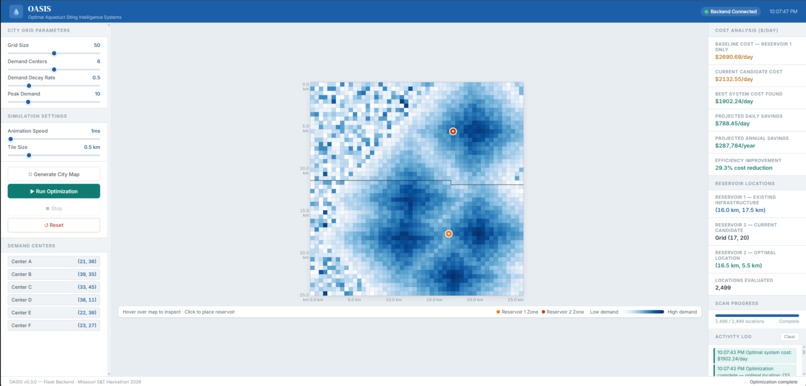
OASIS in action

Inspiration
The biggest inspiration for this project was definitely the wild success of scalable networks of municipal water transportation. Since municipal water manipulation is one of the most important parts of a city, as we all need varying amounts of water to complete our day to day tasks, we wanted to give a stab at doing the calculations ourselves and see if what we result in shows any resemblance of a real solution.
What OASIS does
OASIS uses a heatmap to visualize the differing levels of demand for water within a city. Using some user defined city parameters, we algorithmically find the most optimal position to place a second reservoir within the city to save the water company some money. Water companies don't get to move water around for free, so being able to calculate a strategic position to place a second reservoir that can save a decent percentage of money was our main goal.
How we built it
Almost all of the backend was written, by hand, using Python. We had a little bit of help from Claude Sonnet 4.6 for connecting our Frontend to Backend with Flask. Claude then also supported us with a Frontend written in HTML, as our entire team really enjoys the backend of programming, and didn't have the experience necessary to get a good looking Frontend done in 36 hours.
Challenges we ran into
Our group collectively agree that the hardest part of this project wasn't even the programming--It was the math. The amount of math that went into figuring out a cost formula with demand and distance from reservoirs amongst other things, was a crazy undertaking that we weren't super prepared for. We also had a minor hiccup with version control but that was resolved rather quickly. An idea was proposed to us to allow for a Google Maps-like implementation, but that was sadly out of our skill range, and without a wide source of real world accessible data, we were not sure it would even be accurate.
Accomplishments that we're proud of
We managed to get pretty reasonable results, even though we were not able to compare to real world data. We are decently confident that our calculations and defined constants led our algorithm to a mostly correct answer. We are aware the algorithm isn't the most rapid with it's solution, but its fun to watch the animation. We also partitioned the city map using a Voronoi Partition, which allowed us to see which tiles are being service by which Reservoir. All in all, the code functions, and that's enough to make us happy.
What we learned
We learned that the effort it takes to accurately plan a cities' water supply takes an immense amount of work. We wish that we had a little more time to do more in-depth research on real data to ensure the numbers we were getting are in-fact accurate. We also learned what a Voronoi Partition is.
What's next for Project OASIS
There is always the chance a real world data implementation for OASIS is the next step. Other than that, the team is satisfied with how this project went, especially in the sprint of time we had. We may move on to more projects.


Log in or sign up for Devpost to join the conversation.