Inspiration
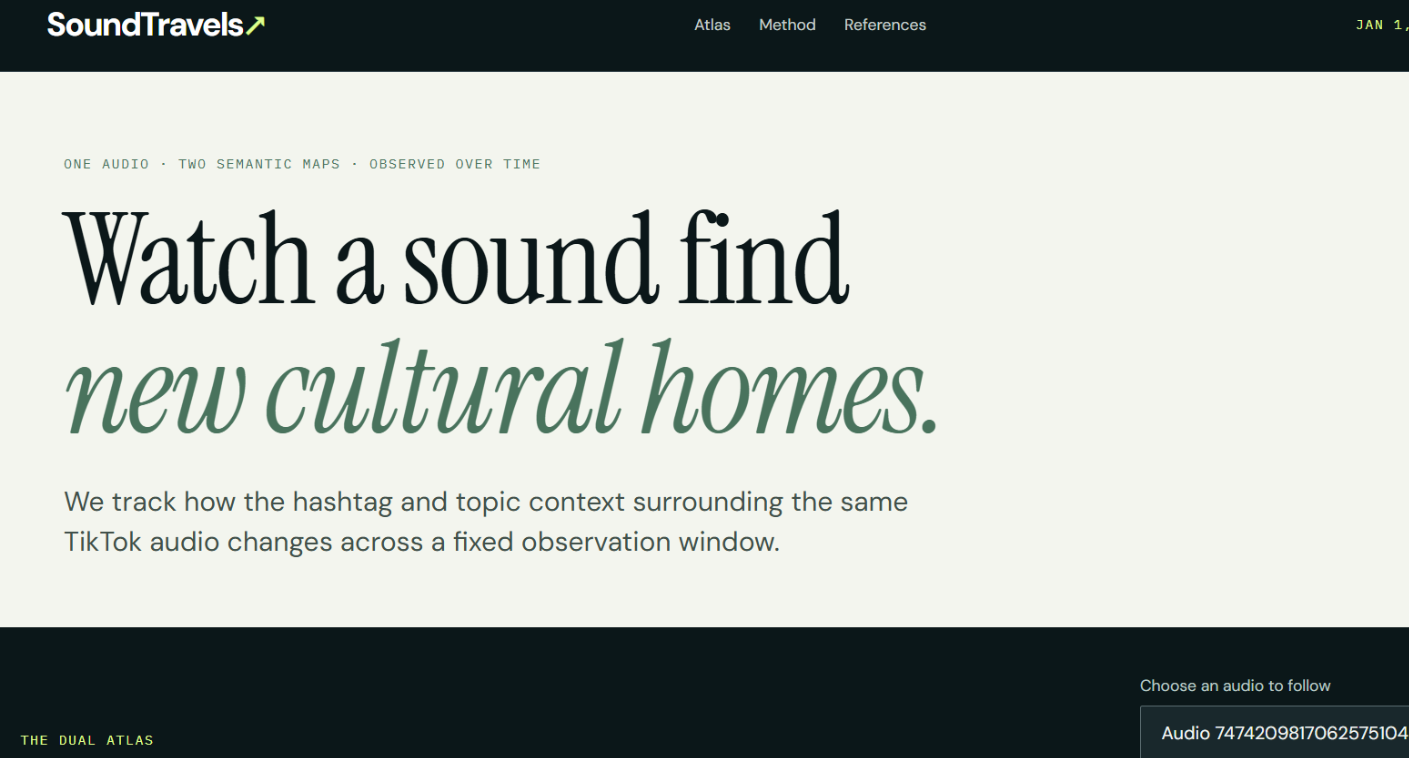
By design, TikTok is an audio-first platform. Persistent UI elements prioritize showing every TikTok user background tracks, sound creators, and community usage, making sound a key engine for content discovery. We wanted to investigate how trends propagate through this ecosystem by exploring two core questions:
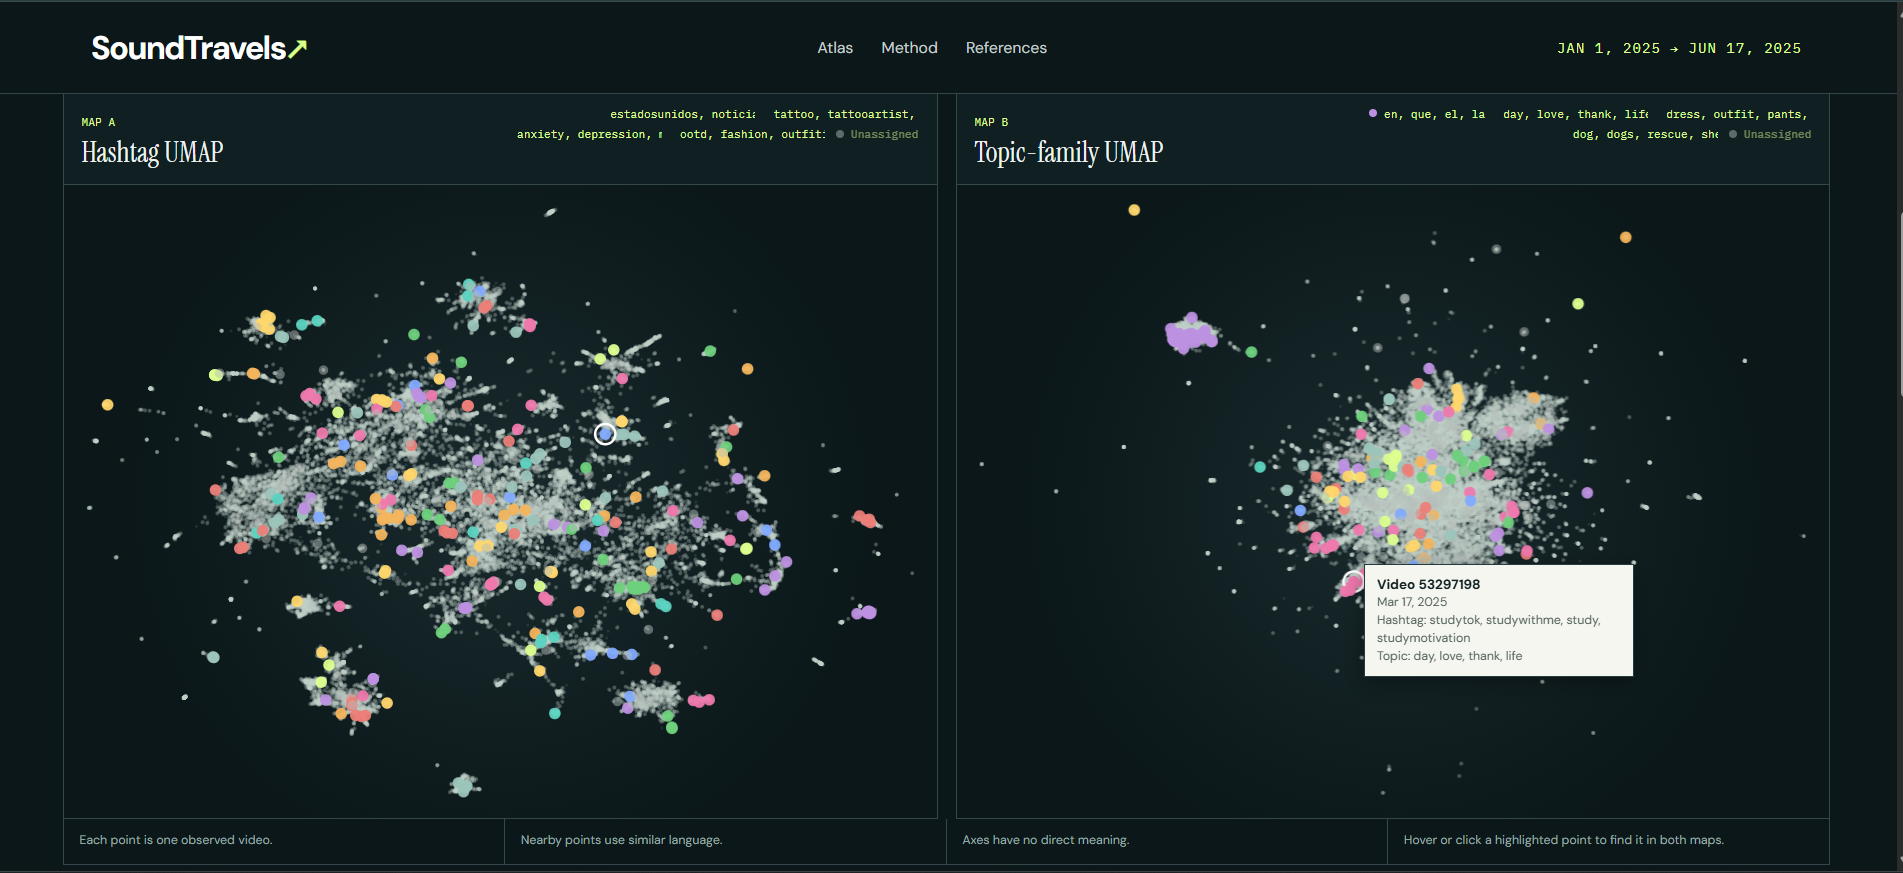
- Cross-Topic Diffusion: How do audio tracks migrate across different TikTok subcultures, topics, and creator communities over time? Do audio tracks show presence differently in different topics?
What It Does
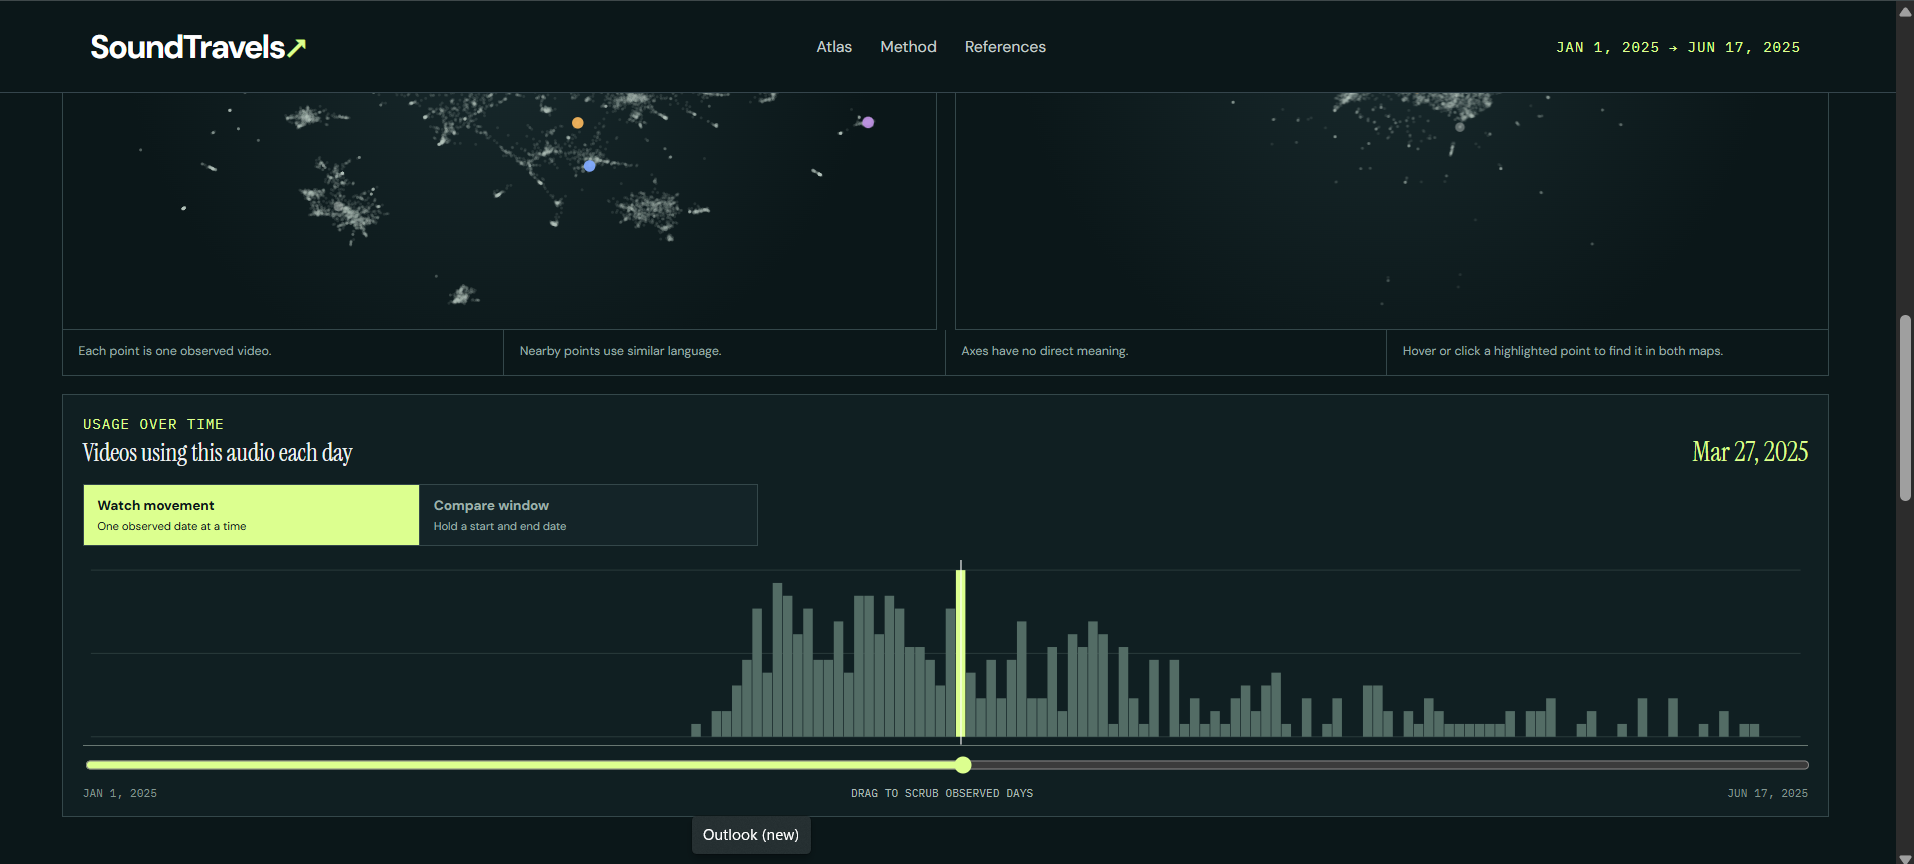
SoundTravels is an interactive visual analytics engine that tracks, models, and visualizes the lifecycle of TikTok audio trends. The platform maps audio usage against view performance over time, allowing creators, marketers, and researchers to pinpoint engagement windows, observe hierarchical bursts, and quantify when a sound transitions between growth and decay phases across different platform niches.
How We Built It
We engineered an end-to-end data processing pipeline and visualization interface leveraging custom data analytics and statistical modeling techniques:
- Data Pipeline & Processing: Ingested and structured multi-dimensional platform telemetry (time-series view counts, video posting timestamps, audio metadata, and topic tags).
- Exploratory Data Analysis: Tested and verified against multiple hypotheses, including modality of audio lifespan, engagement vs creation shares, burst patterns.
- Interactive Visualization: Built custom time-series distribution graphs, scatter plots, and cluster summary dashboards to let users visually compare creation volume versus view velocity.
Challenges We Ran Into
Our biggest hurdle was navigating the balance between exploratory data analysis (EDA) and problem definition. Working with raw, high-dimensional, super complex social media data revealed lots of messy behaviours and potential exploration paths. It was easy to get lost theorizing edge cases in creator behavior rather than refining our primary analytical scope. To overcome this, we stepped back from the raw visualization outputs to strictly frame our core analysis goals and ensuring our tool delivered within our defined scope rather than pull focus to noisy charts that are interesting but don't provide value.
Accomplishments That We're Proud Of
Topic Modeling Framework: Built a flexible classification architecture capable of capturing semantic shifts and mapping how audio trends migrate across distinct content domains over time.
Proposed Audio Lifespan to Topic Correlation Methodology: Formulated a novel analytical framework to evaluate the underlying relationship between creation bursts and view accumulation, laying the groundwork for identifying leading indicators of trend lifespan, virality, and longevity across topics.
What We Learned
- Data Science & Signal Processing: Deepened our expertise in data manipulation, time-series normalization, burst detection modeling, sentiment analysis, topic modeling, and statistical clustering.
- Product Strategy & Scope Control: Learned how to navigate open-ended data exploration, translate open-ended research questions into rigid technical requirements, and build visual abstractions that solve a well-defined analytical problem under a tight timeline.
What's Next
- Expand dataset scope Due to time and compute limitations evaluated during the 36-hour time window of this hackathon, we hope to be able to look at significantly more complete data using our methodology to further verify our findings.
- Inspecting audio lifespan metrics within topic specific matrix: We're curious if different topics/communities have different patterns of lifespan decay.
- Automated Niche Migration Mapping: Expand upon community classification/clustering to show how audio tracks hop between specific high community signal topics (e.g., #BookTok, #TechTok). Large differences were observed between user-curated (hashtags) and open-ended (descriptions) for topic identification and mapping, so we're curious how this can work.

Log in or sign up for Devpost to join the conversation.