Inspiration
In the current landscape, it is very important for us to continuously engage with our customers and understand them. Analysis of the customer data leads waste of a lot of time and this can be detrimental to the companies profits. To tackle this problem this solution was created.
What it does
Uses ML along with the built-in report functions of QB apps ,using pipelines, to extract important data and present it in an easy to digest format. It also makes searching through the records much easier with a visual interface.
How I built it
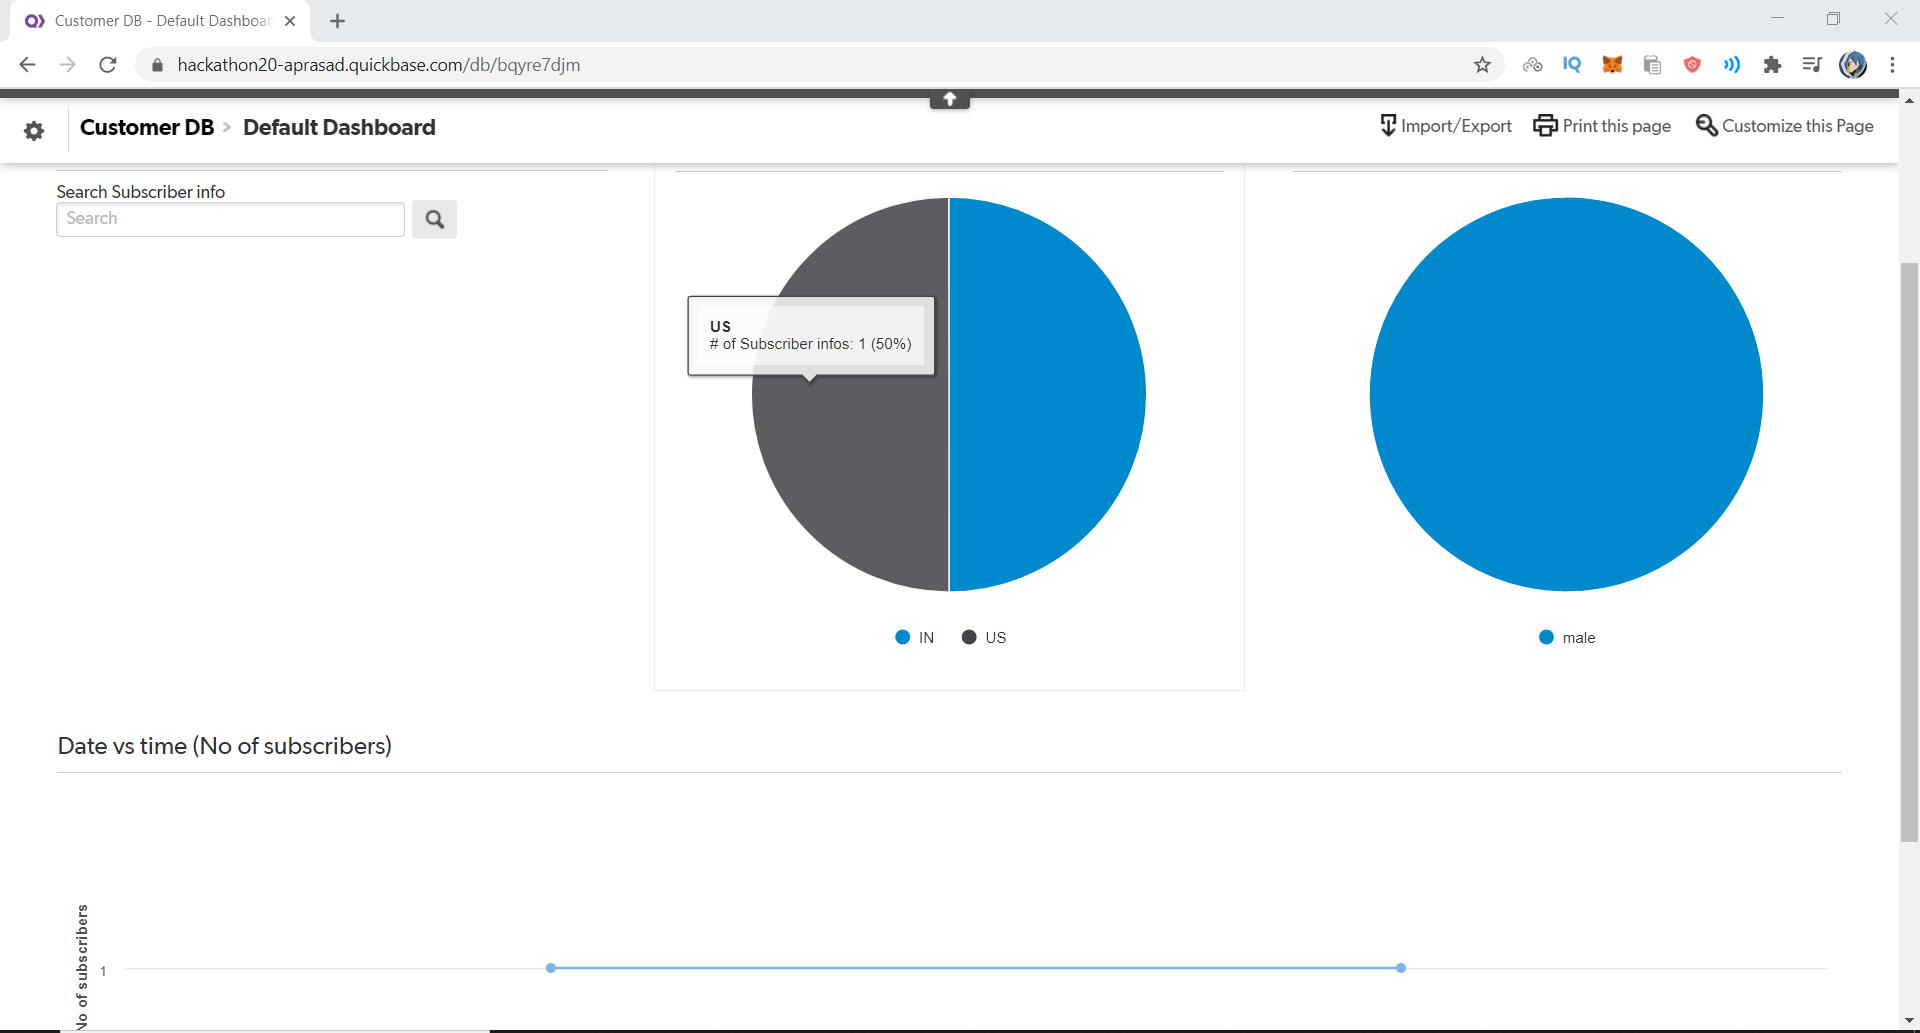
Connects a QB app with a mailchimp campaign, and whenever a user subscribes it calls a pipeline and uses machine learning on its name to determine gender of the customer. All the information immediately gets inserted as a new record in the customer DB, and it uses the in-built record functionality to view all the information in an easy-to-digest format. It gives us a pie chart for gender, a pie chart for location and a graph which tells us the number of customers who subscribed or unsubscribed on any given day. When the user unsubscribes , the subscription status of the user changes and the data is changed in real-time in the reports of the QB app.
Challenges I ran into
Understanding how to use quickbase
Accomplishments that I'm proud of
Finishing the project solo
What I learned
Quickbase
What's next for Mailchimp Quickbase integration
Controlling the mailchimp campaign spontaneously using nothing but the reports produced by quickbase.

Log in or sign up for Devpost to join the conversation.