Inspiration
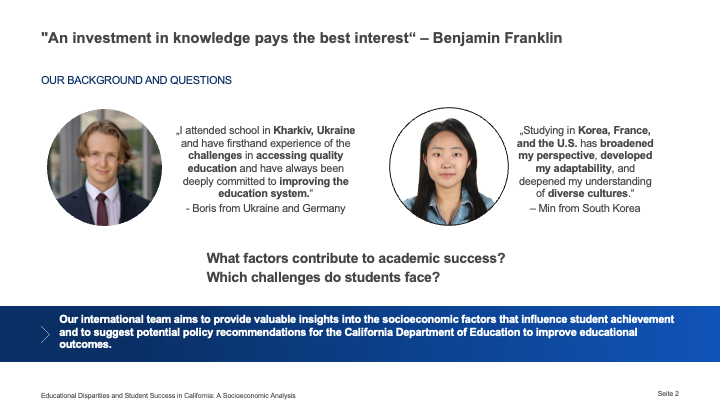
We were inspired by the need to address equity and performance in California’s public education system through data-driven insights, aiming to support stakeholders like the California Department of Education.
What it does
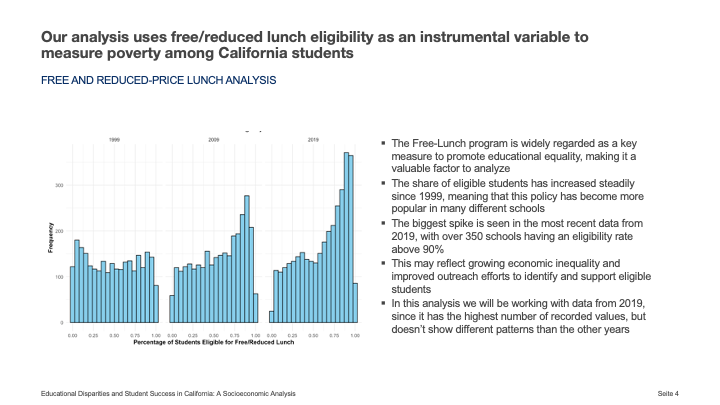
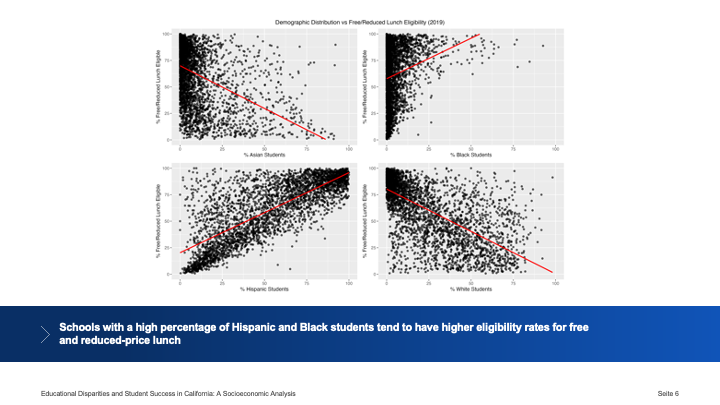
The project analyzes public education in California, examining student demographics, socioeconomic conditions, school characteristics, and graduation outcomes using multiple datasets to identify disparities and inform policy.
How we built it
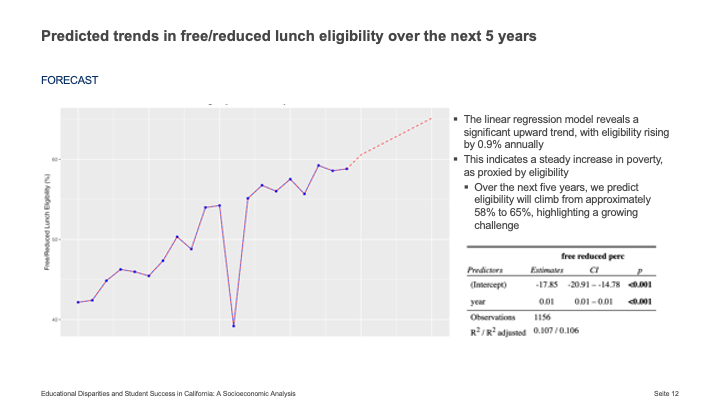
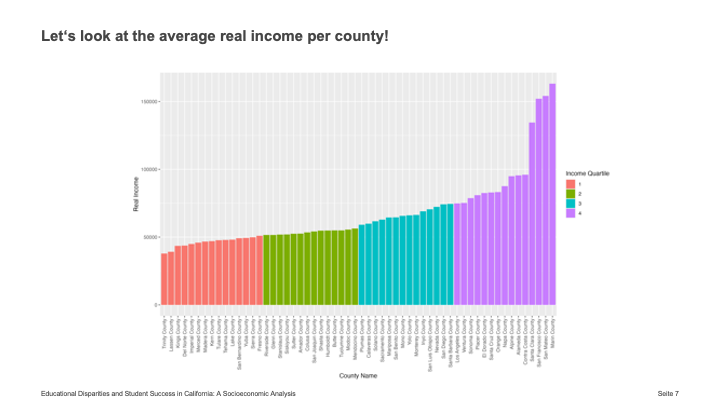
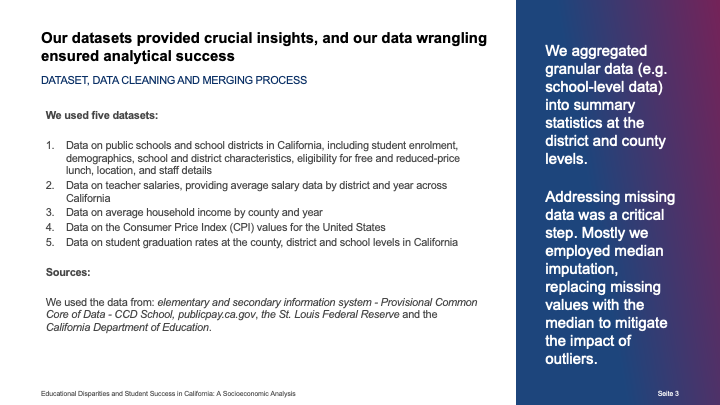
We integrated school, district, teacher salary, income, and CPI datasets, cleaned and merged them, calculated weighted averages, and used visualizations (e.g., LOESS trend lines) to highlight trends and relationships.
Challenges we ran into
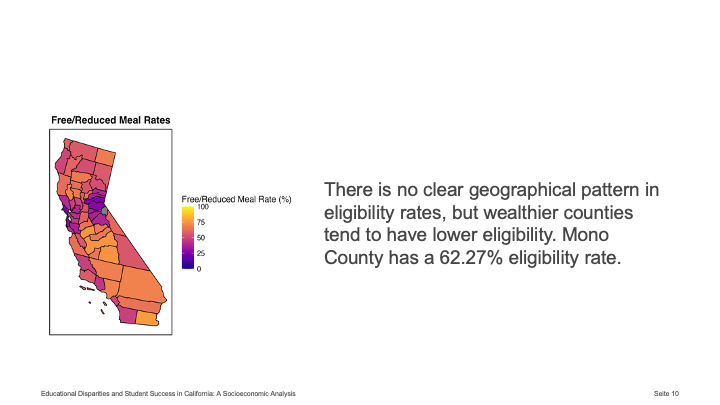
We faced issues with missing data (e.g., Alpine County), systematic measurement errors (e.g., 2011 lunch eligibility drop), and ensuring accuracy without introducing bias from imputed values.
Accomplishments that we're proud of
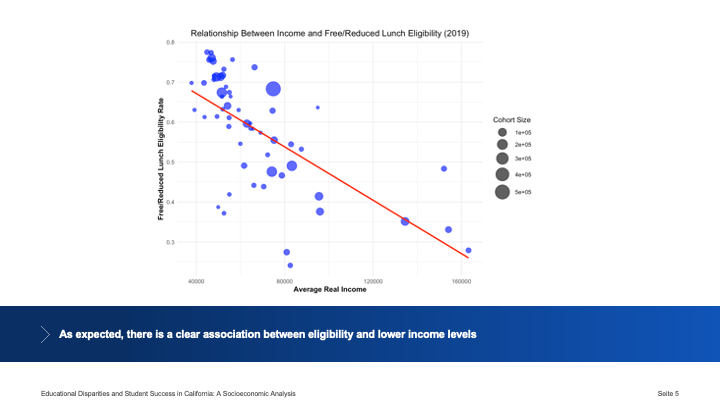
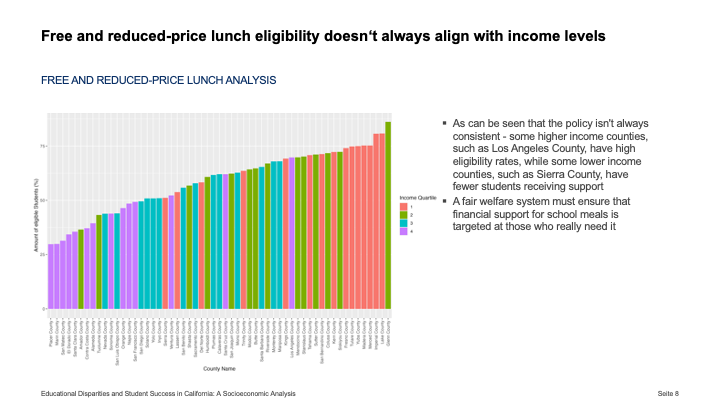
We’re proud of creating a robust analysis linking income, free/reduced lunch eligibility, and graduation rates, providing actionable insights for targeting low-income areas.
What we learned
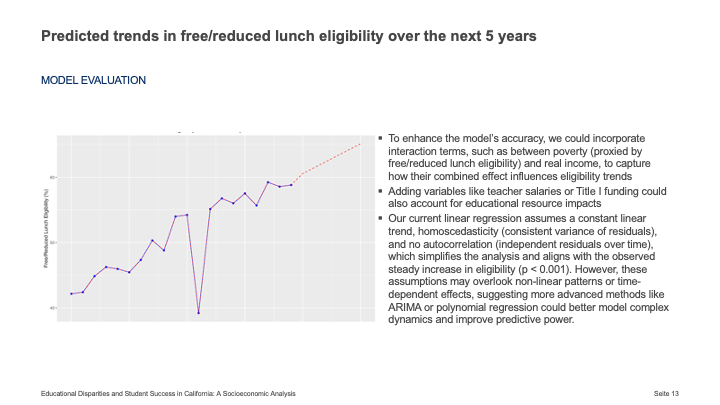
We learned the importance of socioeconomic factors in education, the complexity of data cleaning, and the value of trend analysis in mitigating outliers.
What's next for Project Educational Disparities: A Socioeconomic Analysis
Future steps include refining data collection, expanding to other regions or states, and developing specific policy recommendations to reduce disparities.


Log in or sign up for Devpost to join the conversation.