Project IRIS: Investment Risk Index for Sub-sovereign Assets
🚀 Live Demo
Explore the interactive IRIS Risk Index dashboard, now deployed on Streamlit Cloud:
➡️ Access the Live Application Here
https://project-iris-i5kzacnumt2dtusmiiqbkx.streamlit.app/
1. Executive Summary
Project IRIS is a proprietary risk scoring model designed to assess the viability of public infrastructure investments at the municipal level in Peru. By innovatively fusing public works execution data (INFOBRAS) with public health statistics (SINADEF) as a proxy for social and institutional stability, IRIS provides a deeper, more predictive view of risk than traditional financial models.
This repository contains the end-to-end data pipeline, feature engineering, and the source code for a fully functional, interactive web application.
Tech Stack: Python, Pandas, Scikit-learn, Plotly, PyDeck, Shapely, Streamlit.
Keywords: FinTech, Quantitative Analysis, Risk Modeling, Data Science, Machine Learning, Alternative Data, Data Visualization.
2. Project Goal
The objective is to develop and validate a data product that can provide investors, insurance companies, and development banks with an objective, data-driven score to quantify non-financial investment risk, ultimately leading to more efficient capital allocation and greater social impact.
3. Project Status: Version 1.0 (Completed & Validated)
This project was executed in four sprints, culminating in a fully functional and validated v1.0 data product.
- [Sprint 1: Data Foundation]: Ingestion and certification of public works and health datasets. (Completed ✅)
- [Sprint 2: Feature Engineering]: Development of G-Factors and S-Factors. (Completed ✅)
- [Sprint 3: Dashboard MVP]: Deployment of the interactive Streamlit application. (Completed ✅)
- [Sprint 4: Descriptive Validation]: Rigorous backtesting confirmed the index's predictive power, showing districts with high IRIS scores historically had significantly higher project failure rates. (Completed ✅)
Future Work: The next phase (v2.0) will involve integrating new economic variables to build a predictive machine learning model.
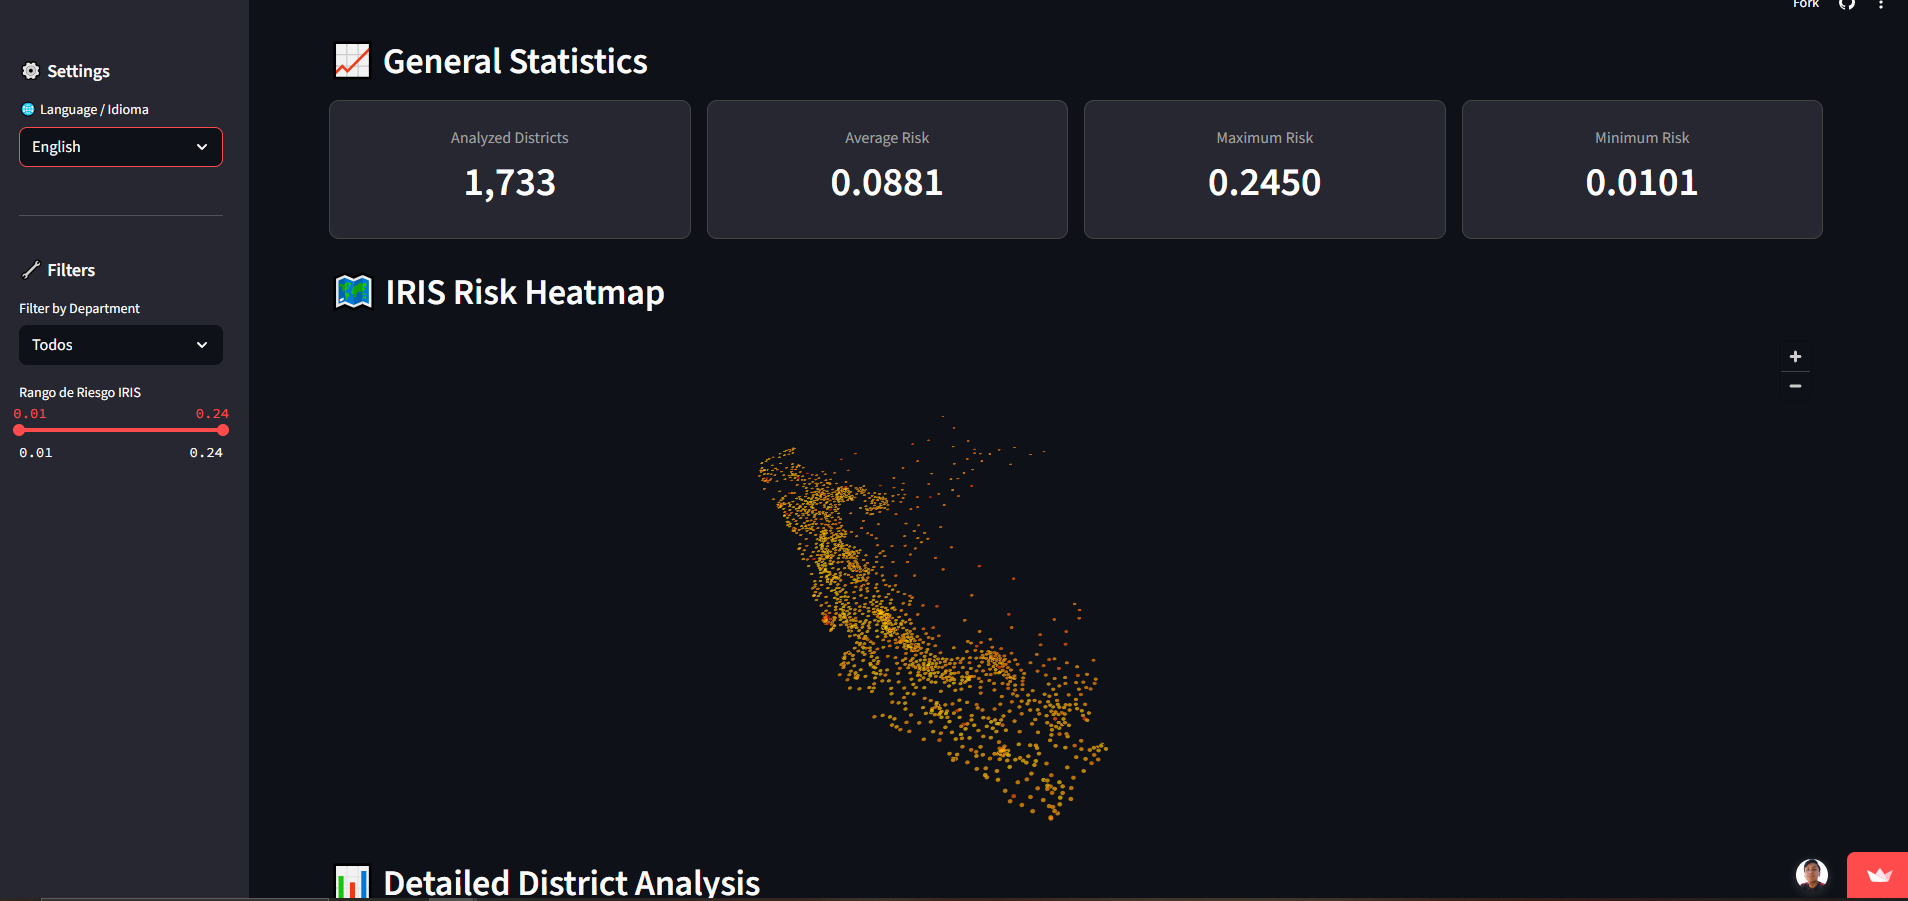
4. The IRIS Dashboard
The project culminates in a multilingual, interactive dashboard built with Streamlit and deployed on the cloud.
Key Features:
- Interactive Risk Map: An intuitive heatmap of Peru, built with PyDeck, visualizing the IRIS score for over 1,700 districts.
- Dynamic Filtering: Users can filter the data in real-time by department and risk score range using sidebar controls.
- In-Depth District Analysis: A "District Profile" section allows users to select any district and view a detailed breakdown of its risk components through metrics and radar charts.
- Comparative Analysis: Users can compare a selected district's risk profile against the national average or any other district.
5. Data Pipeline & Sources
The core of this project is the fusion of two disparate public datasets. The entire process of data ingestion, cleaning, auditing, curation, and fusion is documented in the notebooks within the /notebooks directory.
Data Sources
INFOBRAS - Public Works (
infobras_certified_v1.csv):- Source: National Open Data Portal of Peru (Comptroller General's Office).
- Process: A rigorous 8-step pipeline was implemented to clean, audit, and curate over 180,000 raw records, removing more than 48,000 illogical or inconsistent entries.
SINADEF - National Death Registry (
sinadef_certified_v1.csv):- Source: National Open Data Portal of Peru (Ministry of Health).
- Process: A pipeline was developed to clean, standardize, and aggregate over 1 million individual records to the district level (
ubigeo), applying plausibility filters to ensure data quality.
Fusion & Feature Engineering
The certified datasets were merged to create a master dataset. From this, G-Factors (e.g., cost overrun ratio, paralysis rate) and S-Factors (e.g., average age of death) were engineered. These factors were then normalized and weighted to compute the final IRIS Score for each district, resulting in the iris_scores_for_dashboard.csv file that powers the application.
6. How to Use
Running the Application Locally
- Clone the repository:
bash git clone https://github.com/jhonwilber123/project-iris.git cd project-iris - Create and activate the virtual environment:
bash python -m venv iris_env source iris_env/bin/activate # On Windows: .\iris_env\Scripts\activate - Install the required dependencies:
bash pip install -r requirements.txt - Run the Streamlit application:
bash
streamlit run app/app.py


Log in or sign up for Devpost to join the conversation.