-
-
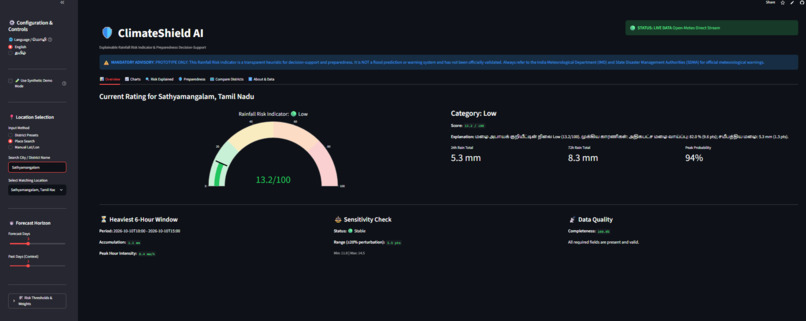
Dark Theme Screenshot 1
-
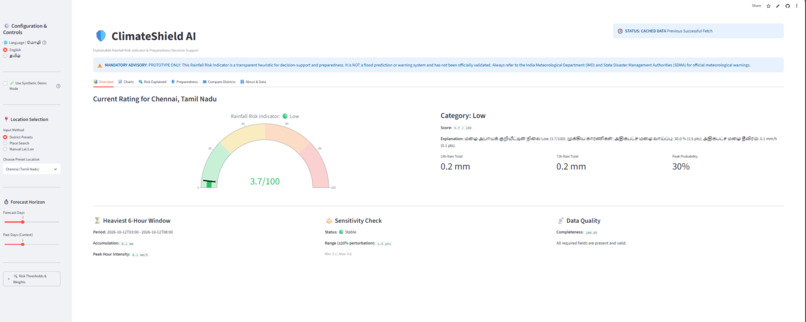
Light Theme Screenshot 1
-
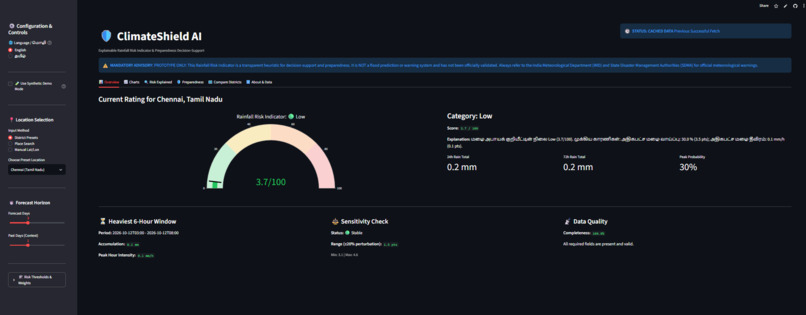
Dark Theme Screenshot 2
-
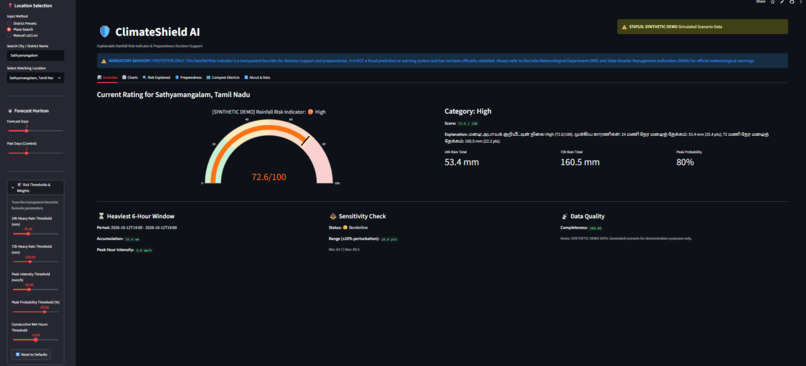
Dark Theme Screenshot 3
-
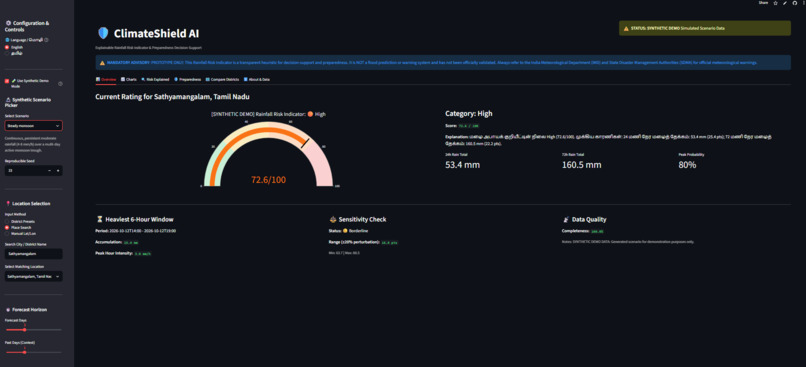
Dark Theme Screenshot 4
-
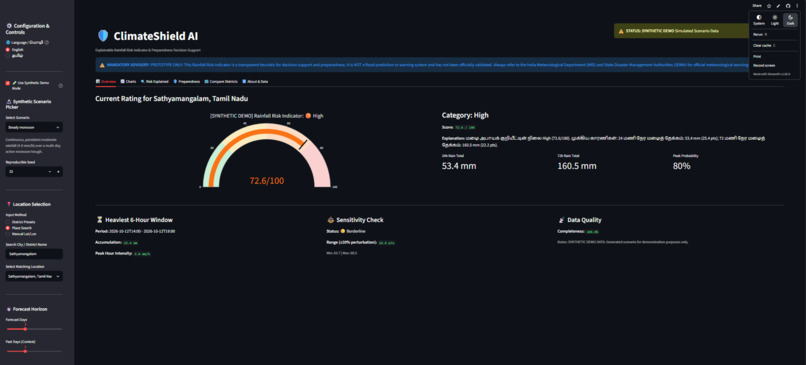
Dark Theme Screenshot 5
-
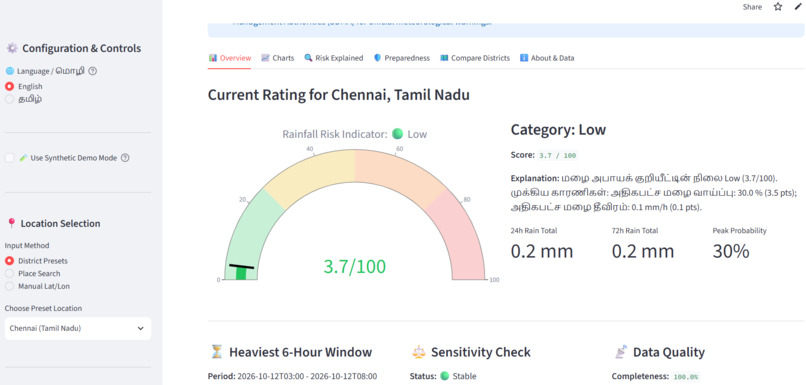
Light Theme Screenshot 2
-
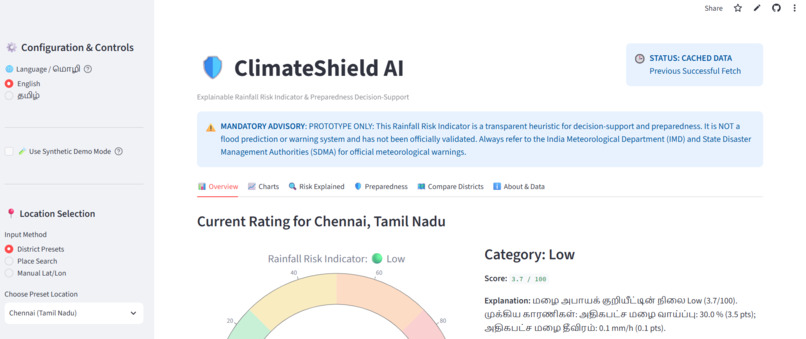
Light Theme Screenshot 3
-
Light Theme Screenshot 4
Inspiration
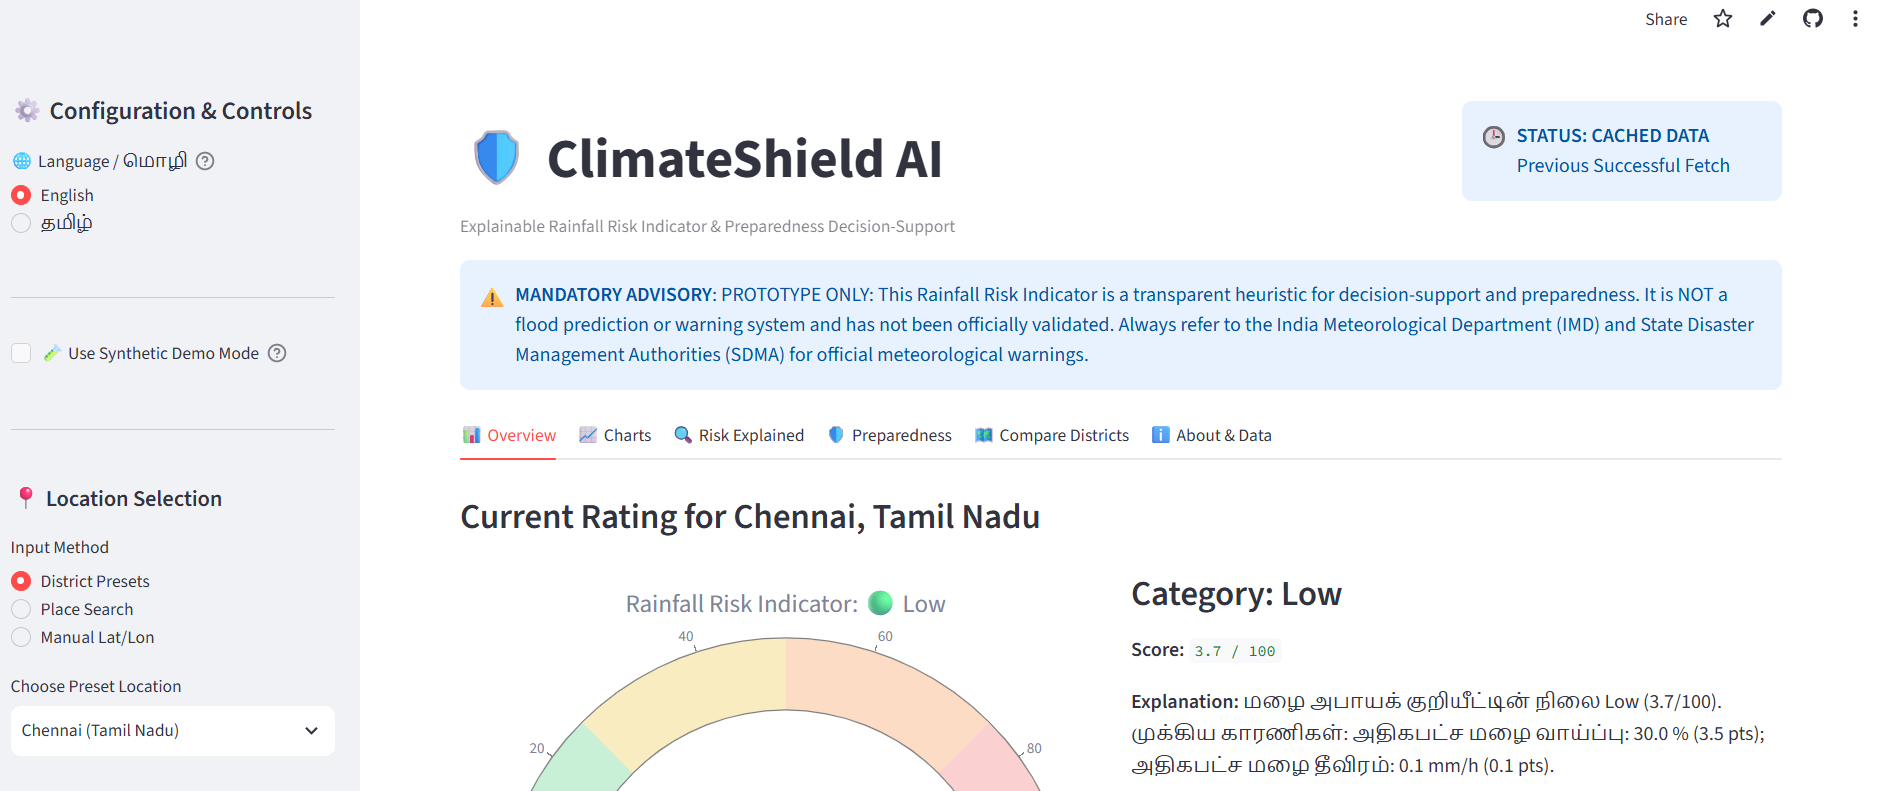
Rain forecasts are usually raw numbers: millimetres, percentages, hourly tables. During heavy rain in Tamil Nadu, a district official, volunteer, or family needs a quick answer: how heavy is the rain expected to be, why, and what should I do? We wanted to turn open forecast data into something understandable in about 10 seconds, without pretending to be a flood warning system.
What it does
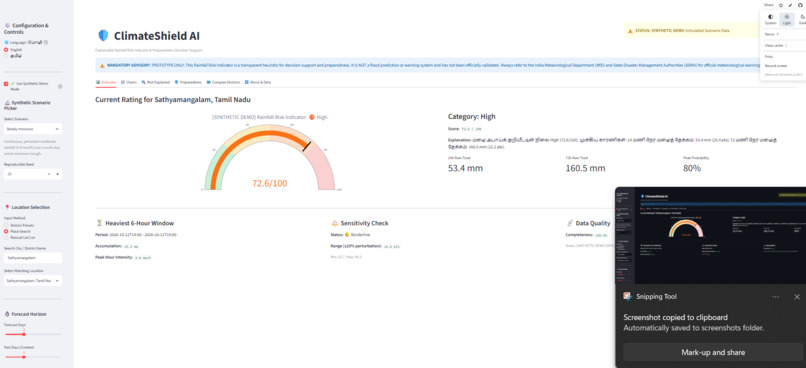
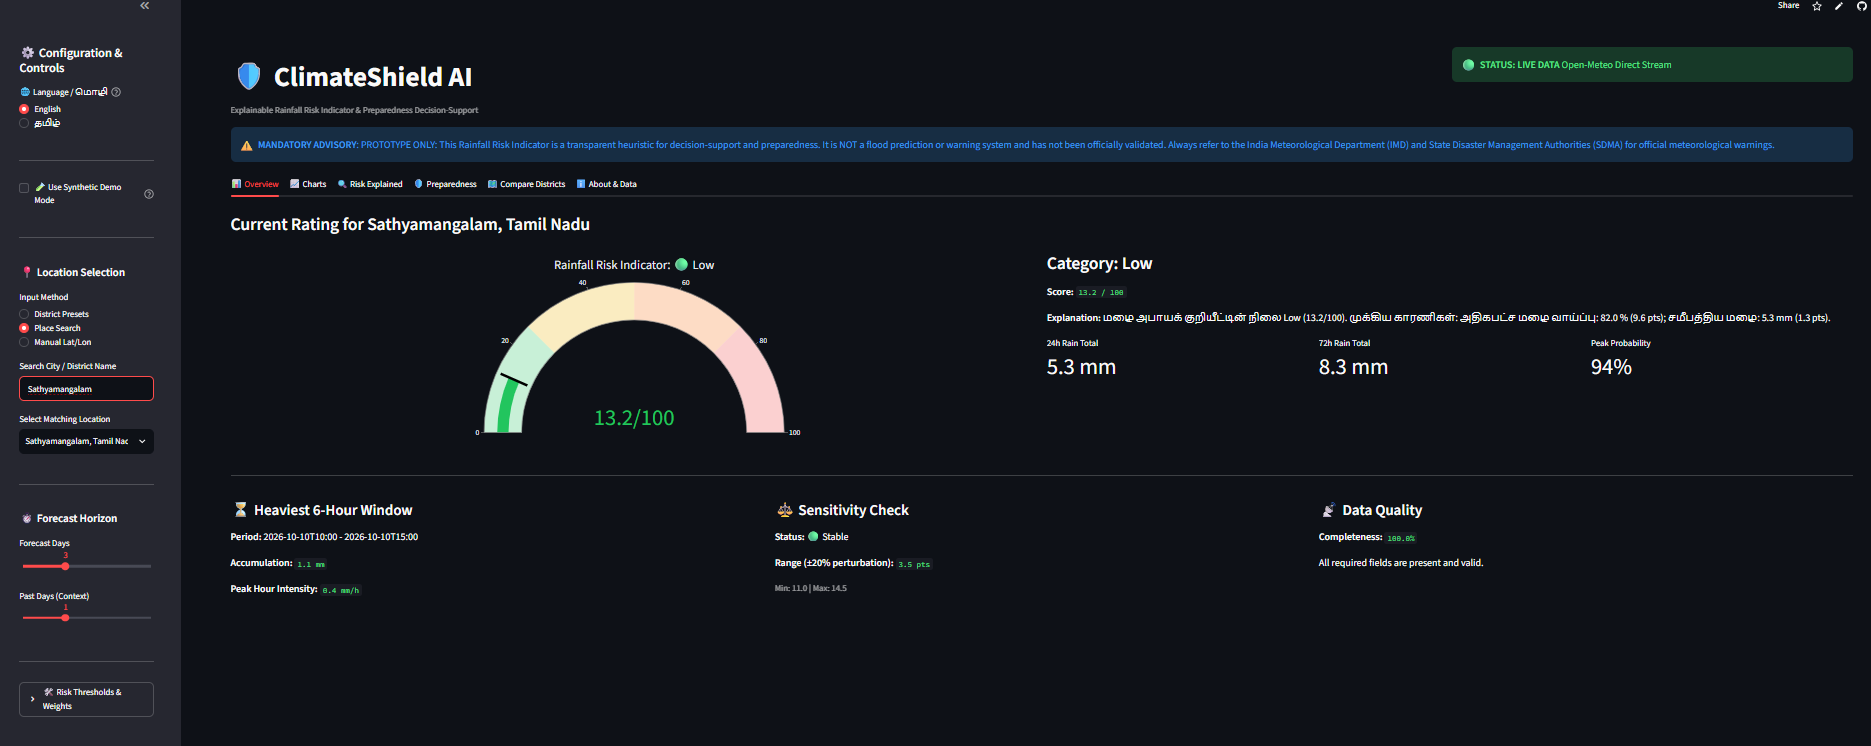
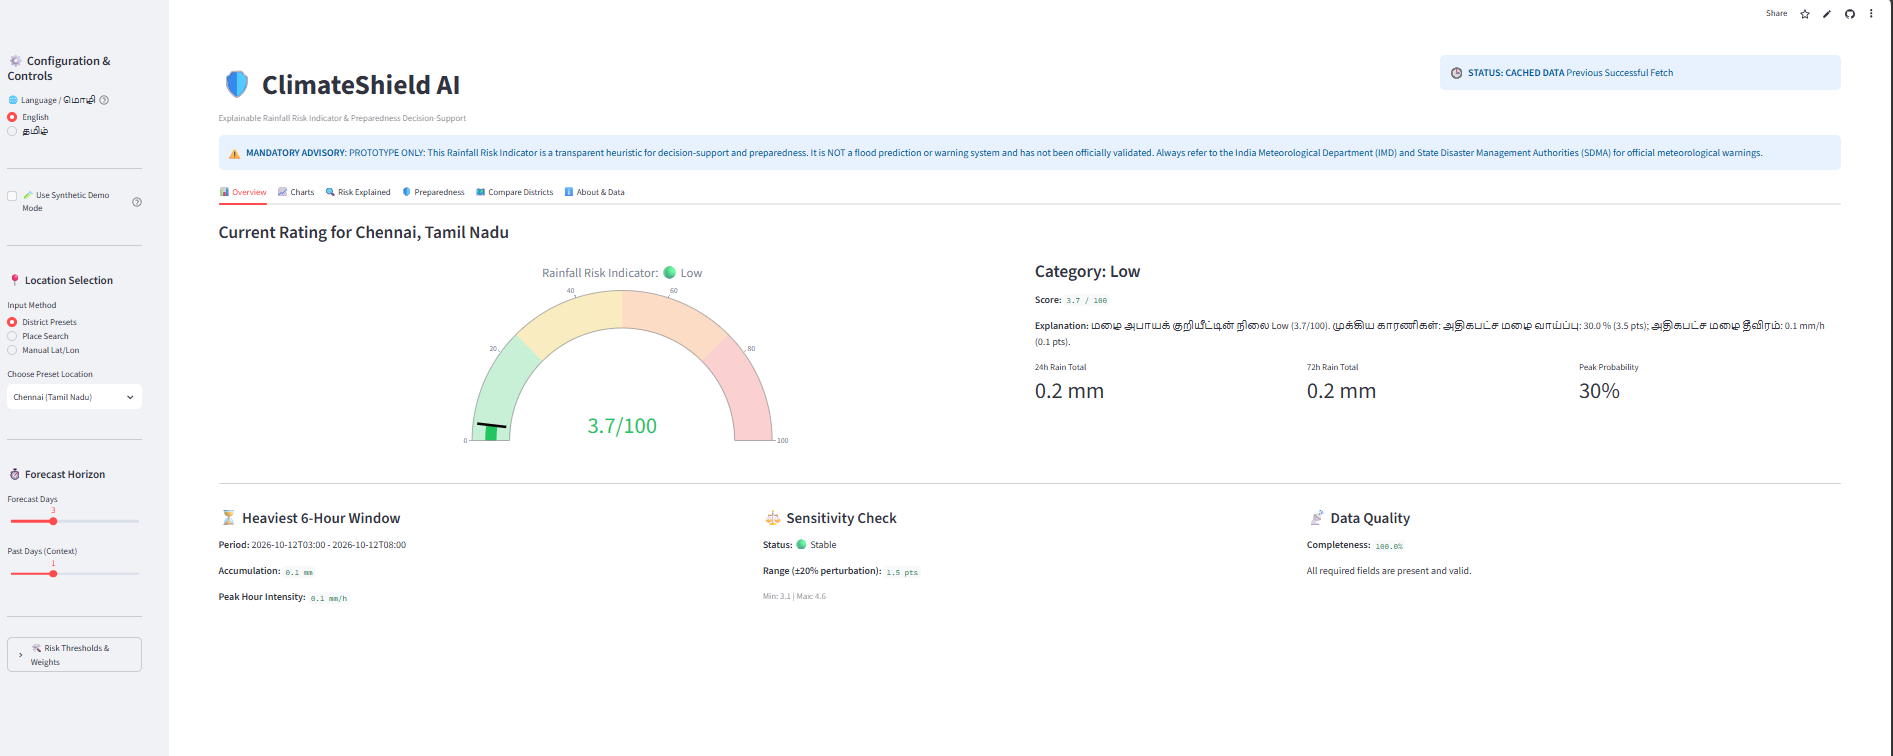
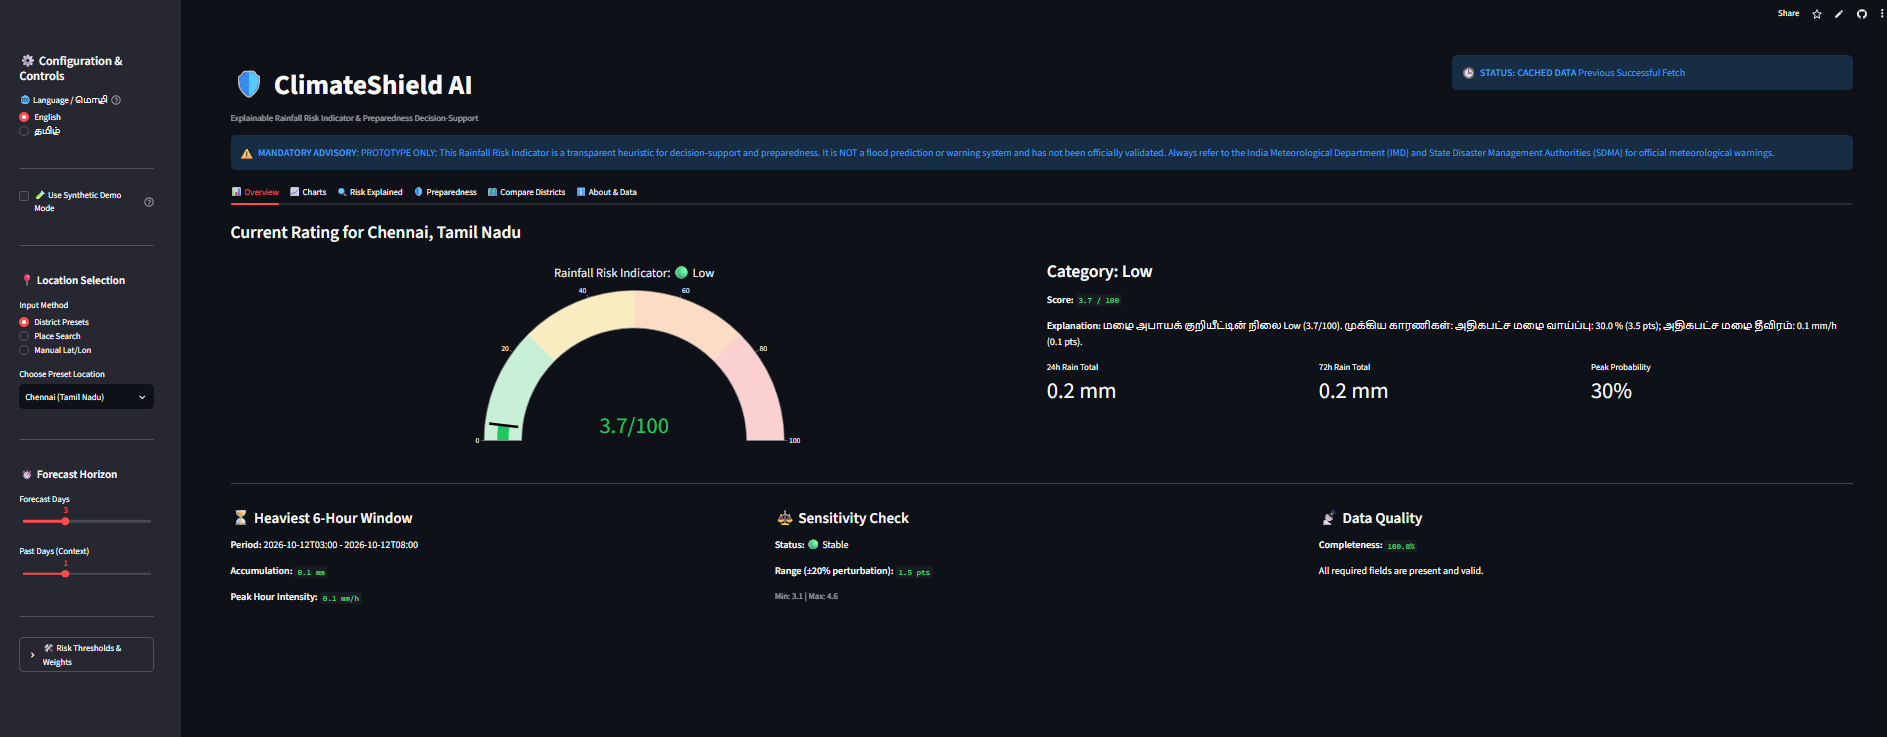
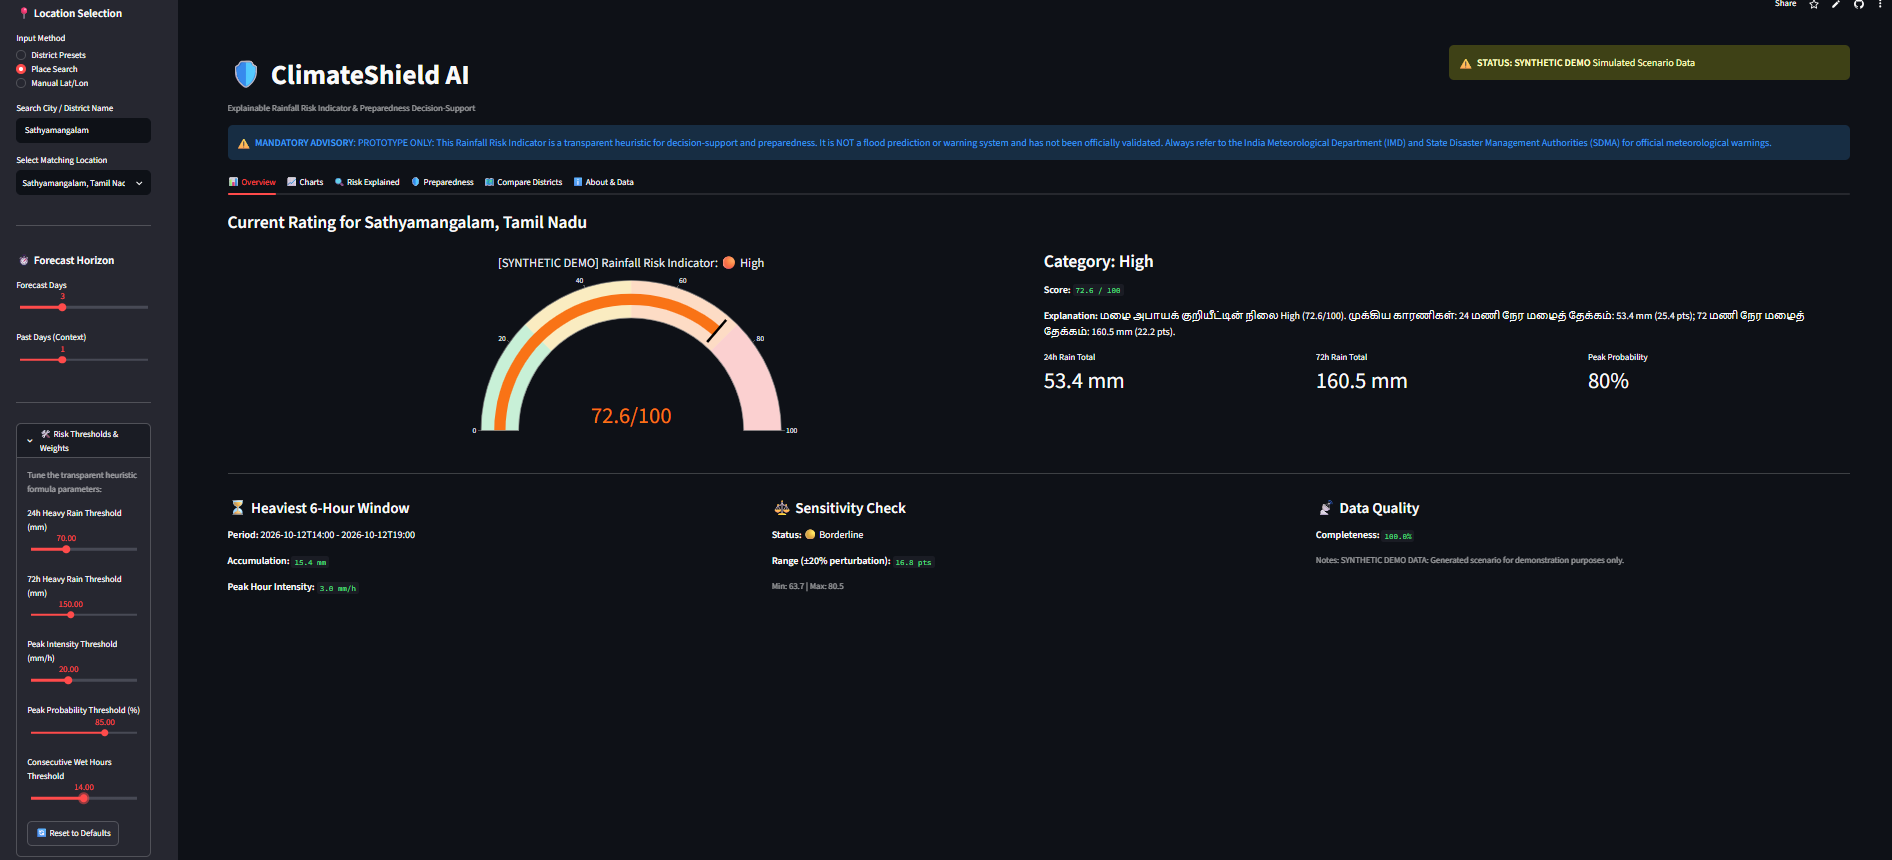
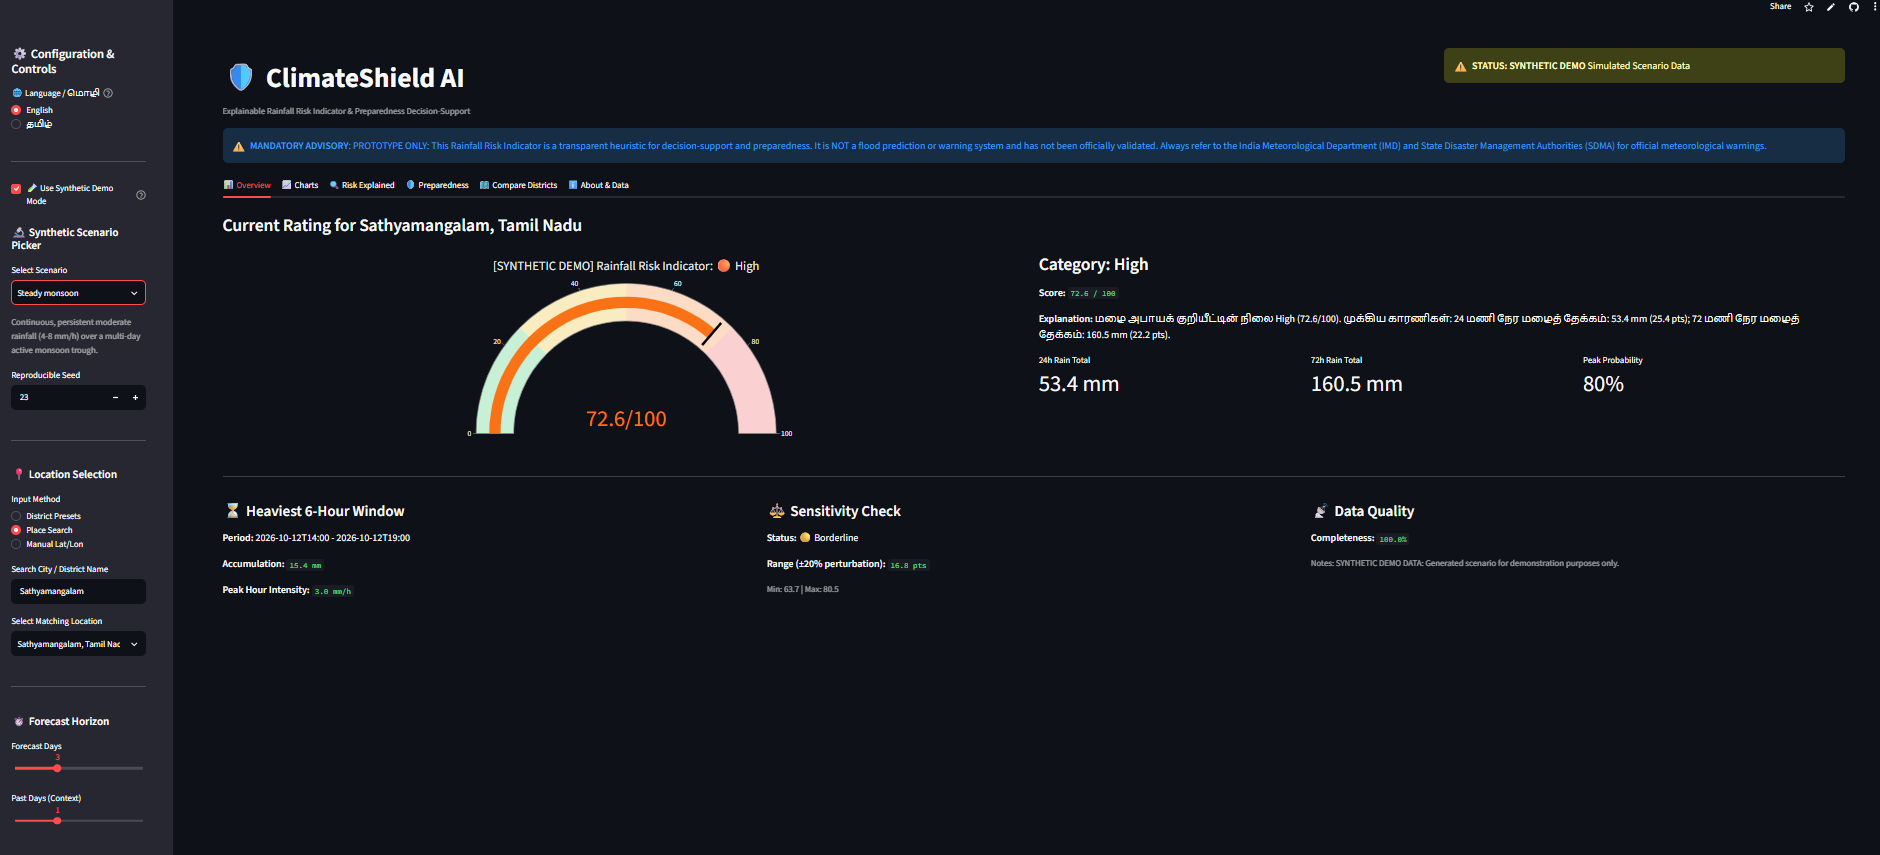
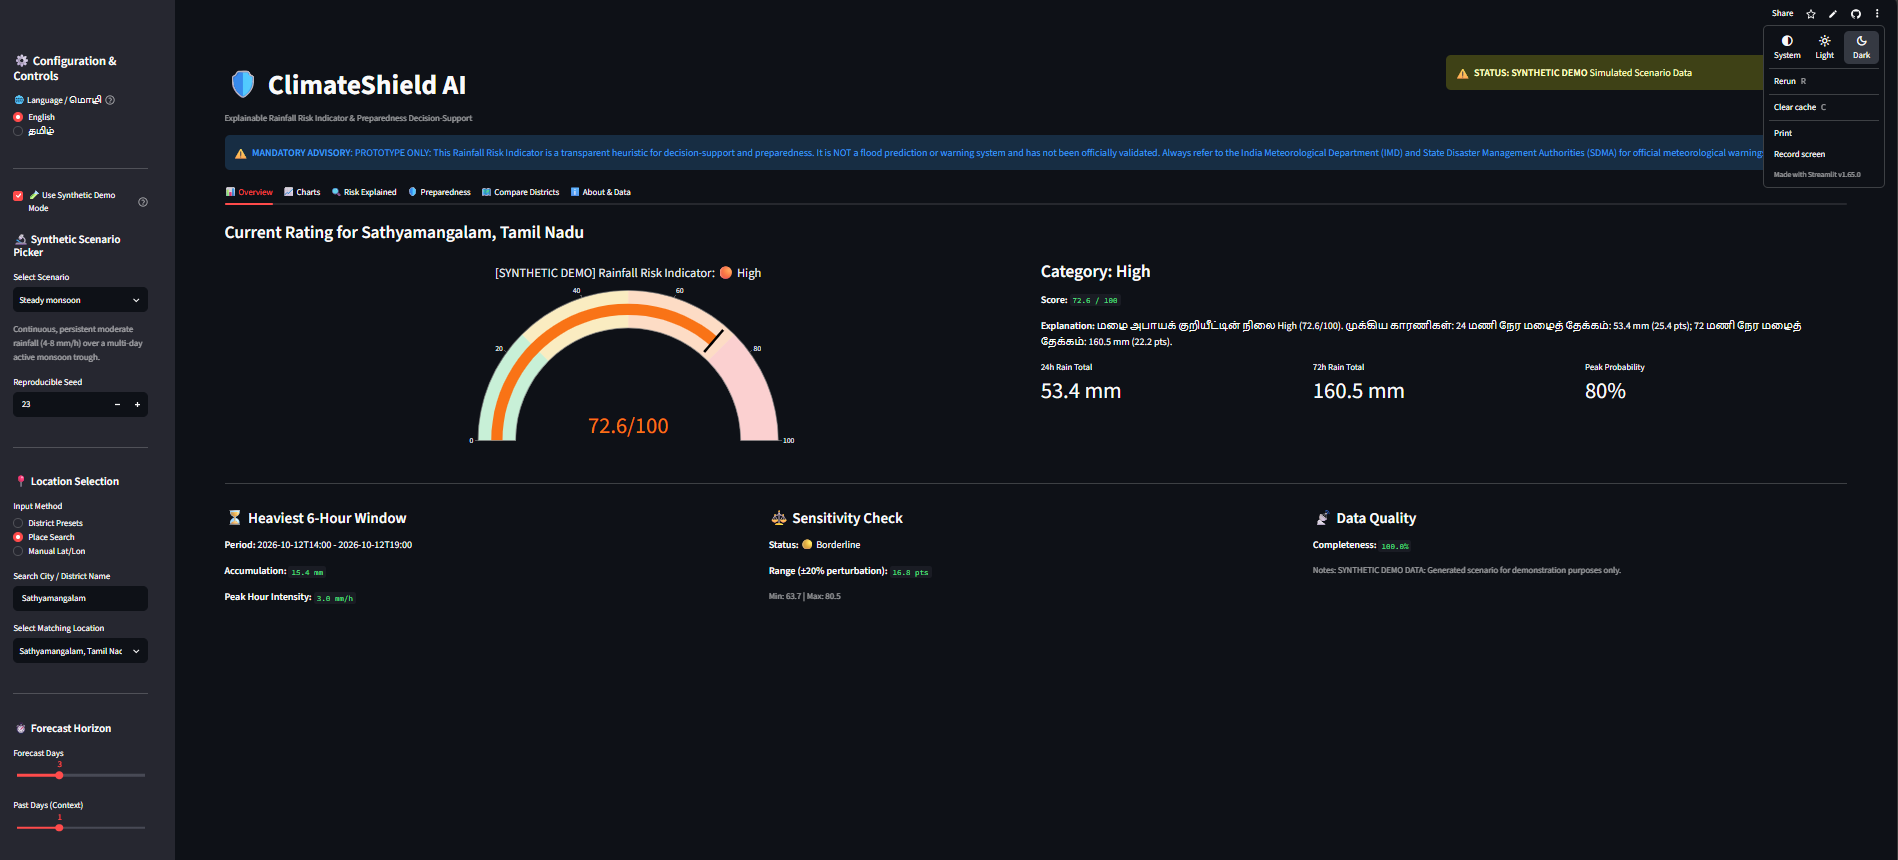
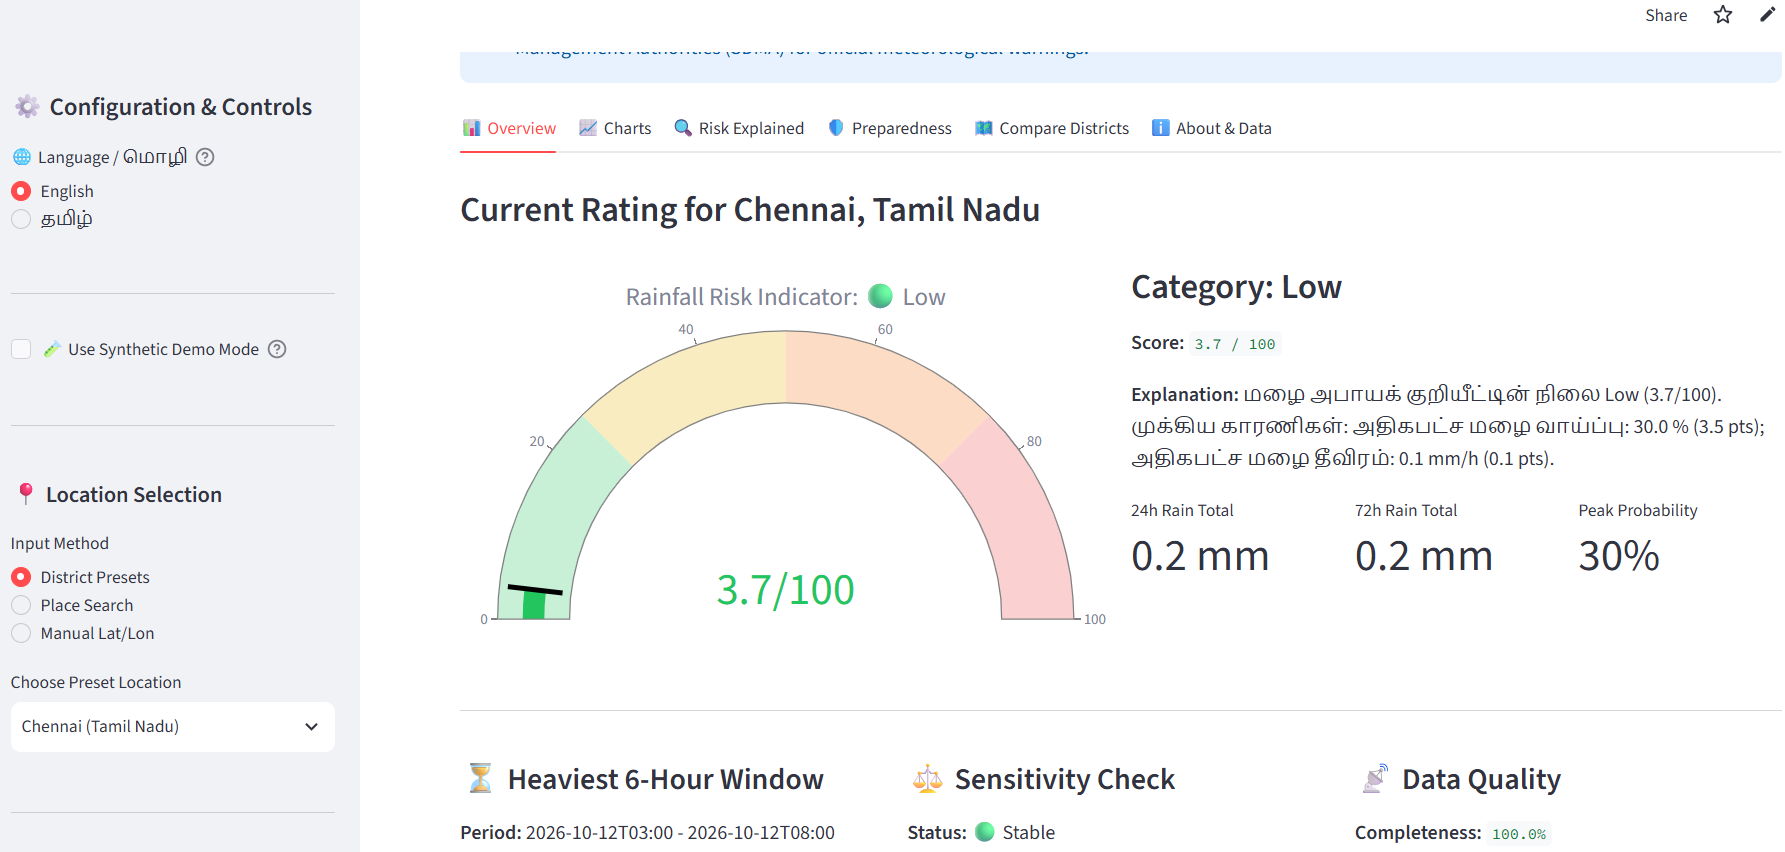
ClimateShield AI fetches live precipitation forecasts from the Open-Meteo API for Tamil Nadu districts and any place worldwide, and produces a Rainfall Risk Indicator (Low / Moderate / High / Severe).
- Explainable score: a transparent, rule-based heuristic. It shows each factor's contribution (24h/72h rainfall, peak hourly intensity, precipitation probability, consecutive wet hours, recent rain) and a plain-language "Why this rating".
- Configurable: users can change thresholds and weights and watch the rating change.
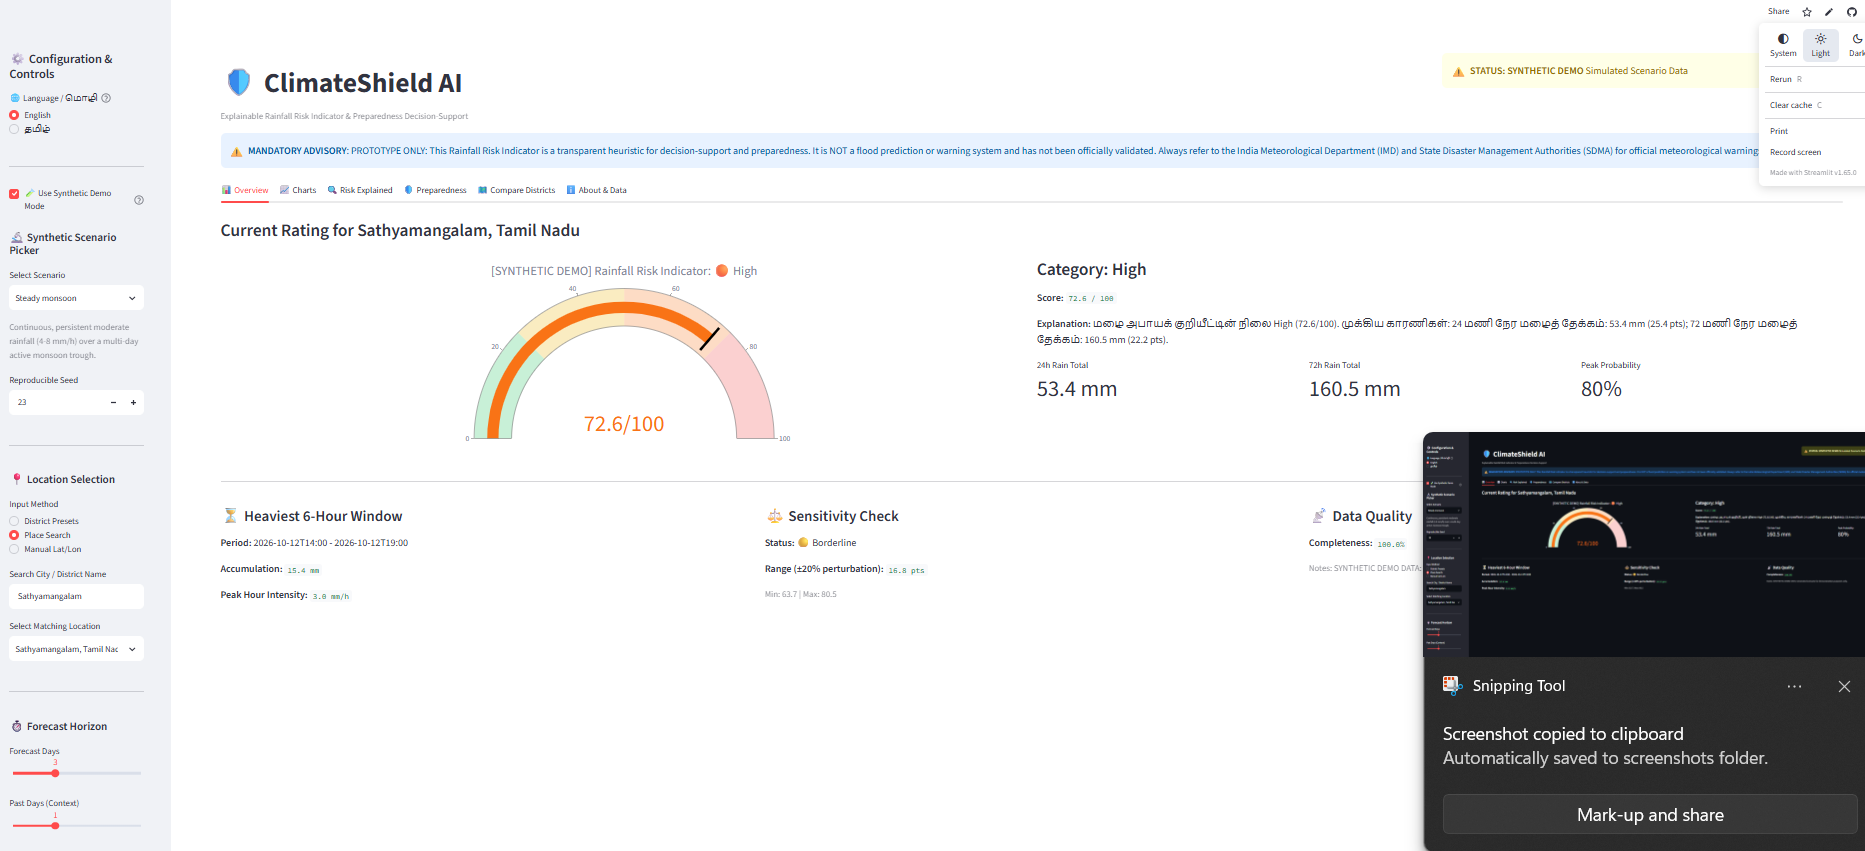
- Uncertainty signal: a sensitivity check shows whether the rating is stable or borderline if assumptions shift by ±20%.
- Heaviest 6-hour window, daily summaries, rainfall charts, and a what-if stress test (clearly labeled hypothetical).
- District comparison across Tamil Nadu with a map.
- Preparedness guidance in English and simple Tamil, a checklist, links to official advisories, and a shareable brief.
- Resilient: API errors, missing data, and offline use are handled gracefully. A clearly labeled Synthetic Demo Mode lets anyone see High/Severe scenarios on dry days.
What it is not: it is not flood prediction. It ignores terrain, drainage, soil saturation, river levels, tides, reservoir releases, and local infrastructure. It has no ML model and no validation metrics, and we make no accuracy claims.
How we built it
Python and Streamlit, with pandas for data handling and Plotly for charts. The code is modular: a data layer (geocoding, forecast fetching, retries, caching, defensive parsing), a pure-function risk engine, a seeded synthetic scenario generator, a guidance module, a charts module, and a thin UI. Shared dataclass contracts keep the modules consistent. We tested with pytest using mocked HTTP responses for failure paths (timeouts, rate limits, bad JSON, offline). We built it with an AI coding agent, working module by module with test gates.
Challenges we ran into
- Designing a score that is useful but honest. We chose a transparent heuristic over anything that implies false precision.
- Handling messy API data: nulls, mismatched arrays, rate limits.
- Making the first screen answer the user's question instead of showing a wall of numbers.
- Keeping synthetic mode unmistakably separate from real data.
Accomplishments that we're proud of
- A fully explainable rating where every point traces back to a factor.
- A sensitivity check that communicates uncertainty without inventing statistics.
- Failure handling that shows friendly messages, never a traceback.
- Bilingual guidance (Tamil text pending native-speaker review).
What we learned
Good decision-support is about clarity and honesty as much as data. Saying what a tool does not know builds more trust than a confident number.
What's next for ClimateShield AI
- Calibrate thresholds with IMD station data and historical events, reviewed by hydrology and disaster-management experts
- Add soil moisture, river level, and terrain layers
- Native-speaker review of Tamil content, and more regional languages
- Push or SMS alerts for district officials
- Pilot with a local NGO or district office for feedback
Data: Weather data by Open-Meteo.com (CC BY 4.0). Prototype only; not an official warning. Follow IMD and your State Disaster Management Authority.

Log in or sign up for Devpost to join the conversation.