Inspiration
Every incident response loop has the same five steps: someone gets paged, someone reads the trace, someone finds the bug in the codebase, someone writes the patch, someone opens the pull request. Today, every single one of those steps is a human at 3 AM context-switching between Dynatrace, an IDE, and GitHub.
Two things changed that make autonomous incident response actually possible right now:
Dynatrace shipped an official MCP server.
dynatrace-oss/dynatrace-mcpexposes the entire observability stack — DQL on the spans bucket, Smartscape entity lookup, Davis CoPilot, problem state, vulnerabilities — as typed tool calls an agent can invoke. That turns "read the trace" from a Grafana session into a function call.LLM agents got good at long-running, tool-augmented reasoning. Google's Agent Development Kit gives us a multi-agent loop with typed session state, and Gemini 3.5 Flash has the context window and tool-call reliability to actually carry a diagnosis from a span burst to a PR diff without losing its place.
The five steps of incident response are the five tool-augmented agents in our pipeline. Heimdall is named after the Norse watchman who sees the colors of approaching armies across the rainbow bridge — the Bifröst — before they arrive. That's the job: continuously watch the observability surface the customer already owns, and act on what's there before the human gets the page.
The Google Cloud × Dynatrace Rapid Agents Hackathon was the forcing function. Build an autonomous agent on the GCP + Dynatrace stack that does real work — not a chatbot, not a dashboard, real work that would otherwise cost an on-call human a 45-minute MTTR. That's the brief, and Heimdall is the answer.

What it does
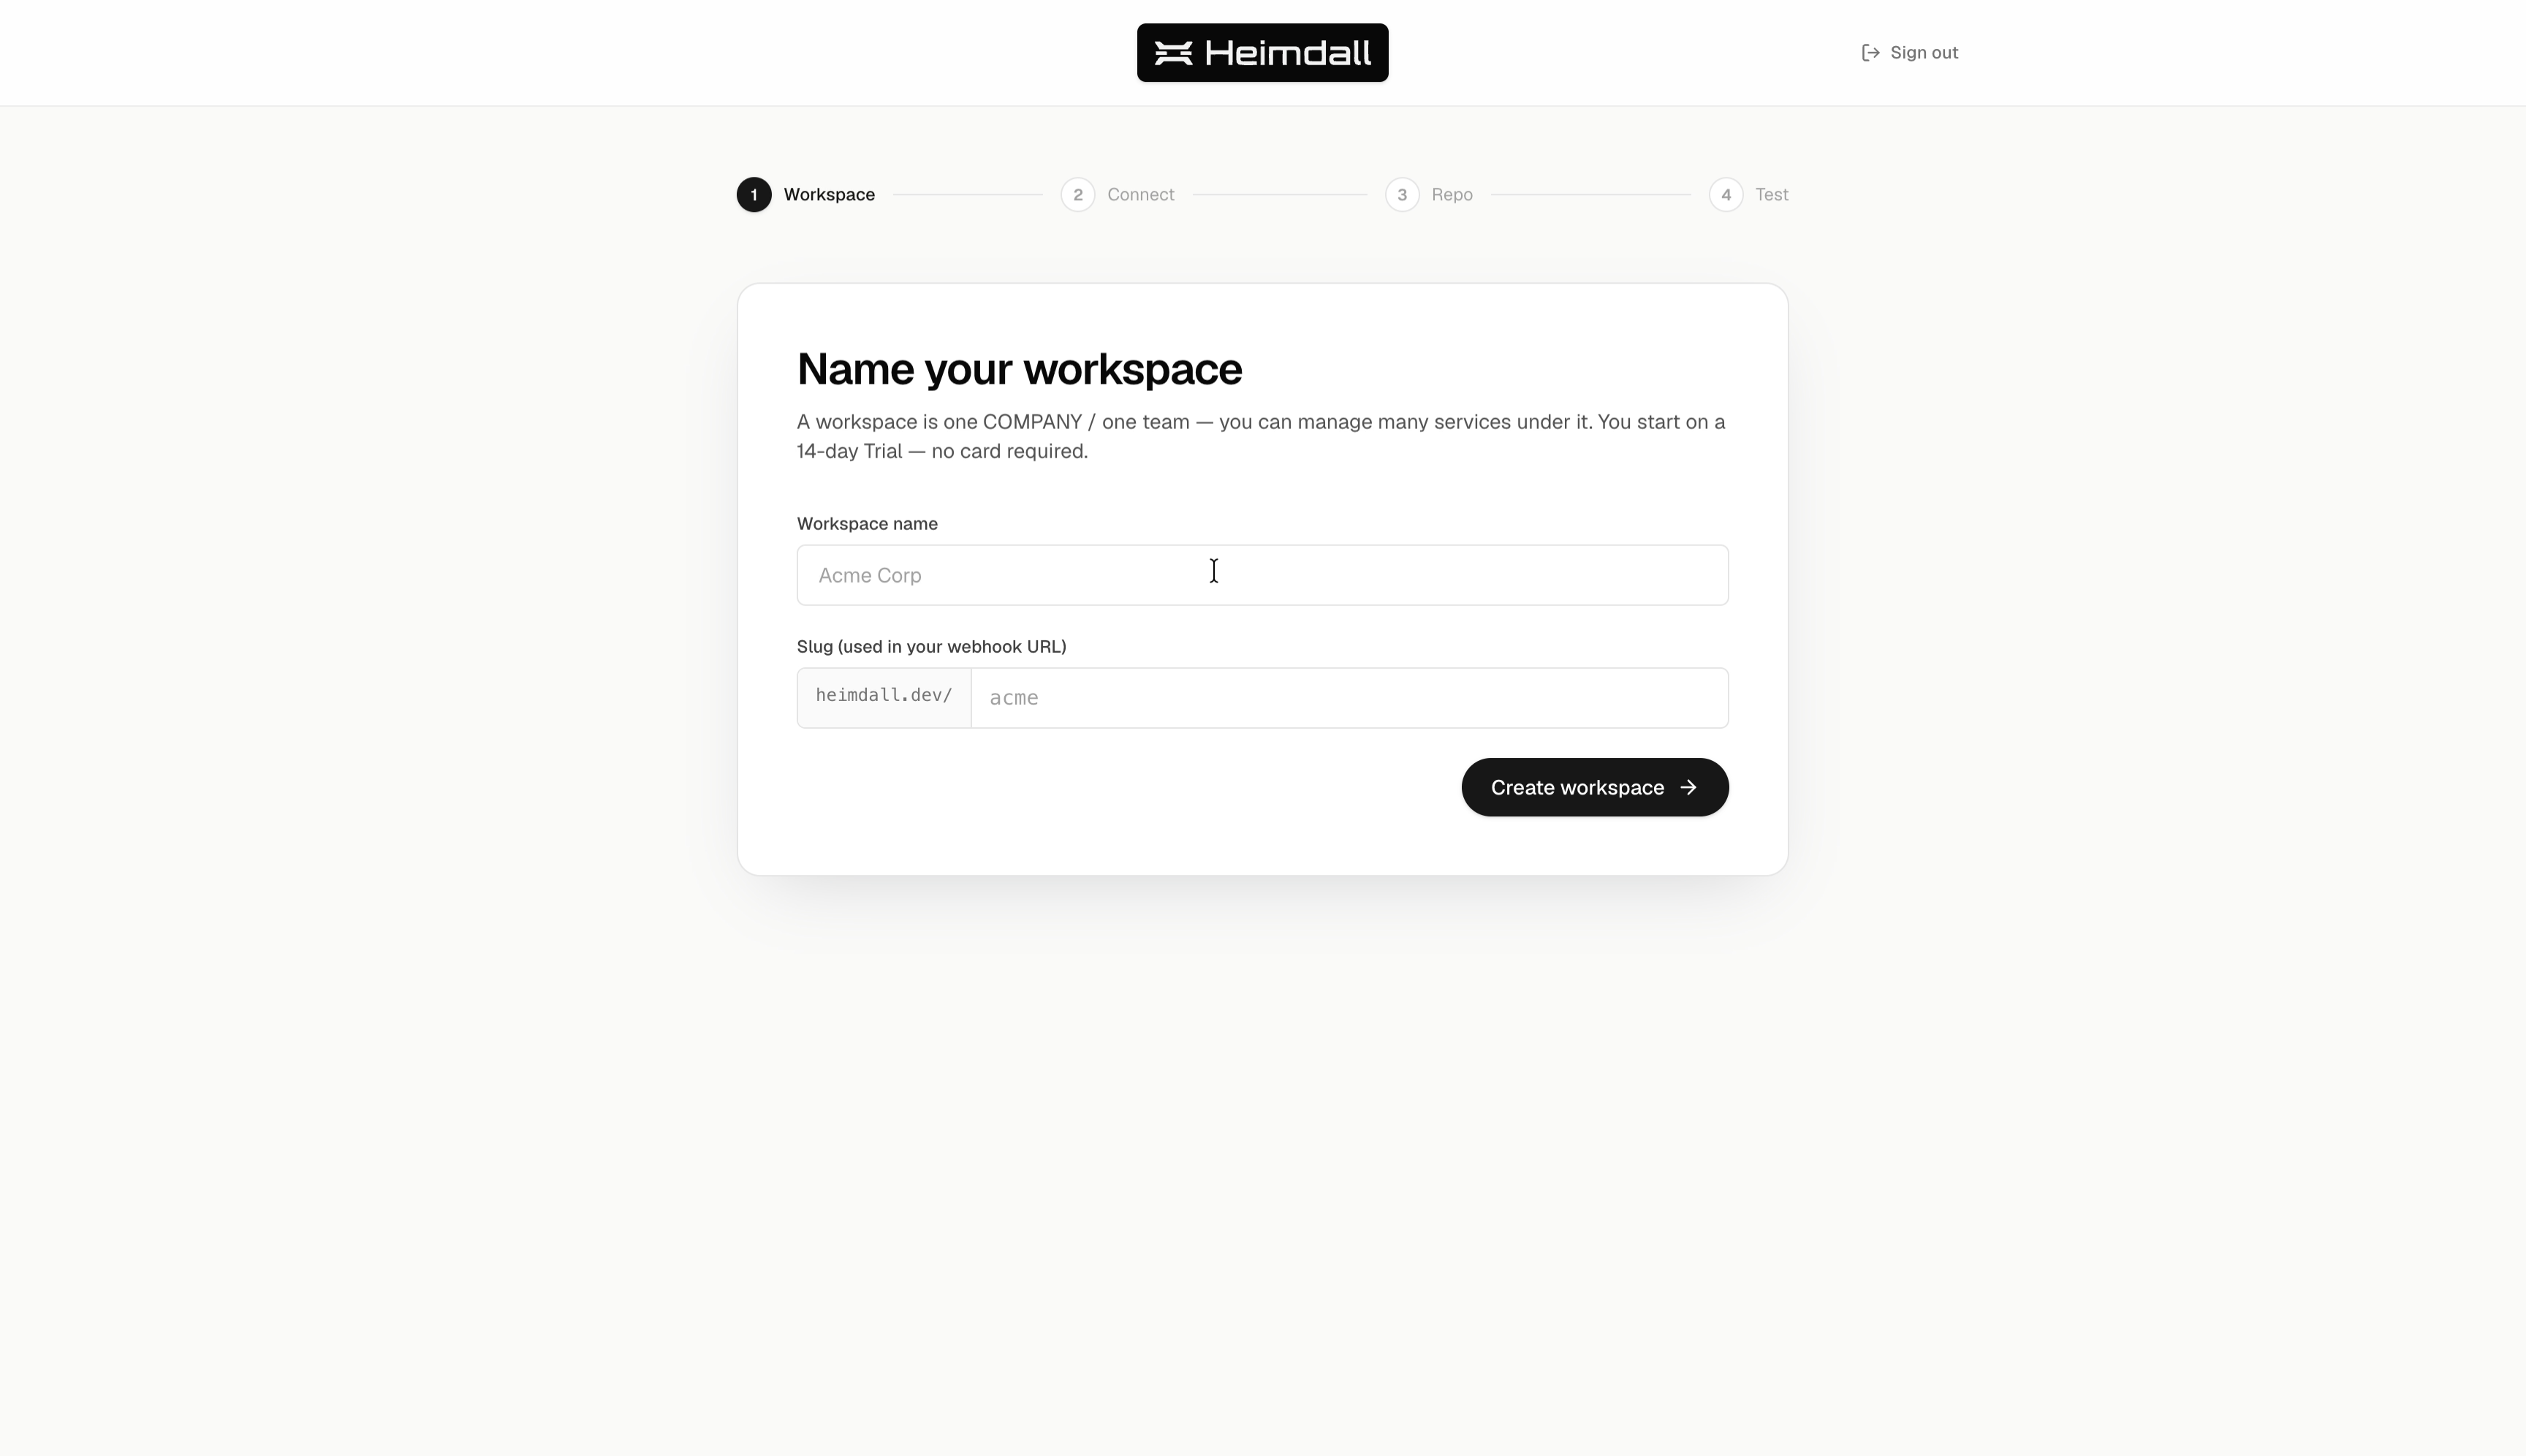
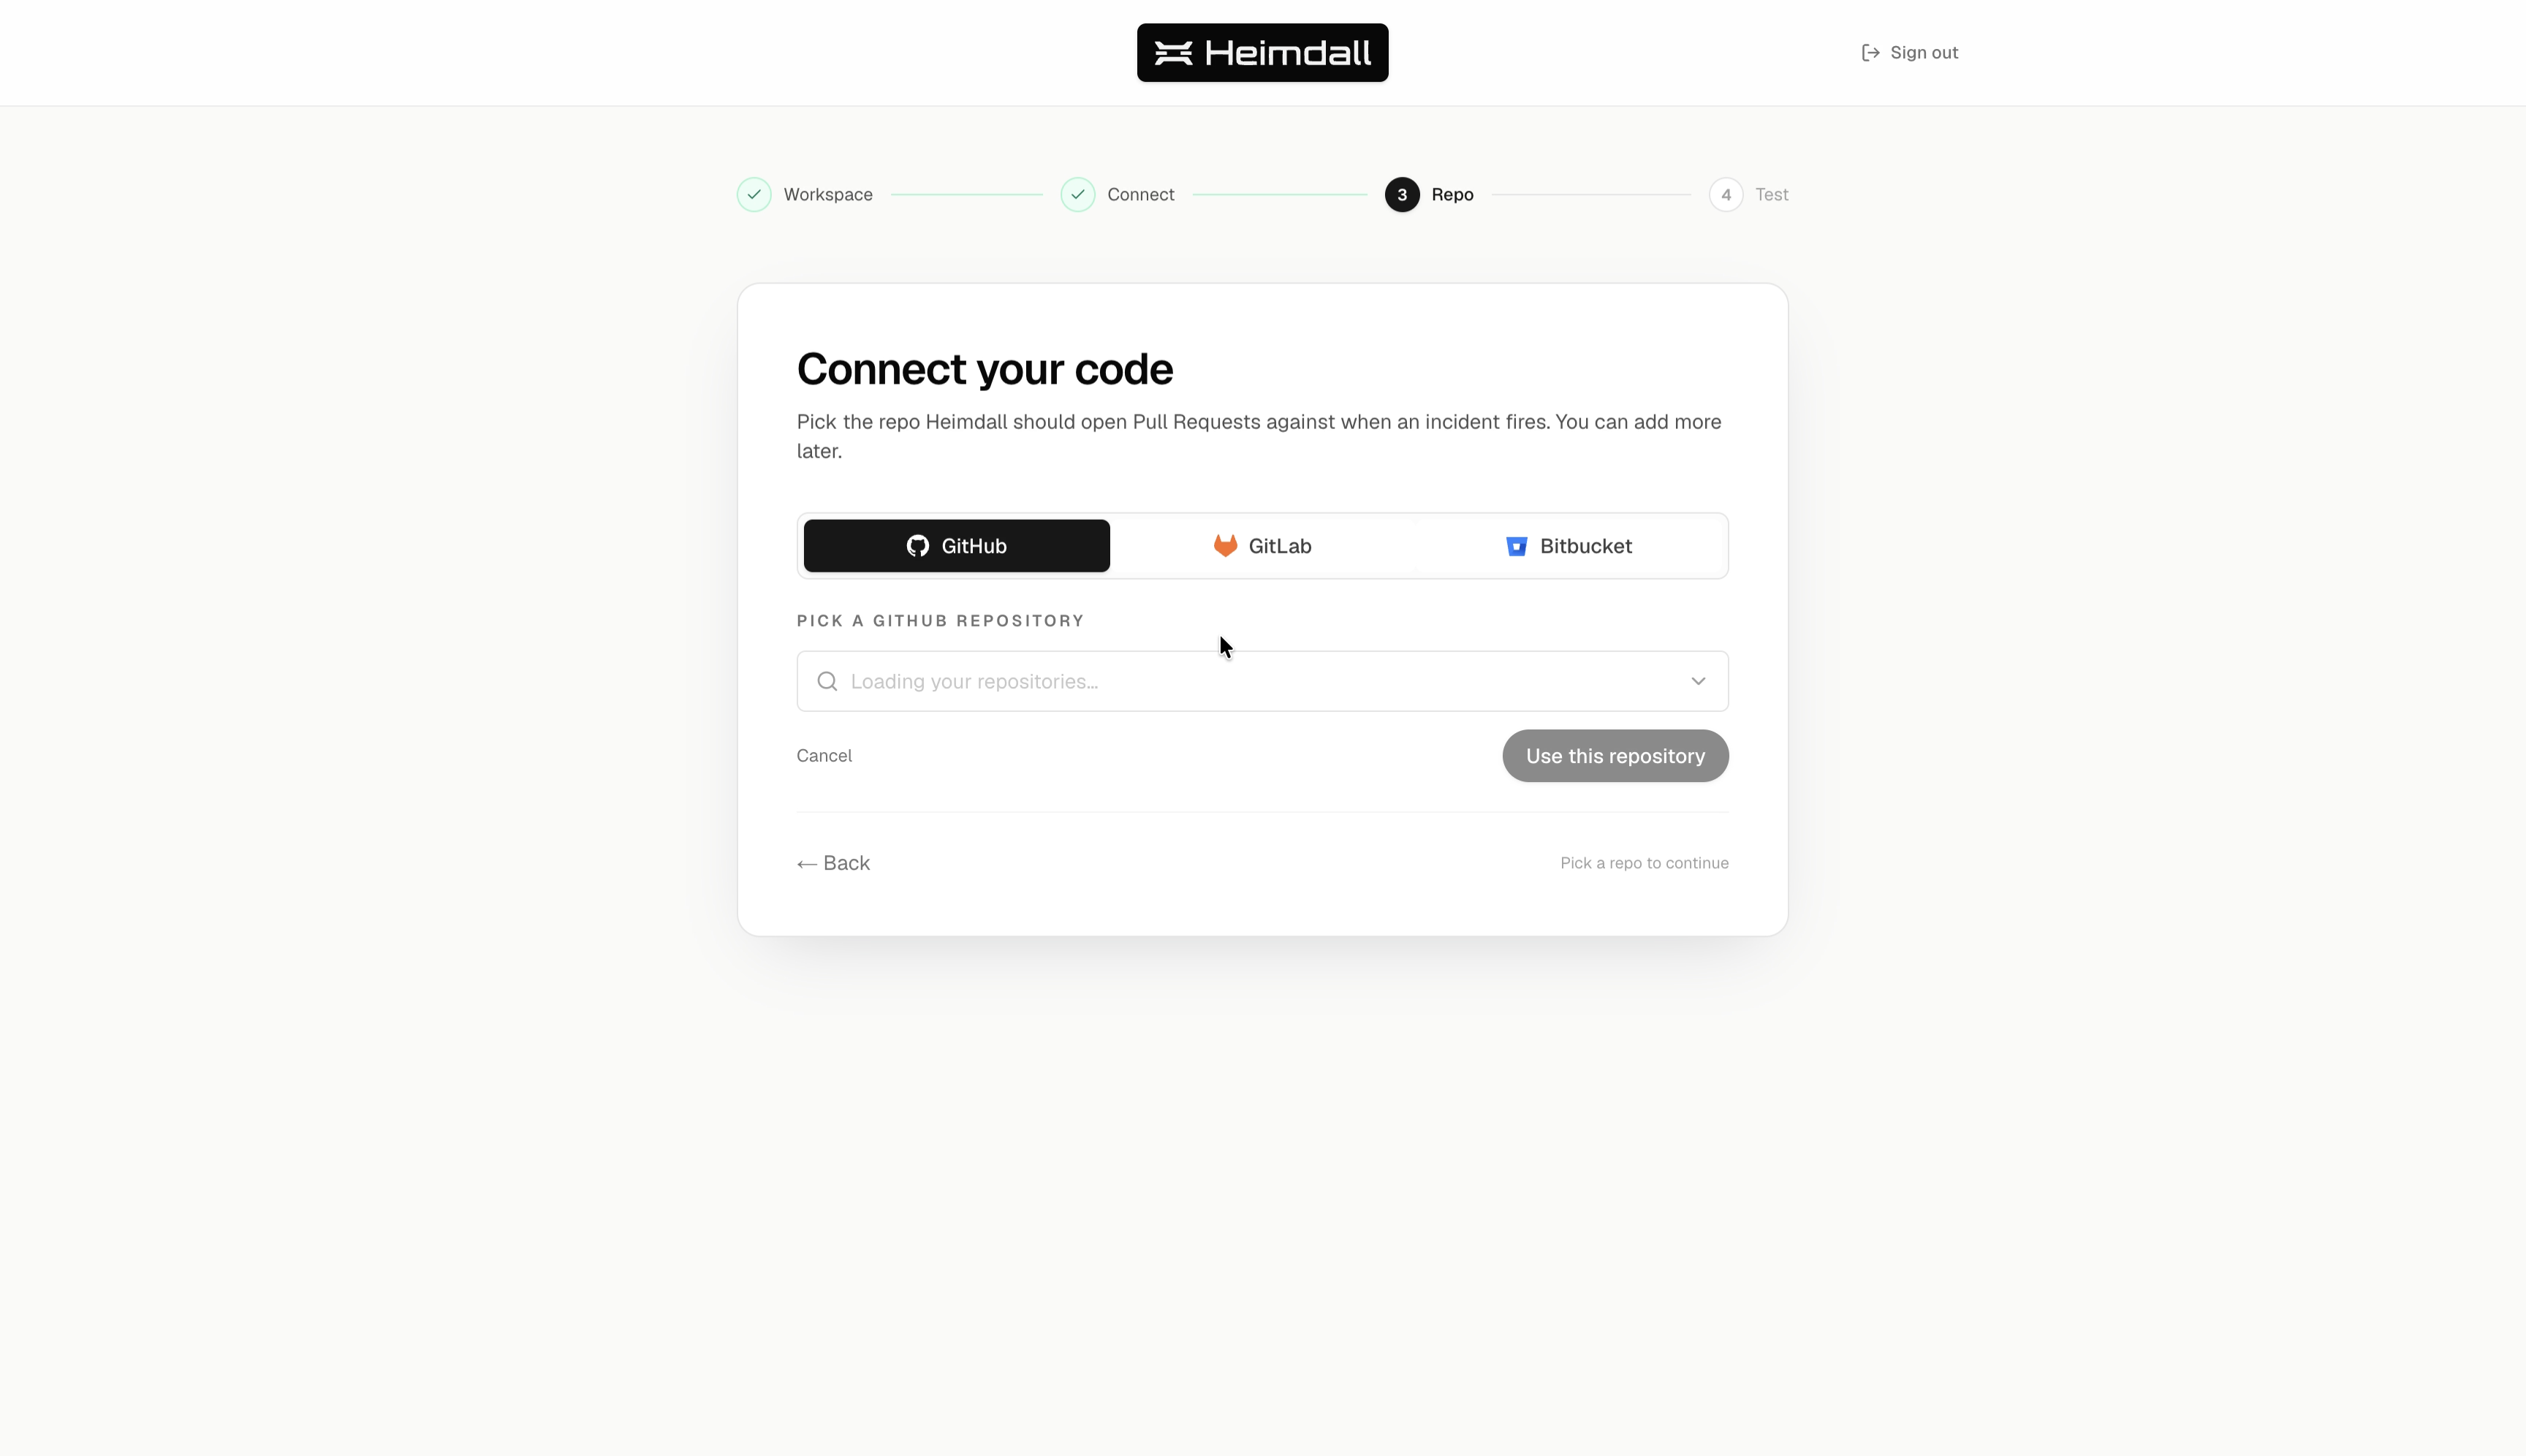
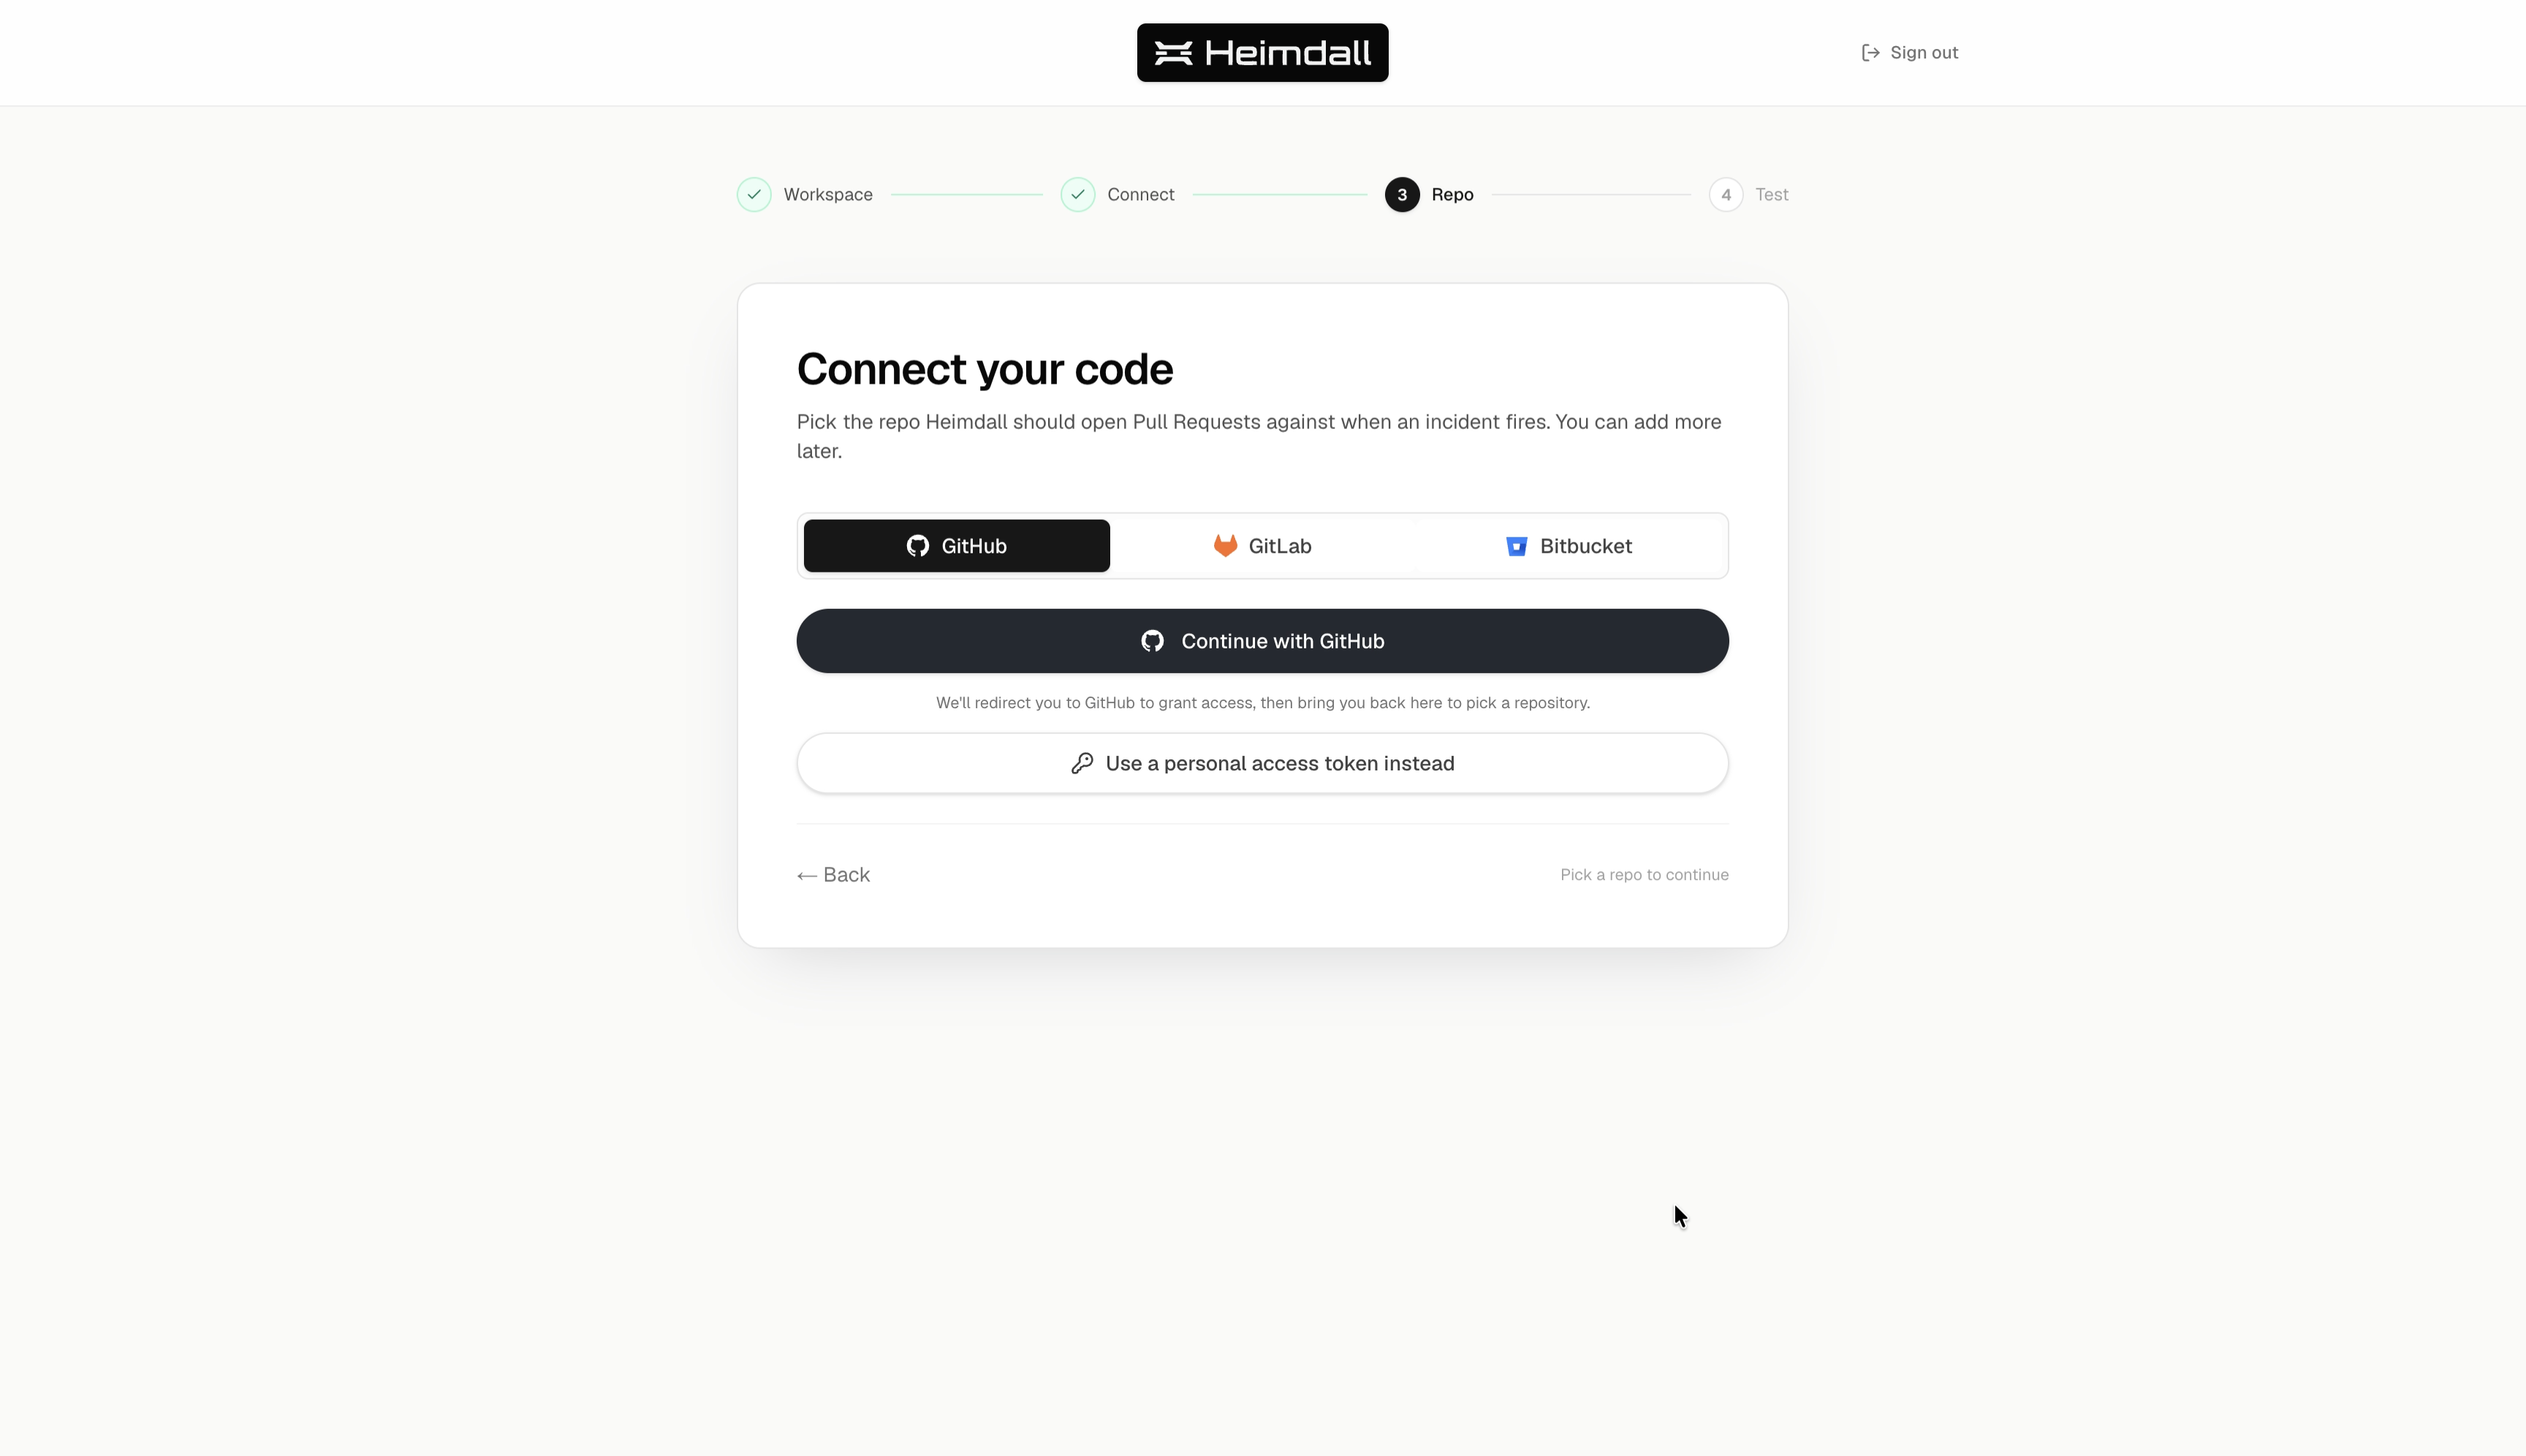
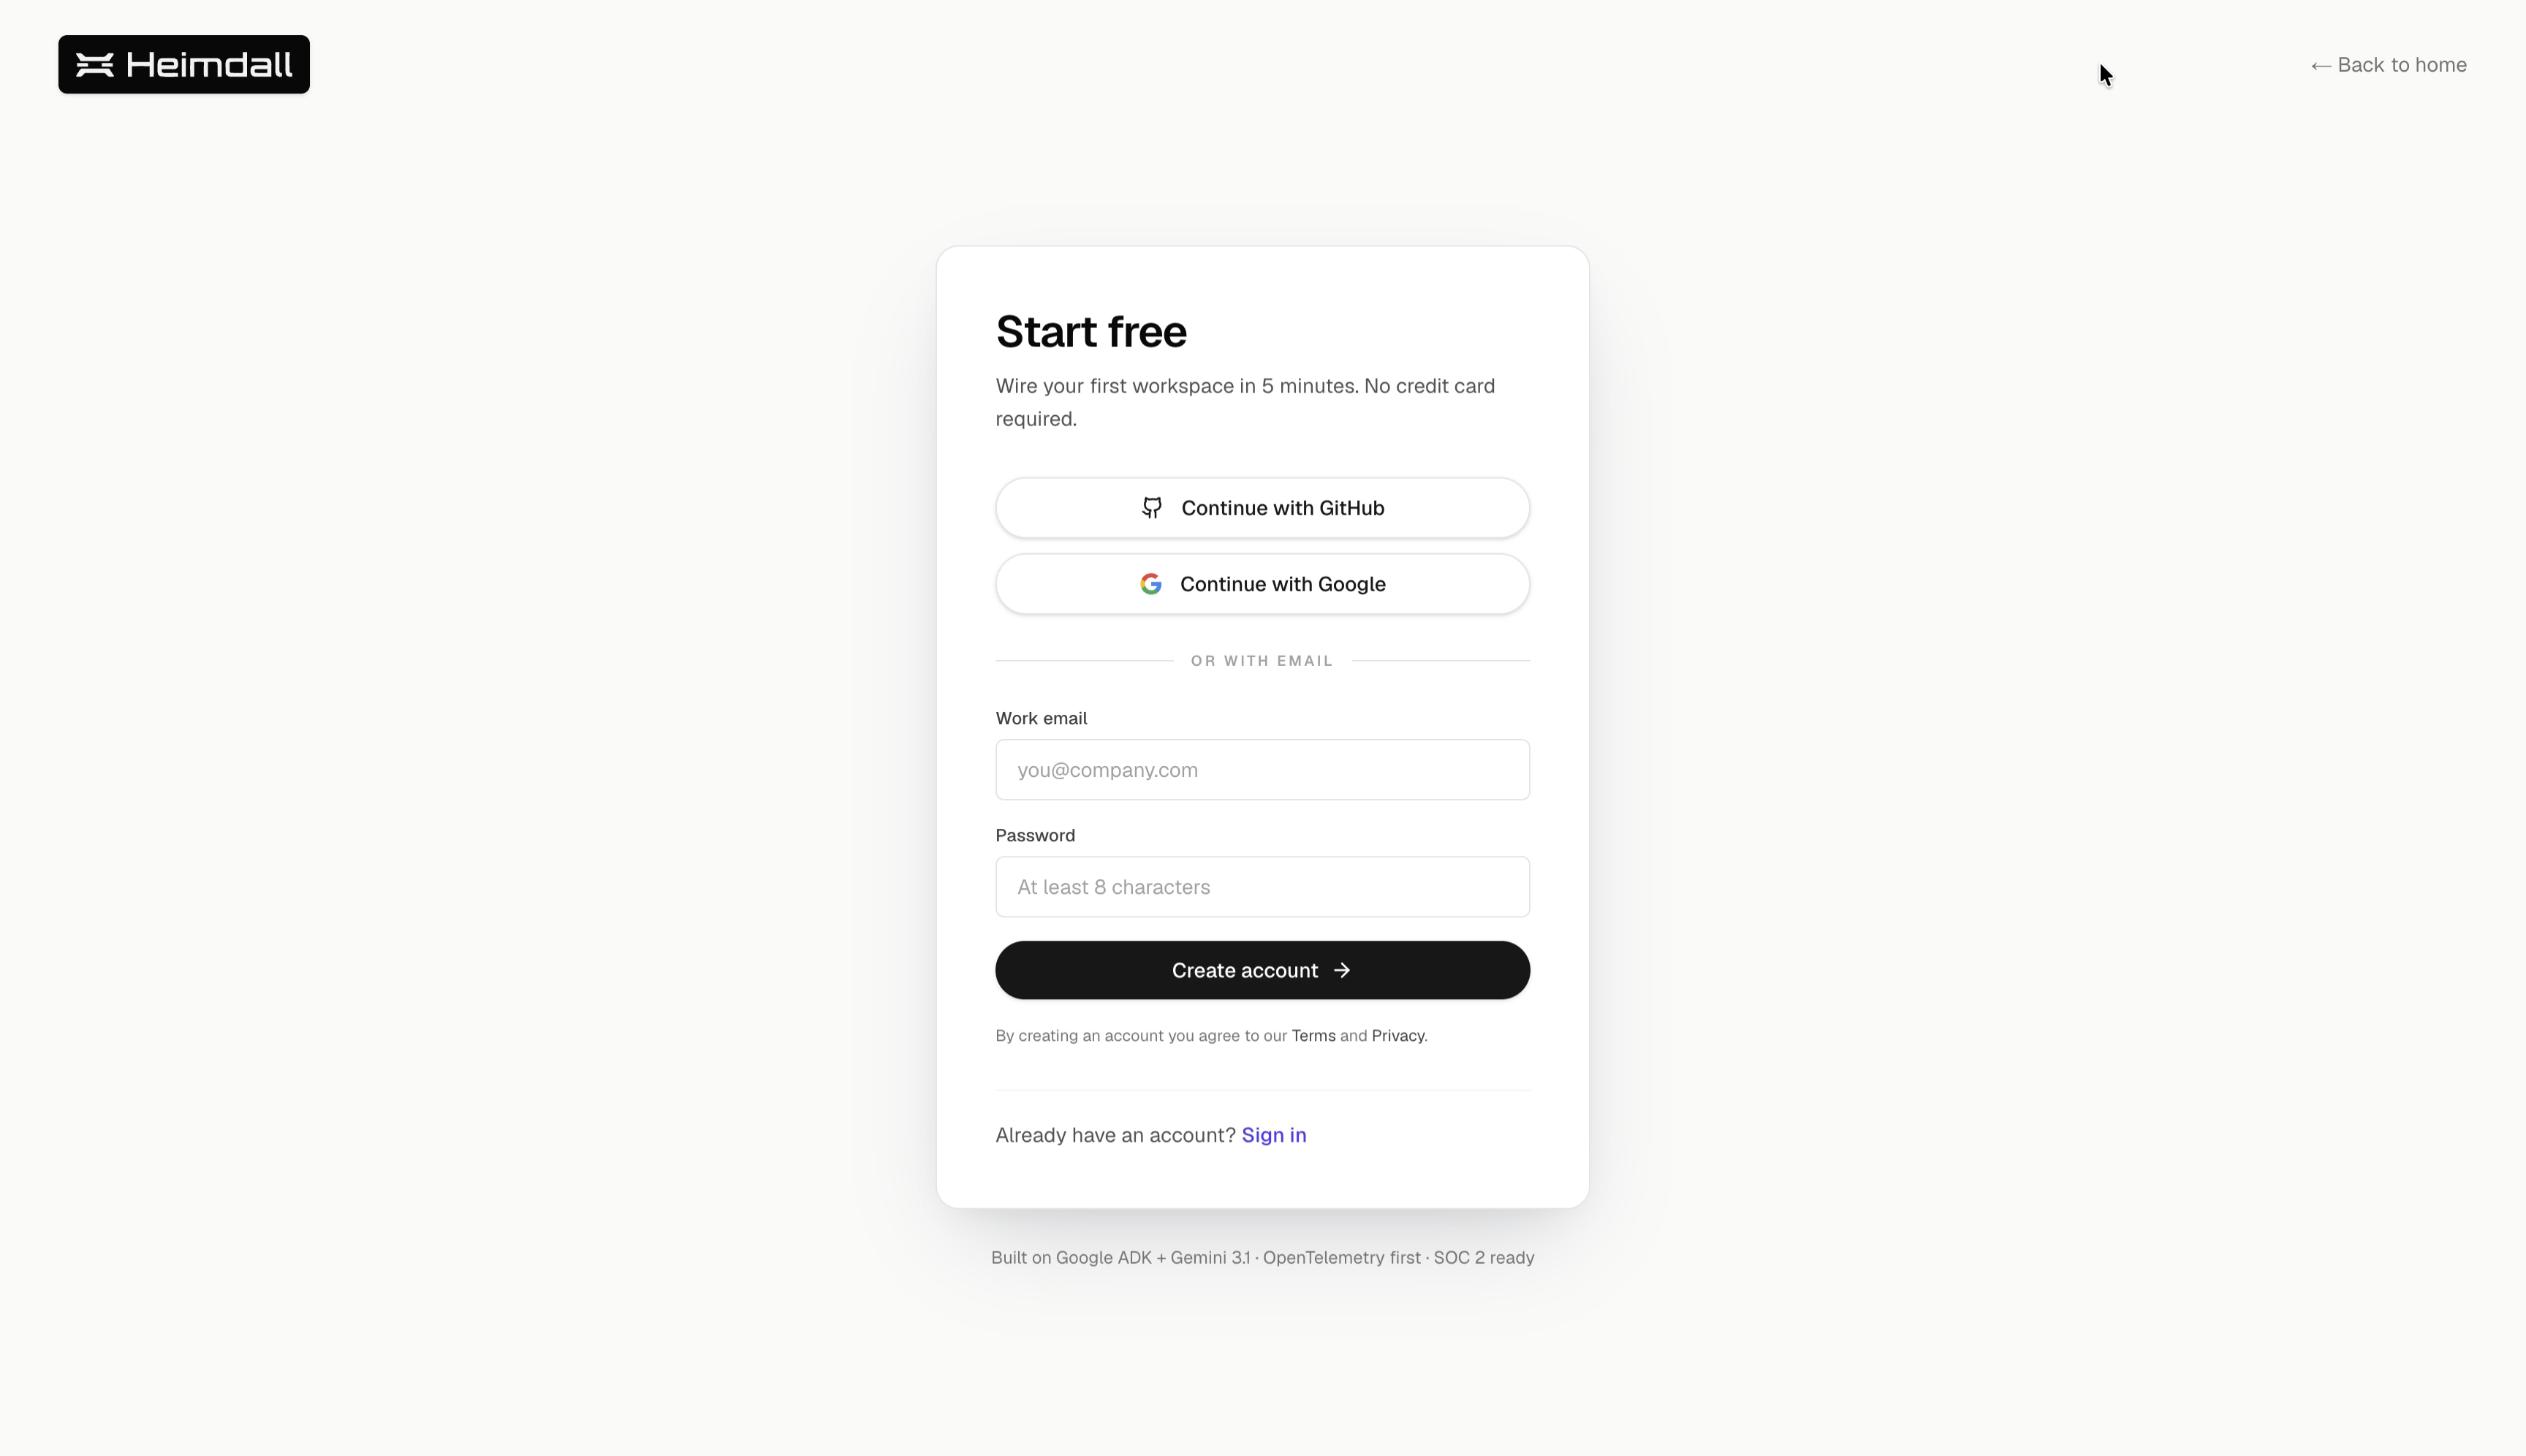
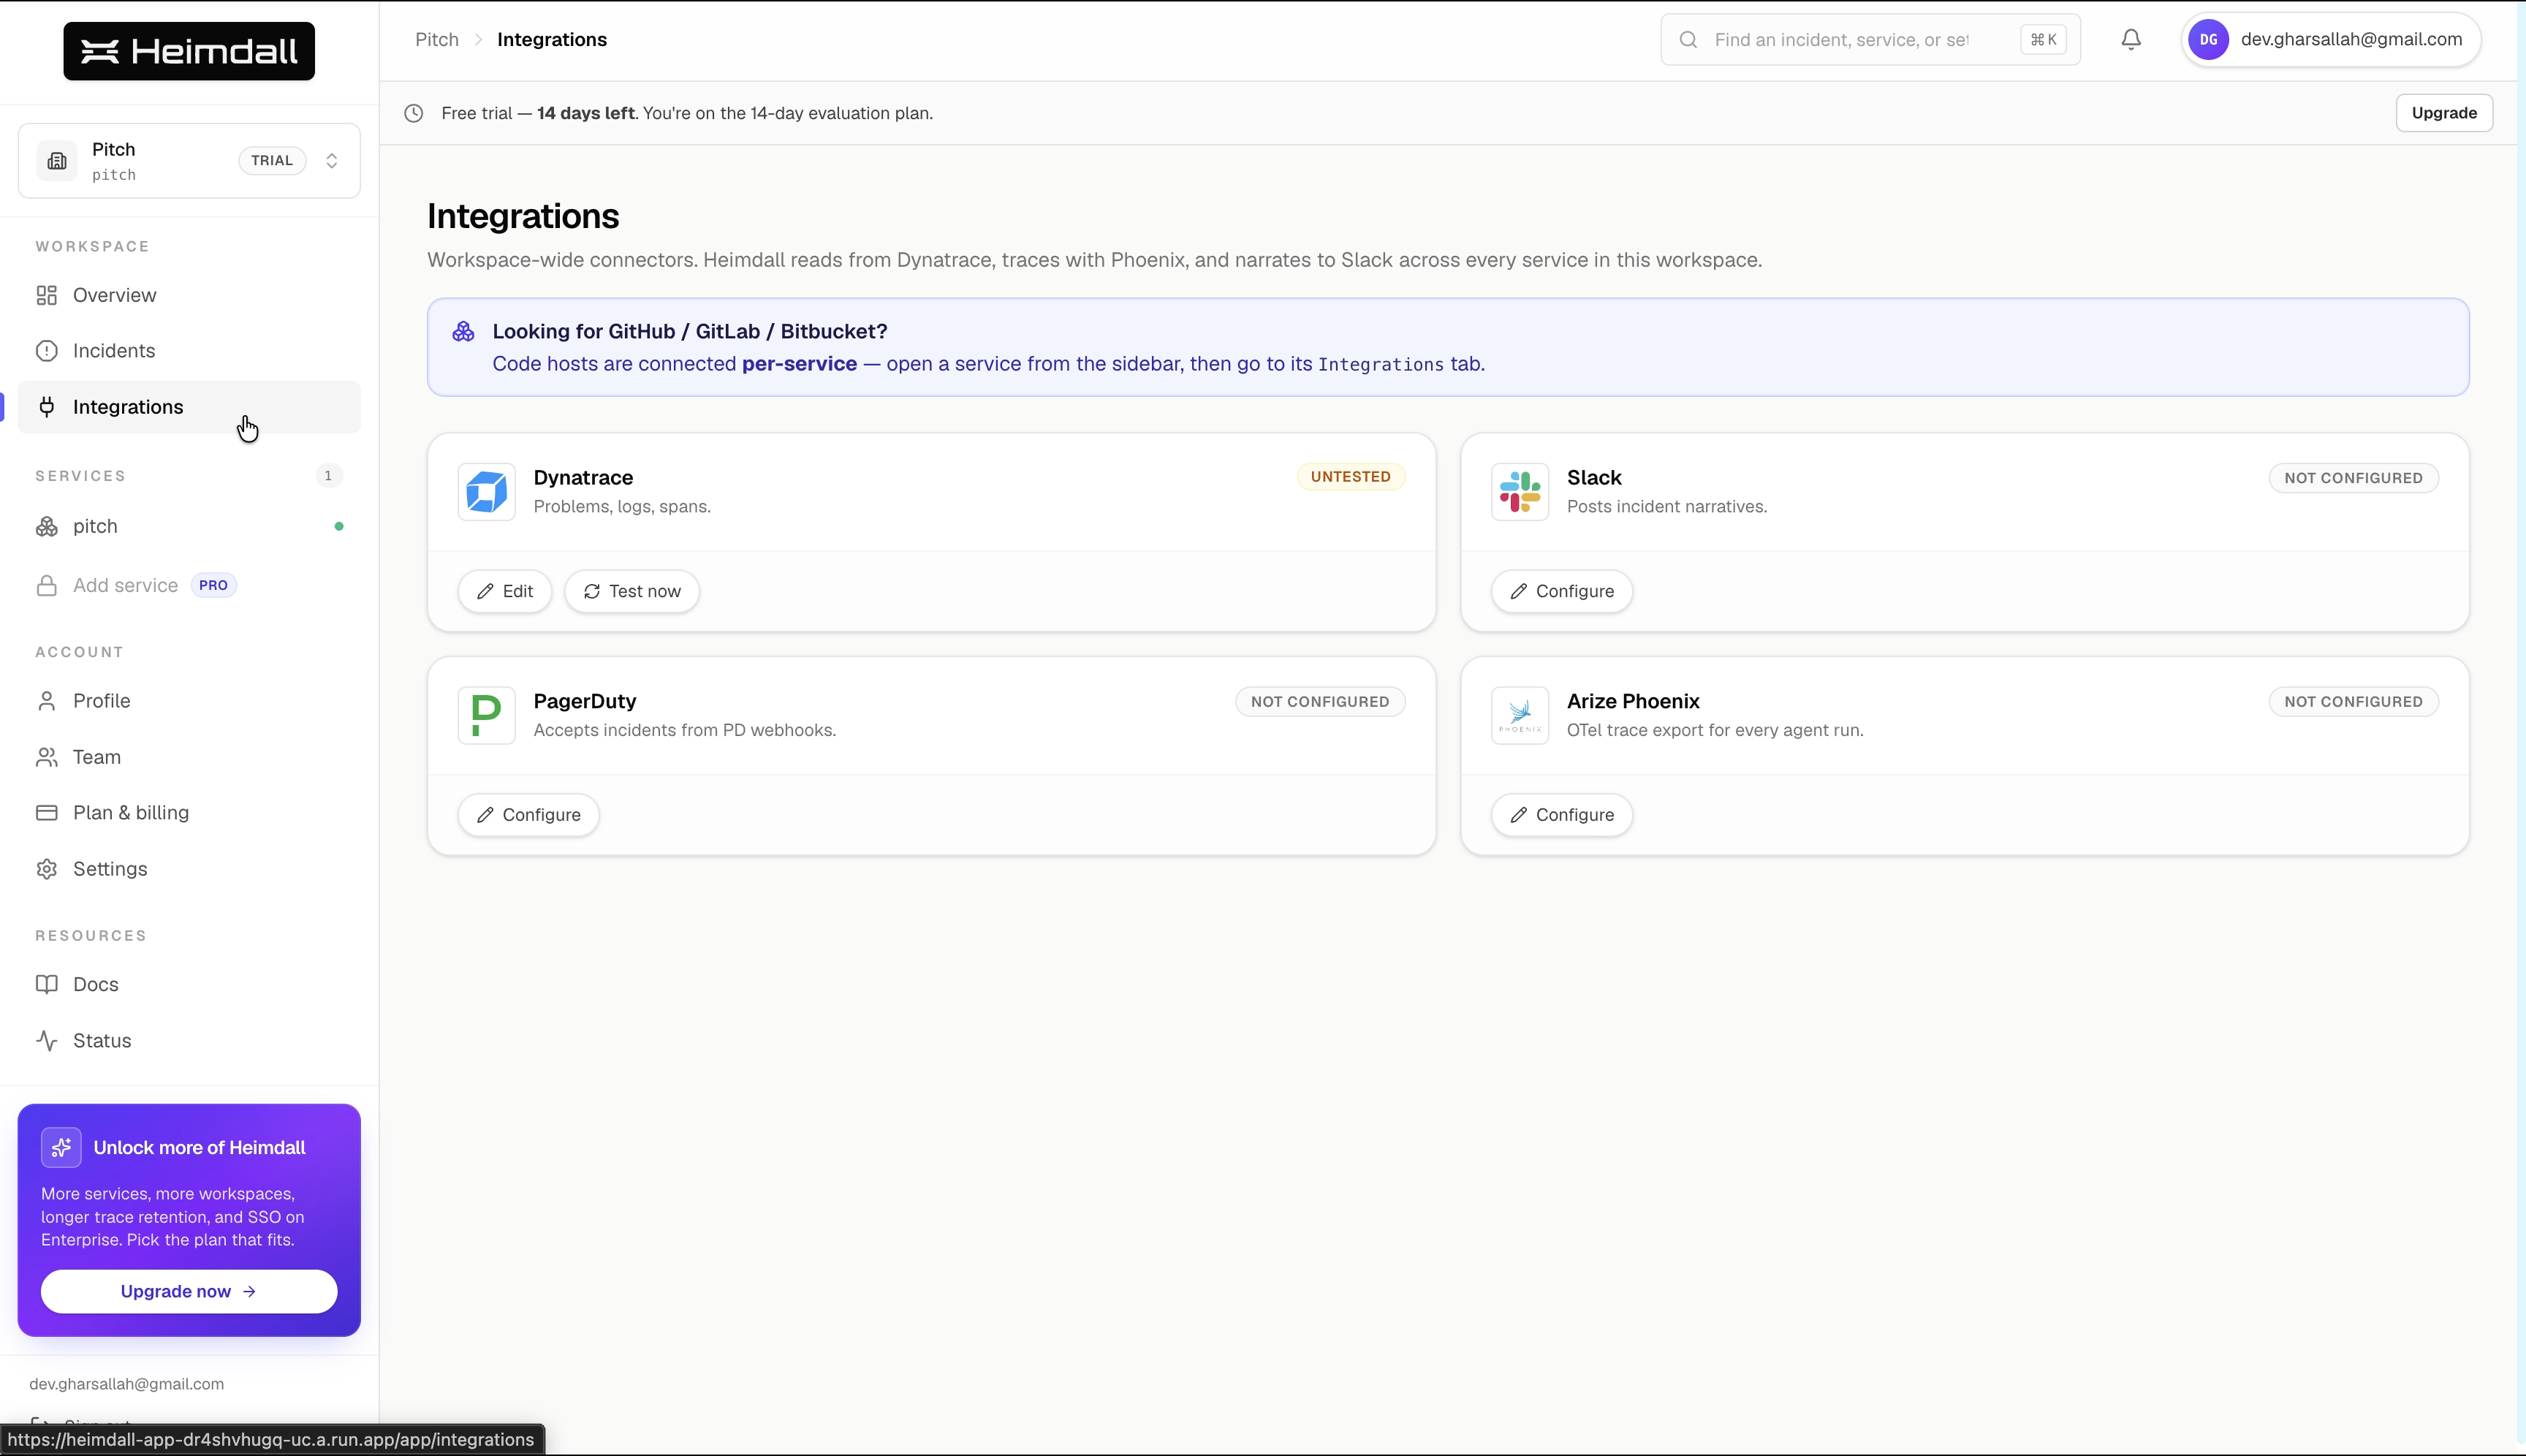
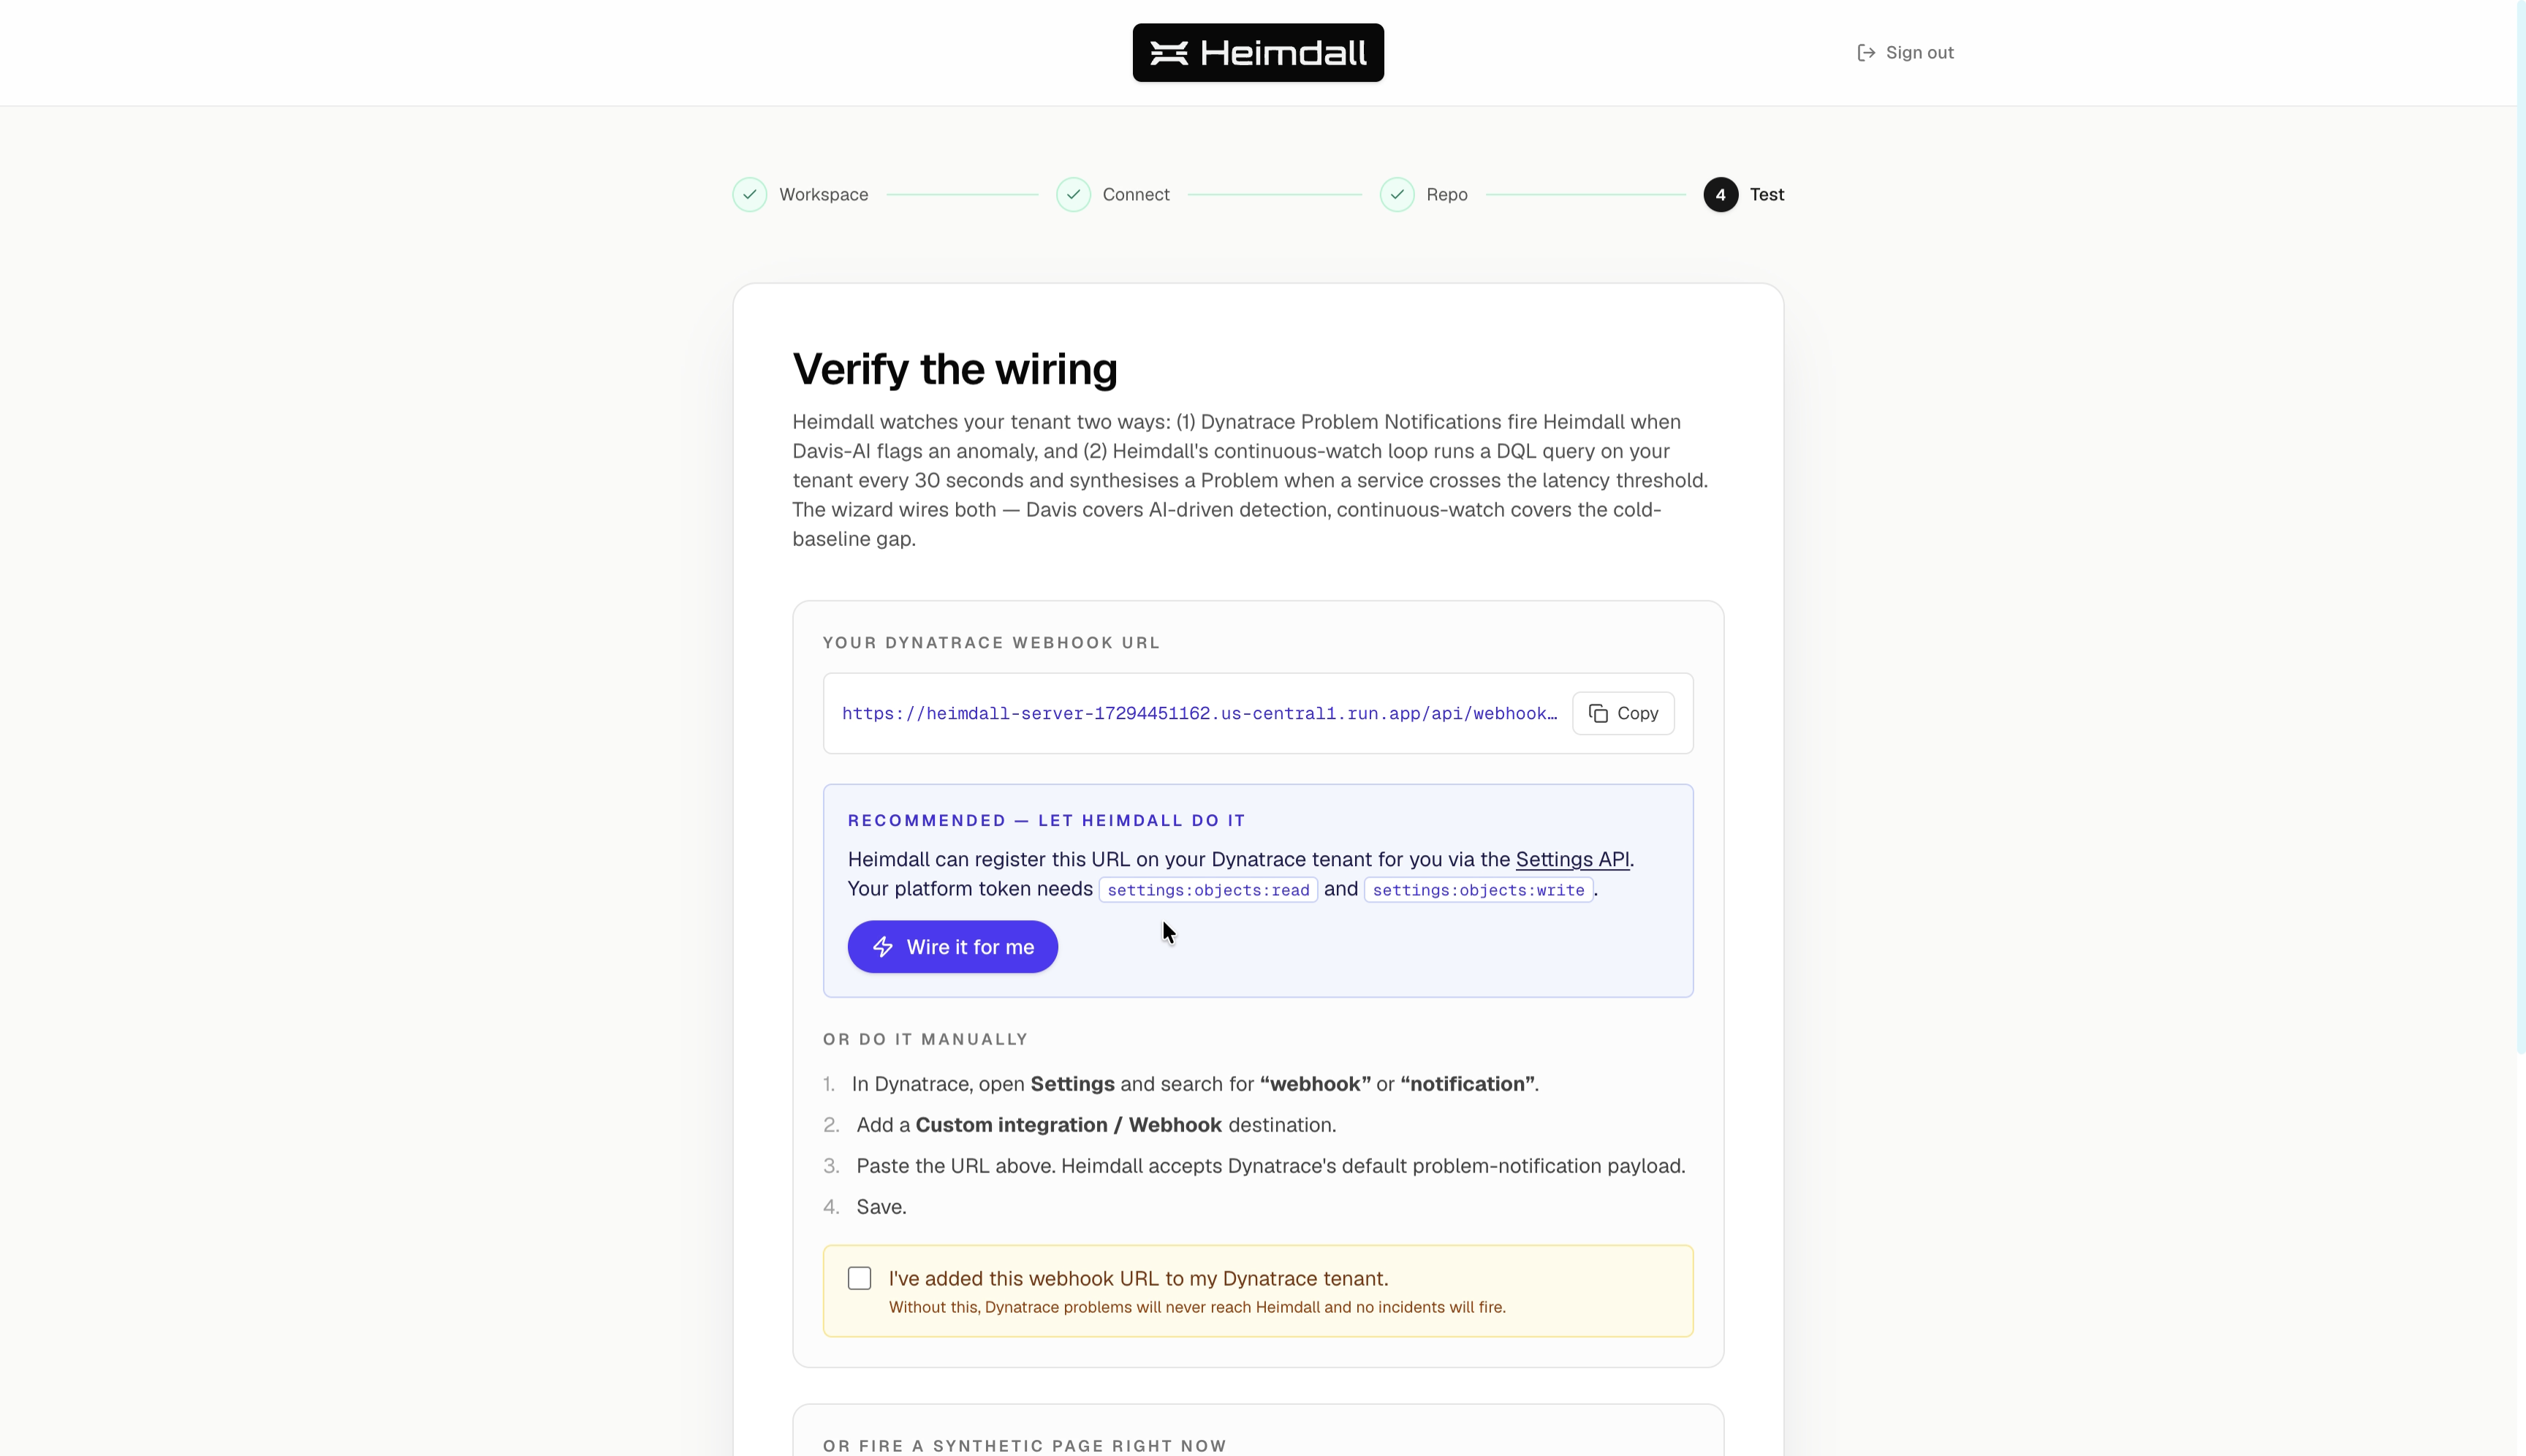
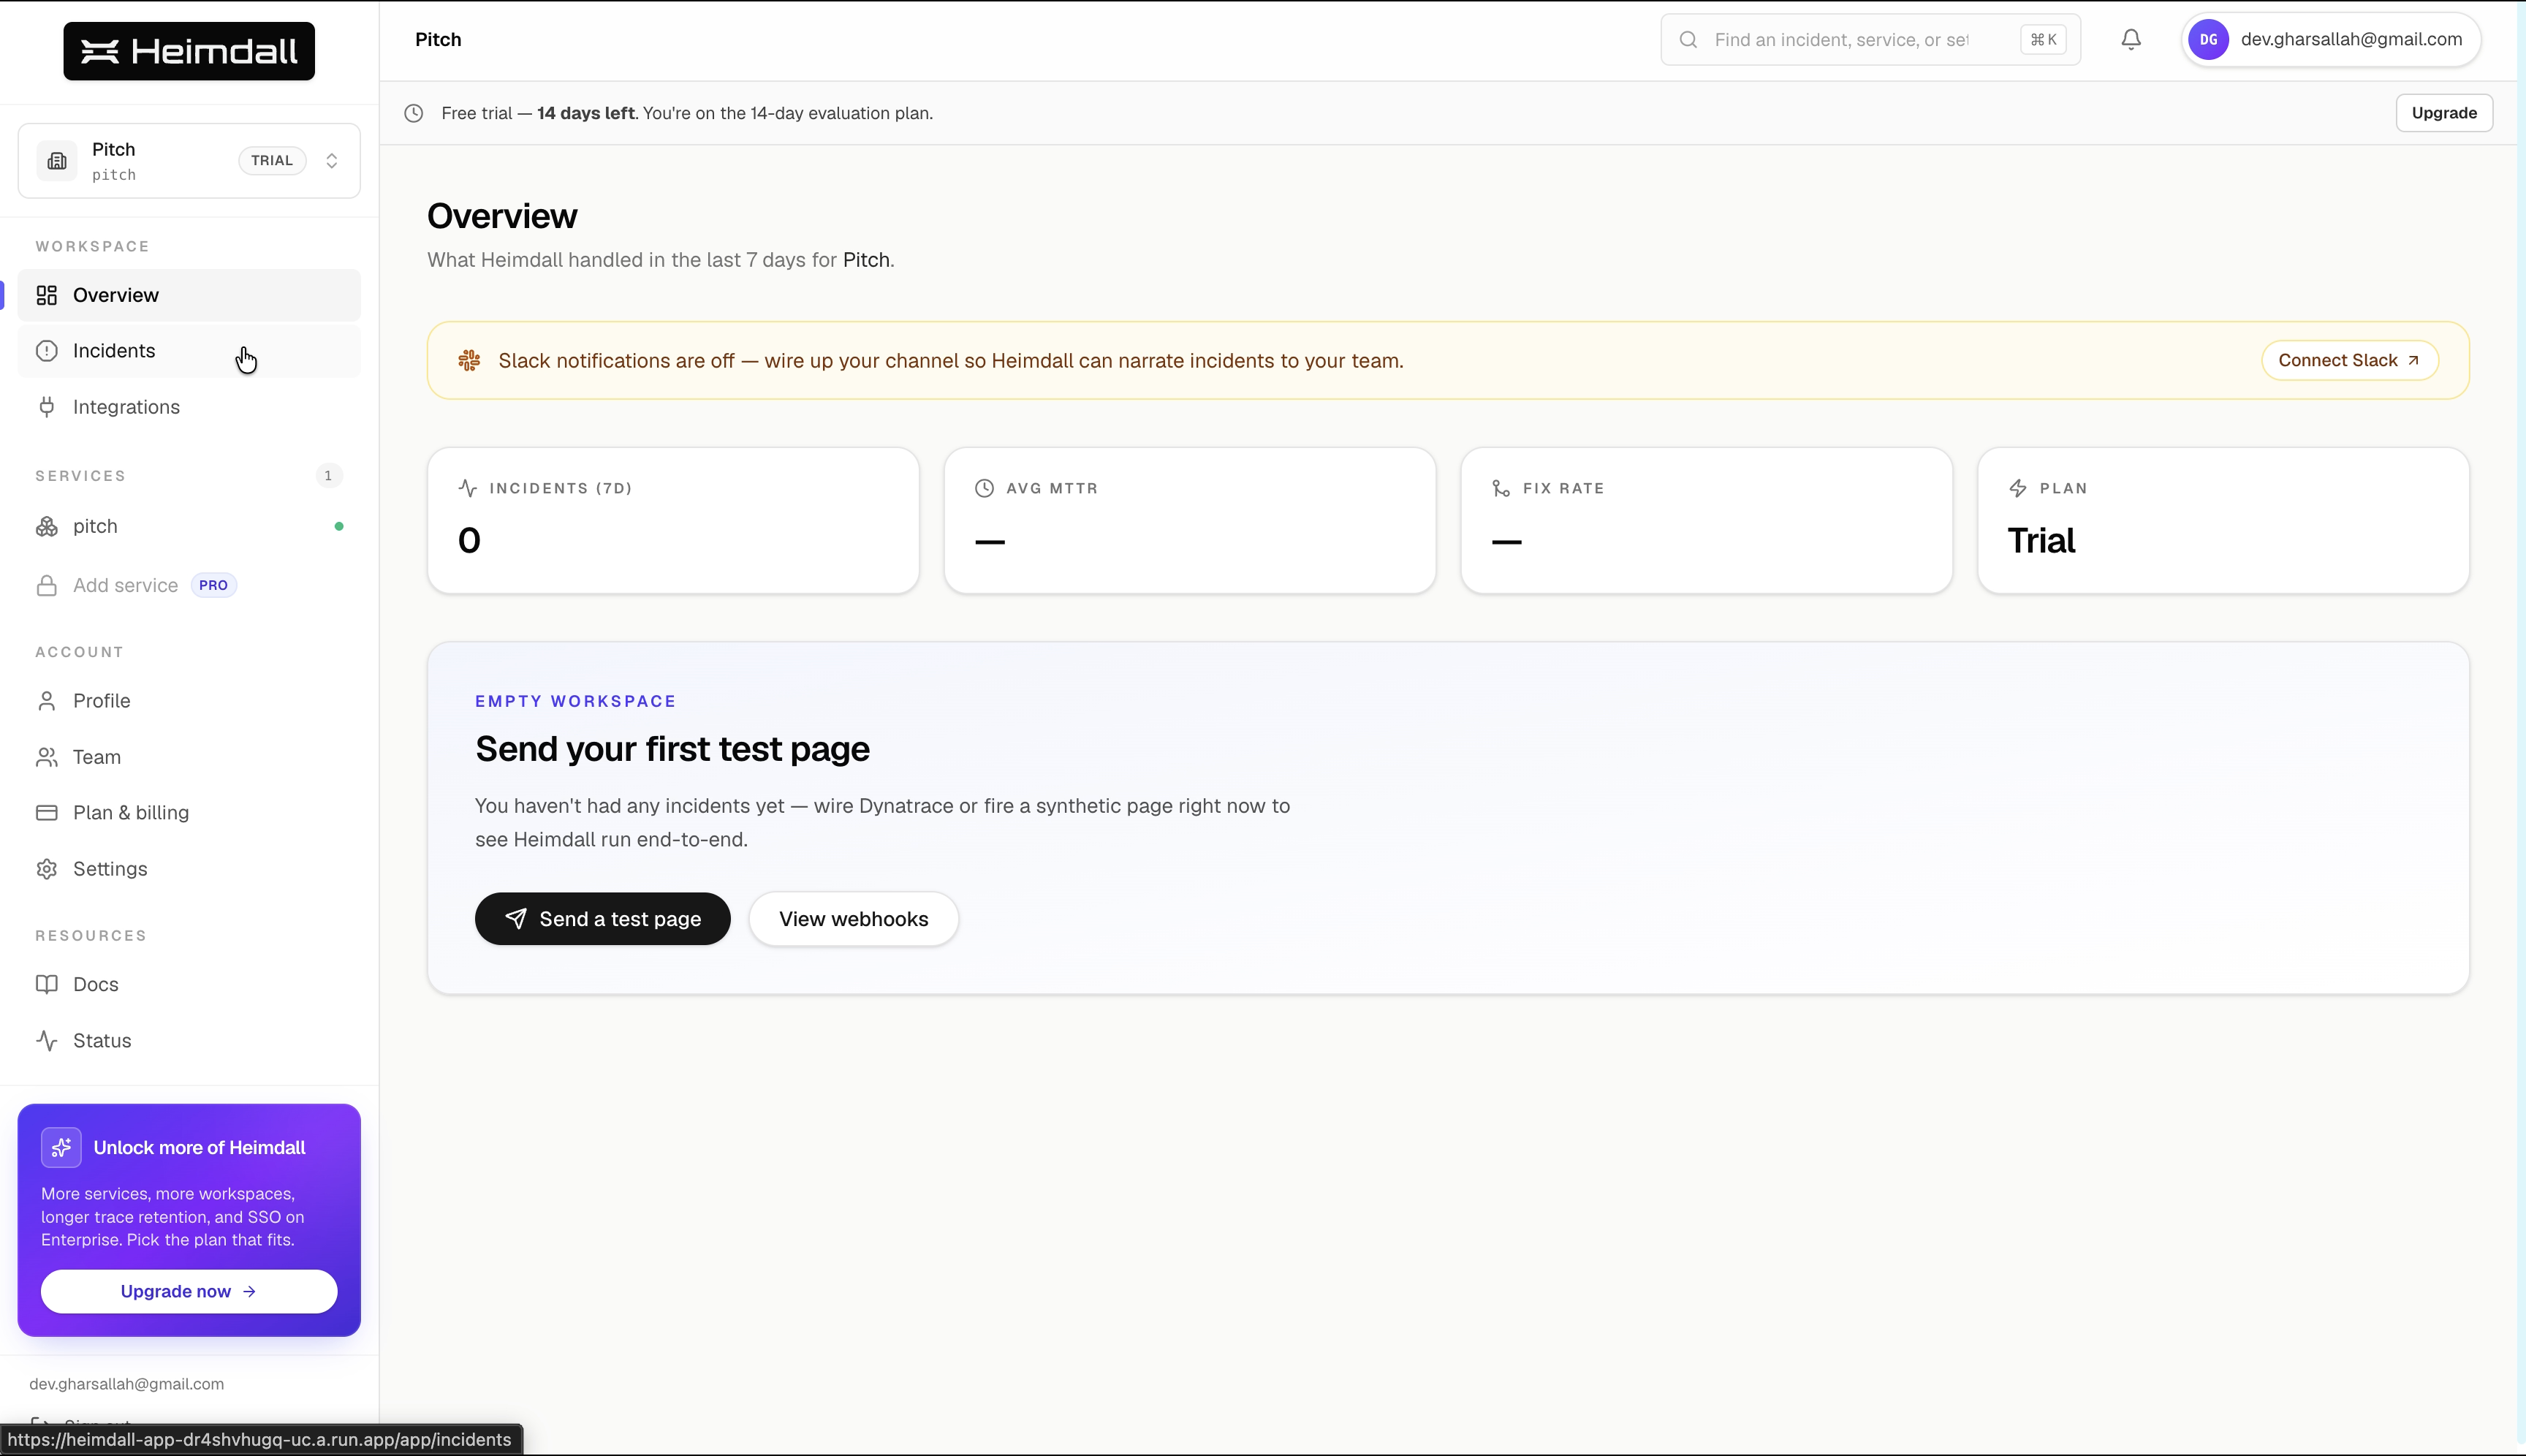
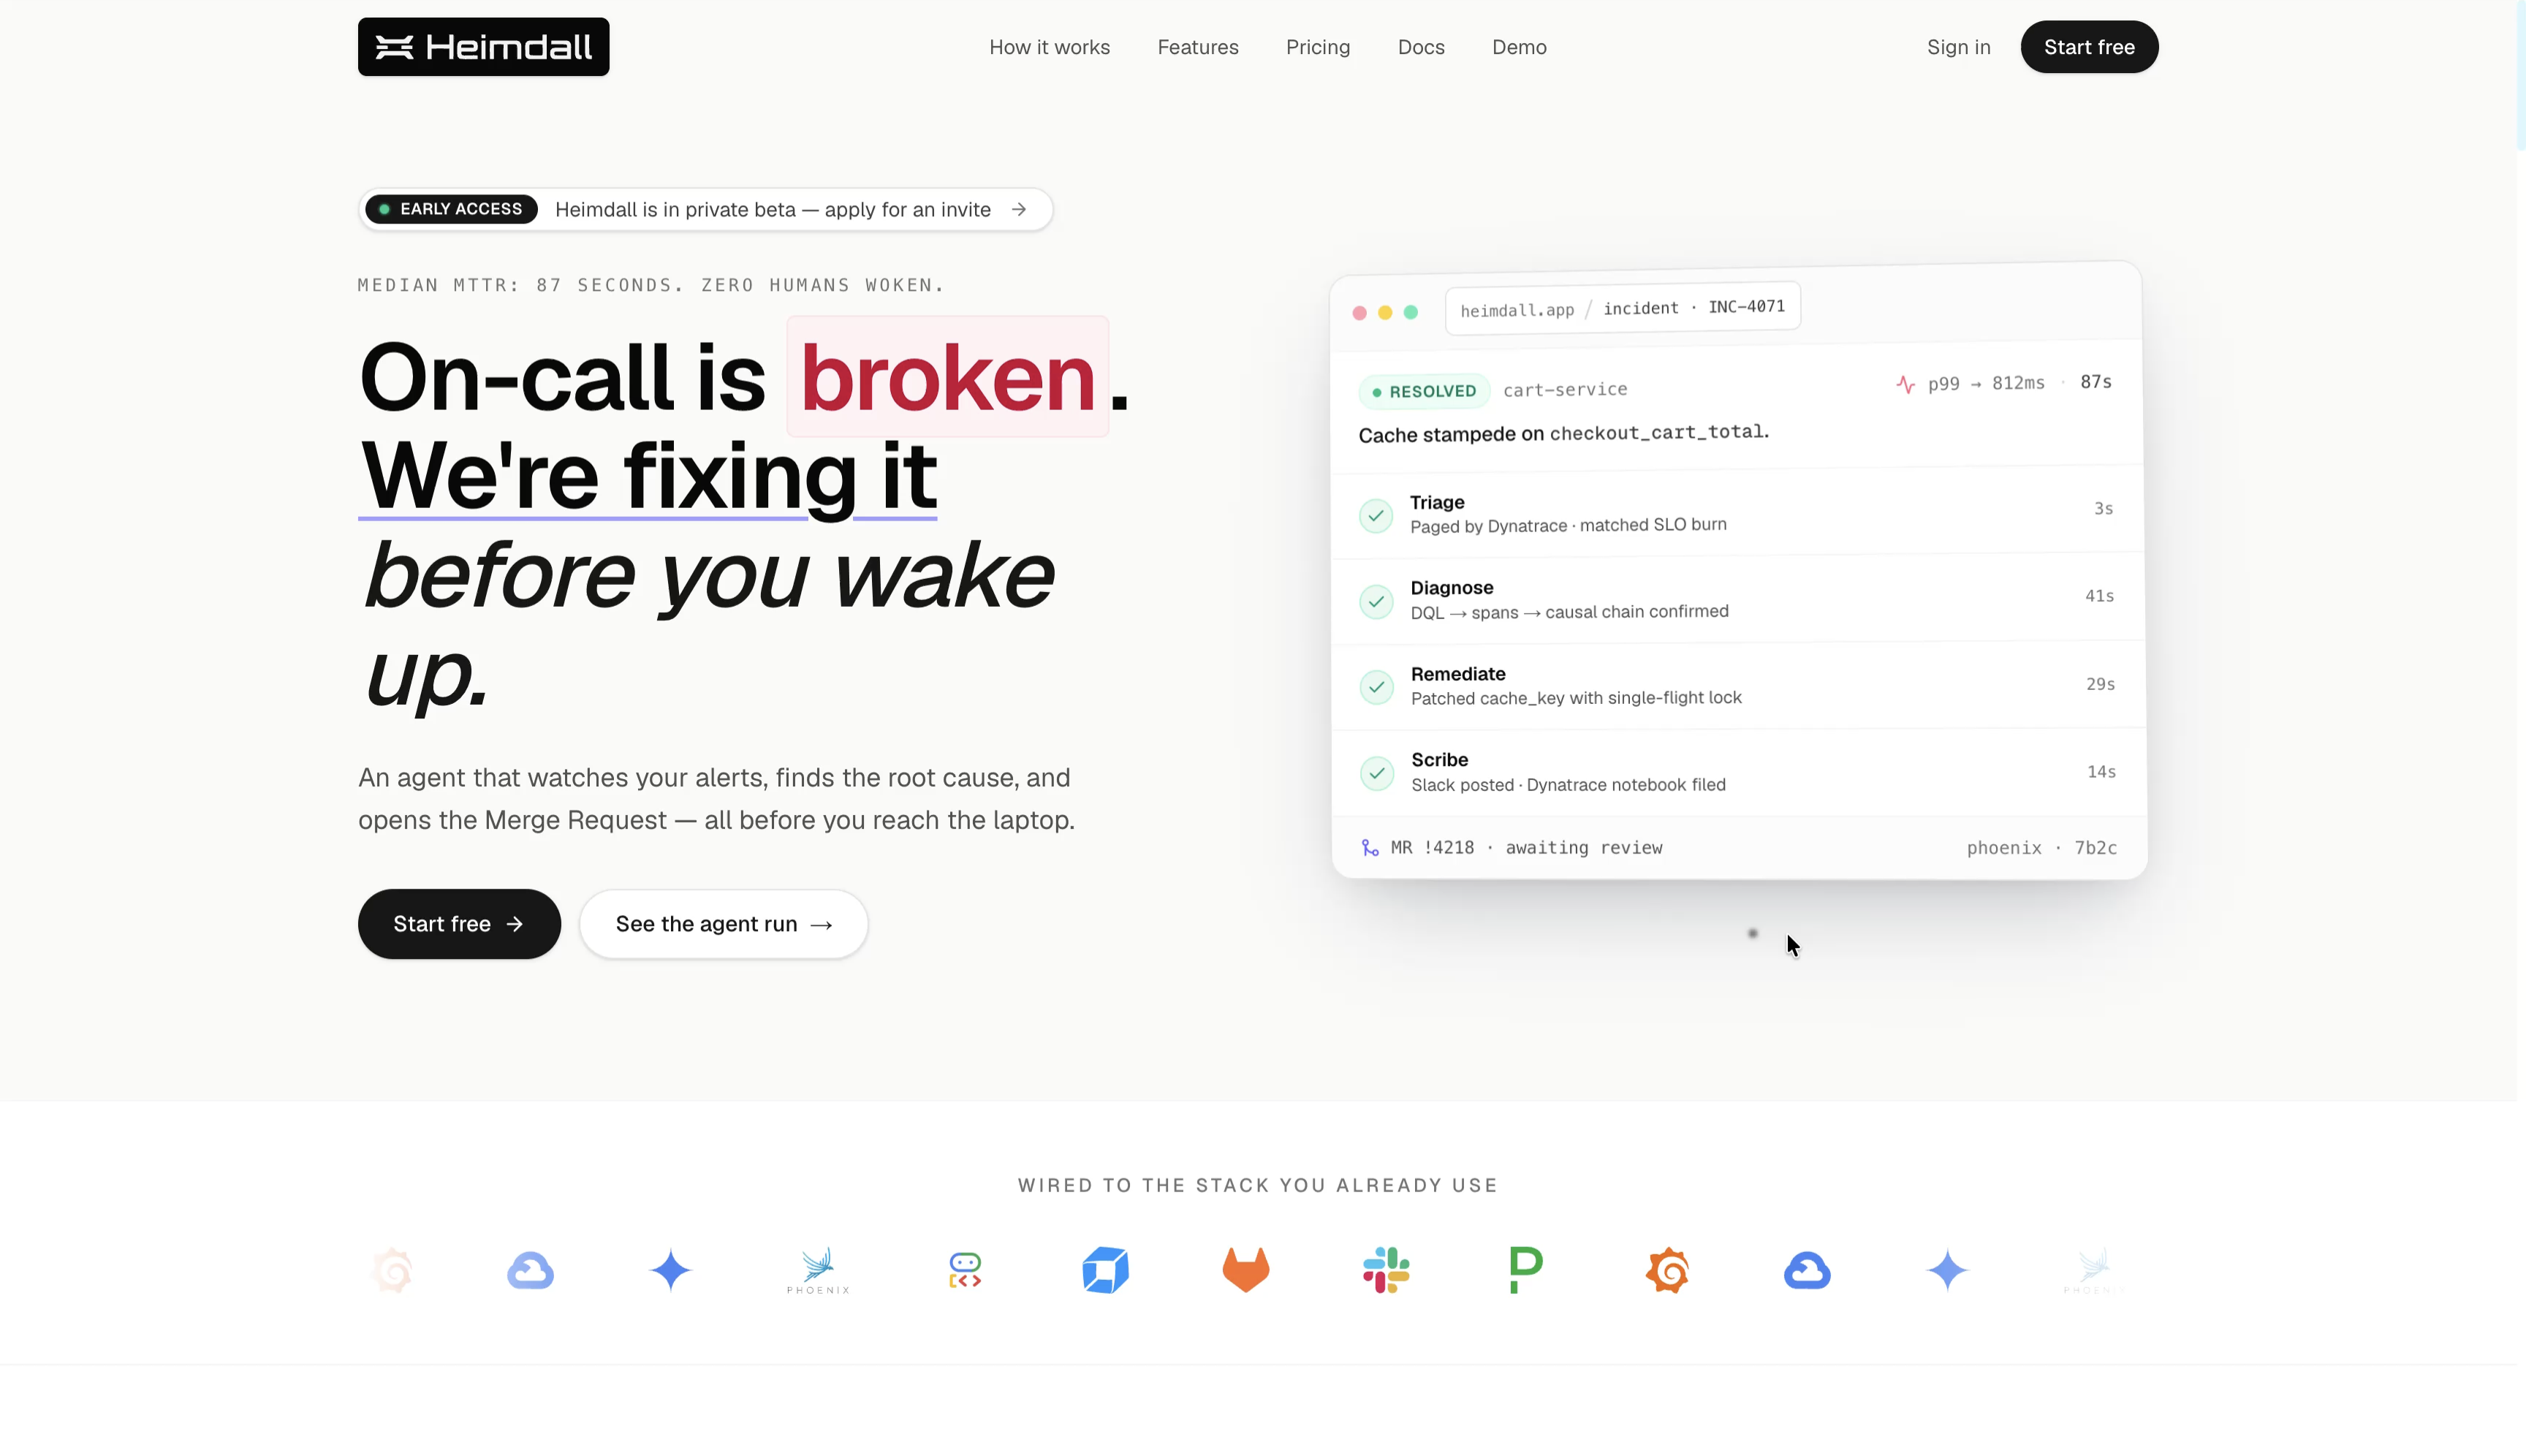
Heimdall is an autonomous SRE agent for Dynatrace. It runs as a multi-tenant SaaS — sign up, connect Dynatrace, optionally Slack, point it at the repository it should open pull requests against, click Wire it for me. From that moment on:
Continuous watch. Every 30 seconds Heimdall polls the customer's Dynatrace tenant through the official
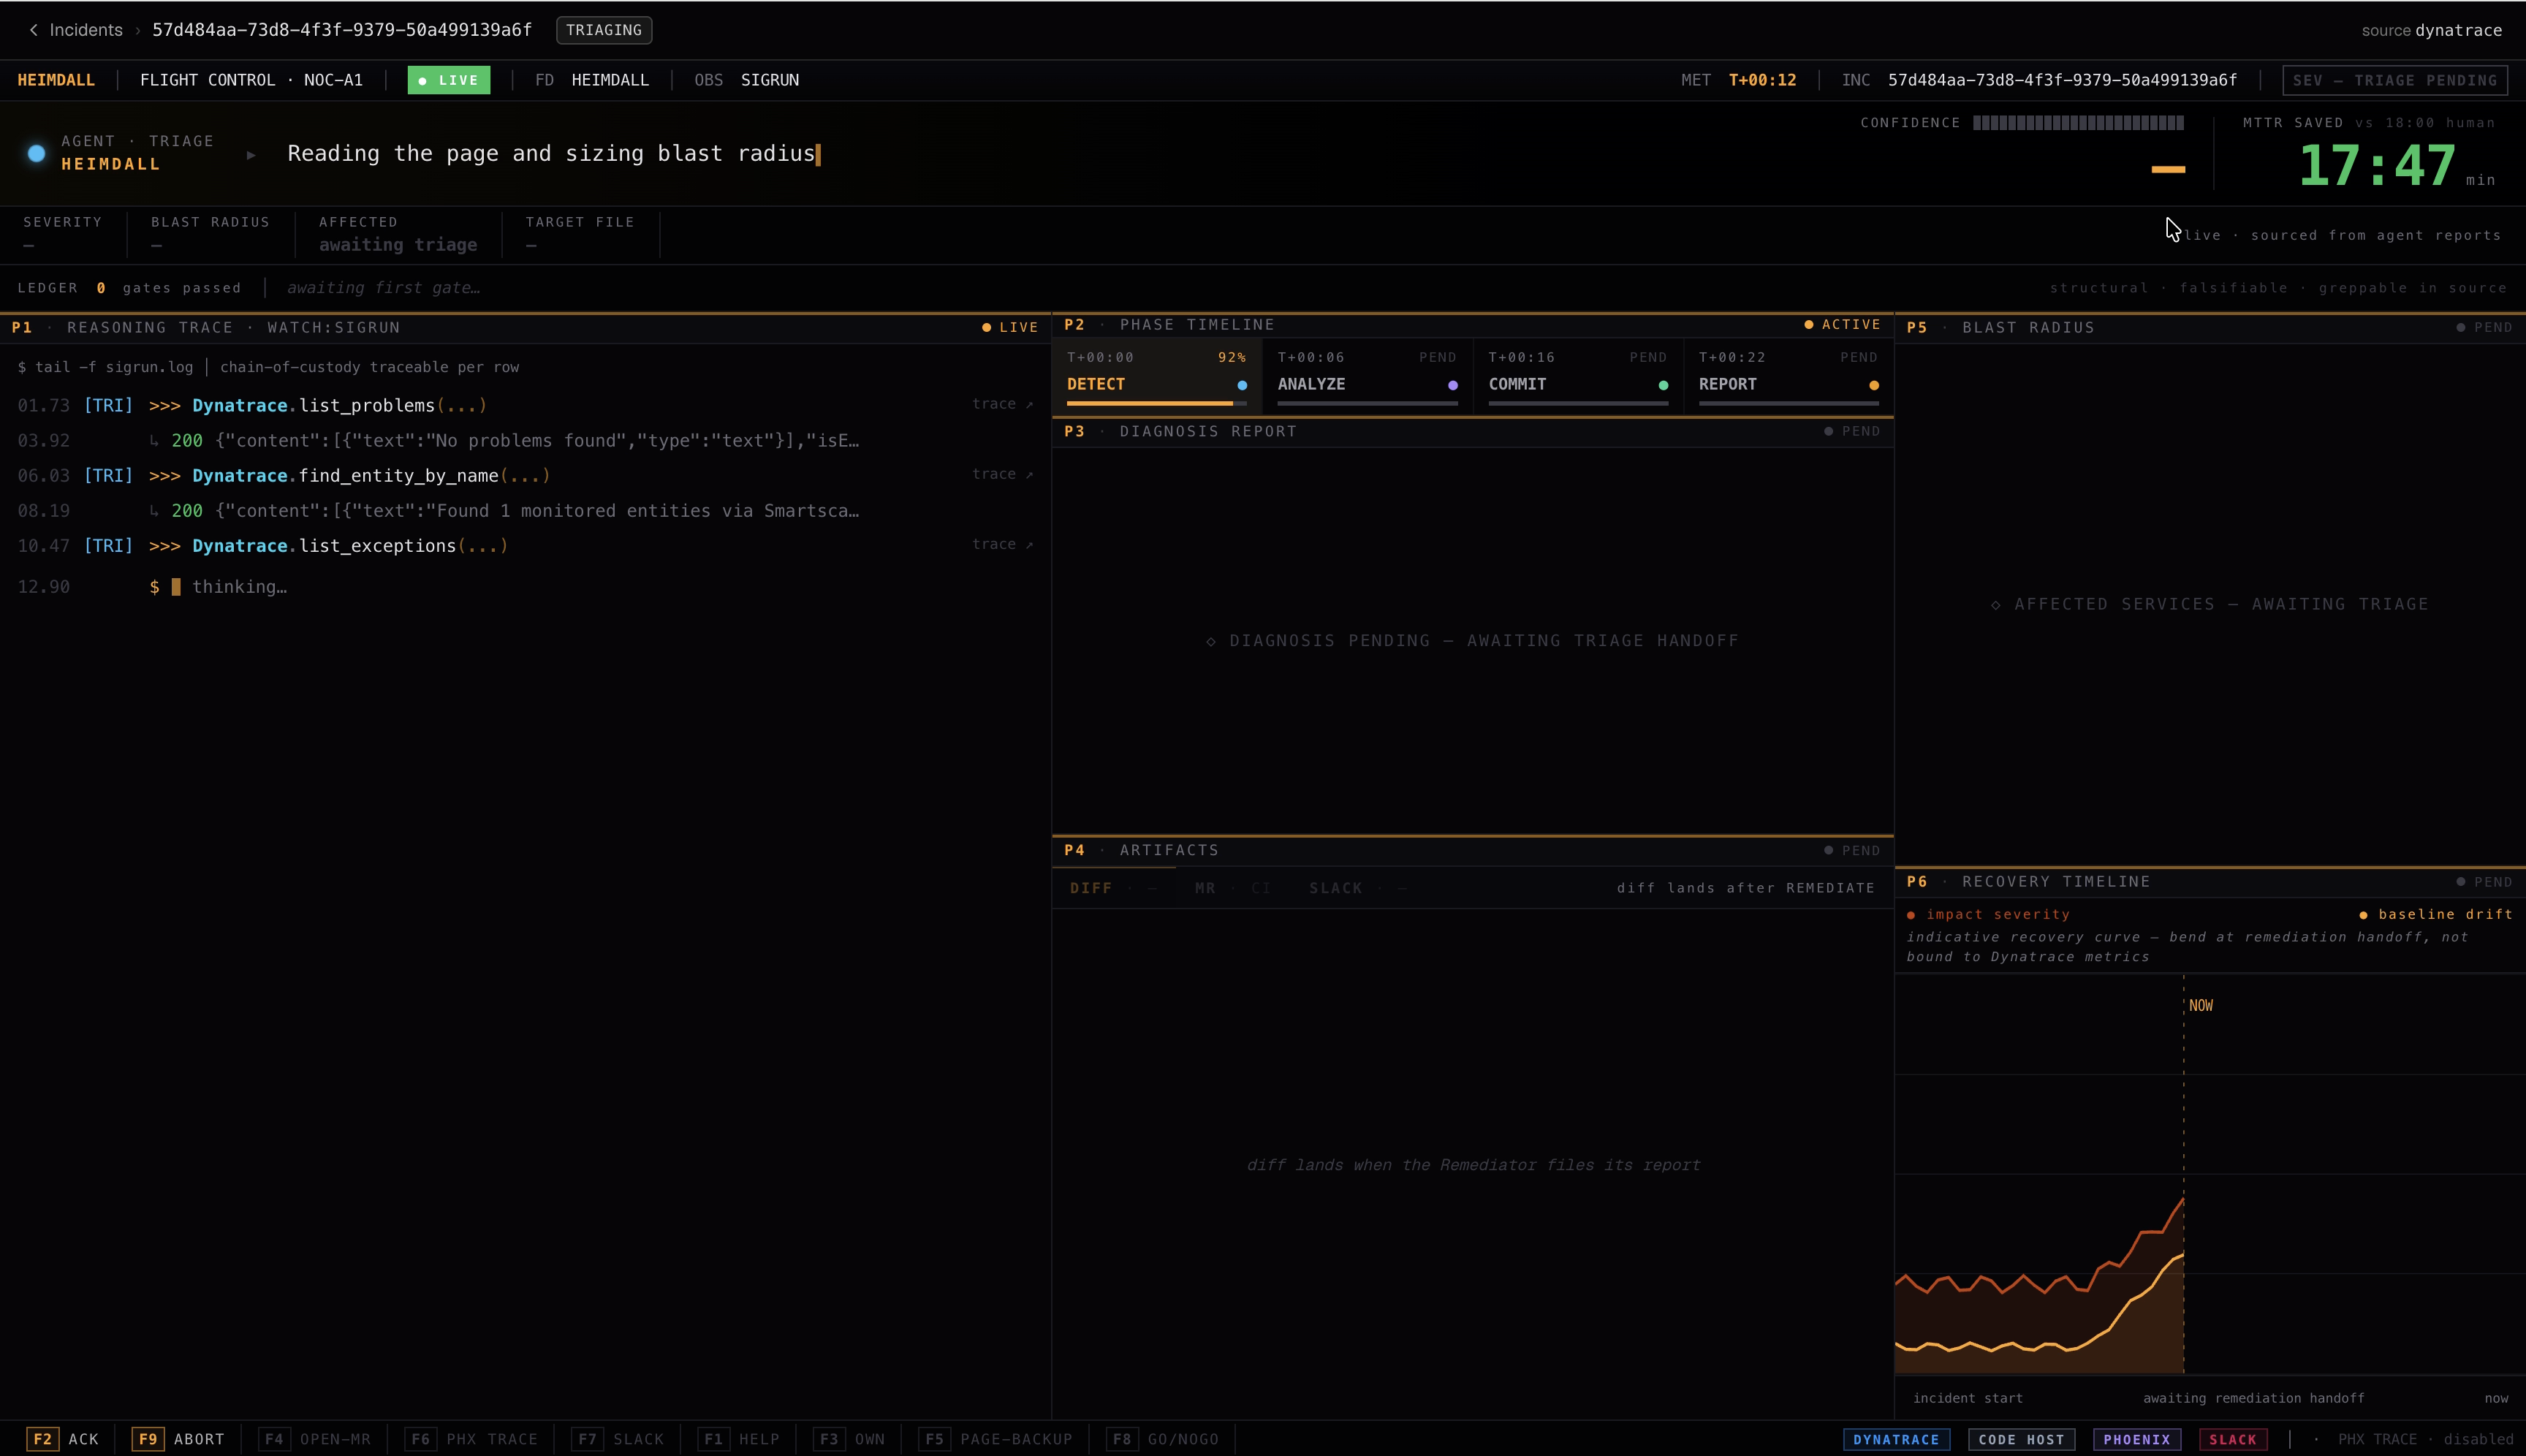
dynatrace-oss/[email protected]server, running a real DQL query against the spans bucket:fetch spans, from:now()-3m | filter service.namespace == "pitch" | summarize p99=percentile(toLong(duration),99), sample_count=count(), by:{service.name}. When p99 crosses the threshold with a real sample population, Heimdall synthesizes a Dynatrace-shaped Problem Notification and feeds it through the same ingest path Davis-AI would use on enterprise tiers.Multi-agent diagnosis. An ADK + Gemini pipeline runs in sequence: Triage → Diagnose → Remediate → Narrate. The diagnostician calls
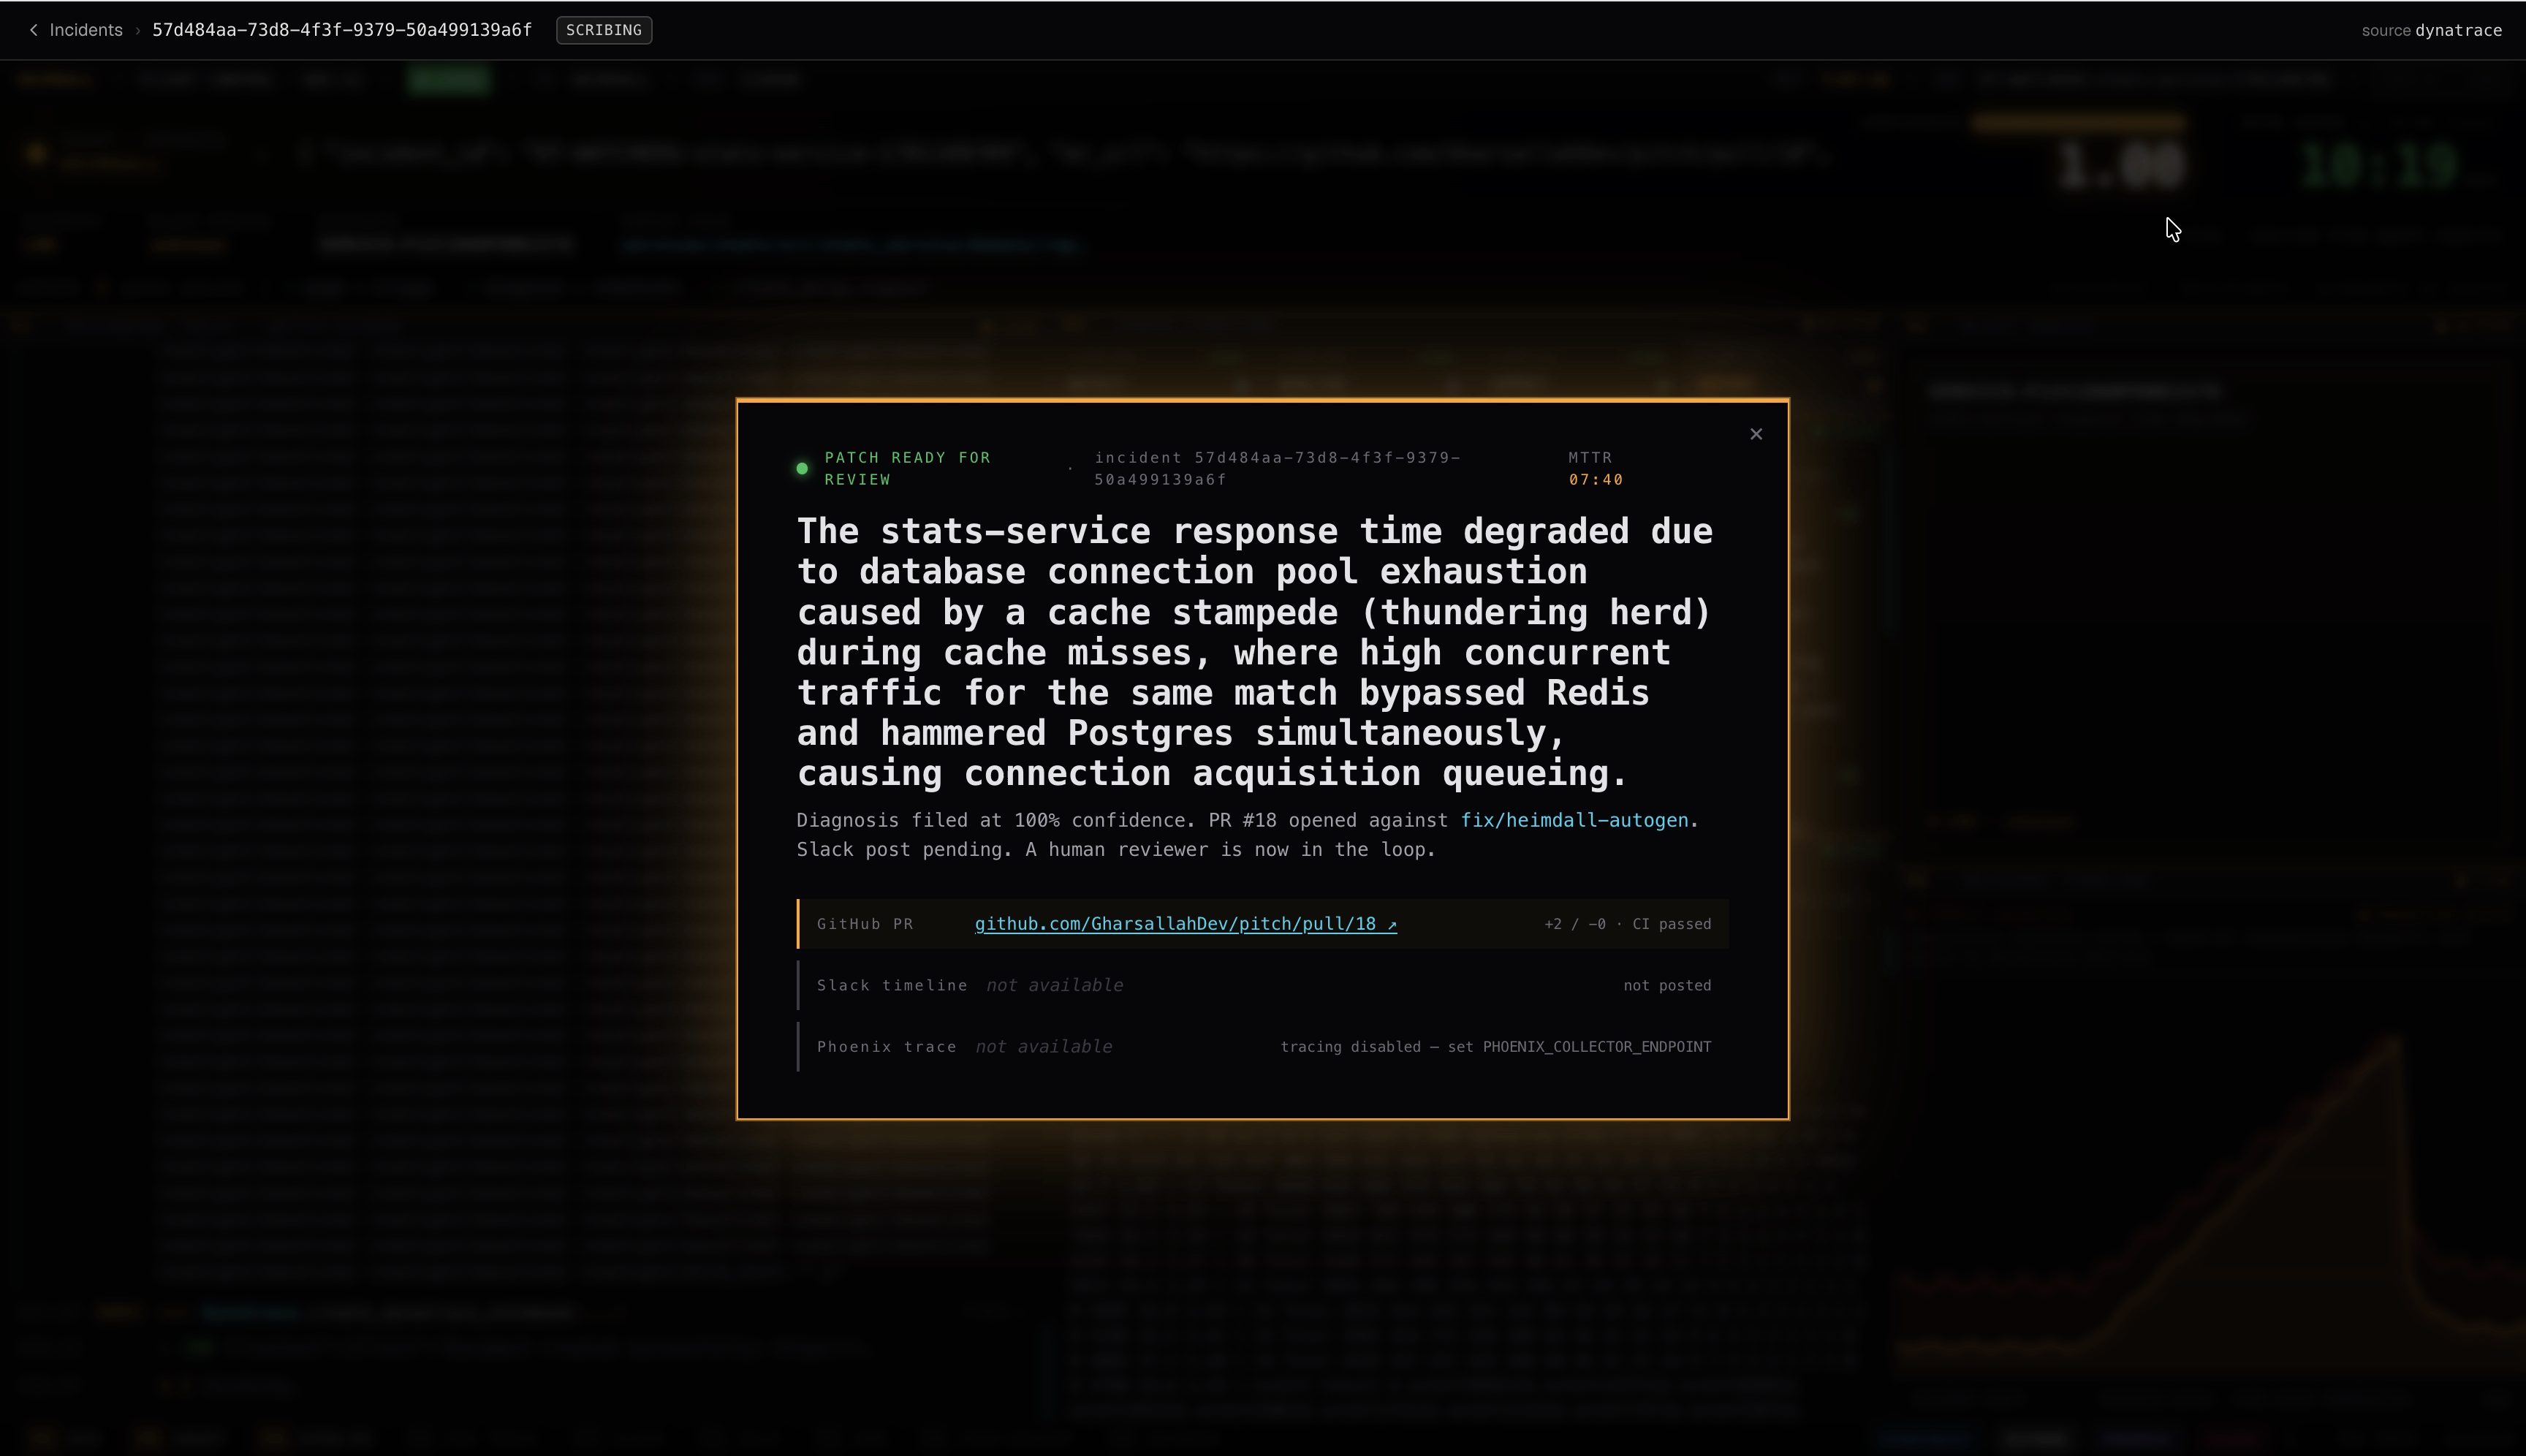
find_entity_by_name,list_problems,execute_dql,chat_with_davis_copilot, then pivots to the code host (GitHub/GitLab/Bitbucket) forlist_repository_tree,search_blobs,read_file. No mocks. Every tool call is real.Real pull request, real evidence. The remediator opens a branch, writes the patch and a load test that reproduces the original failure, and opens the merge request with cited evidence inline in the diff — the DQL query that proved the issue, the load test trace, Davis CoPilot's own analysis attached as a comment.
Audit trail. The scribe files a Dynatrace Notebook on the customer's tenant for the on-call human, posts to Slack, and writes a structured timeline. The PR is never auto-merged — humans always sign off.
End-to-end: page → DQL → diagnosis → real pull request → human gate, in 5–8 minutes.


How we built it
The agent core. Python · Google Agent Development Kit (ADK) · Vertex AI Gemini 3.5 Flash · the official dynatrace-oss/dynatrace-mcp MCP server (we deployed it as-is on Cloud Run — zero forks, zero custom tools). Four ADK LlmAgents coordinate through ADK's session state — TriageReport → DiagnosisReport → RemediationReport → IncidentNarrative — so each agent's prompt is fed the previous agent's typed output.
The watchdog. A separate asyncio loop in the FastAPI server (agent/server/dt_watchdog.py) polls the customer's tenant every 30s via a stateless streamable-HTTP client we wrote against MCP protocol version 2024-11-05. When degradation crosses threshold it synthesizes a payload that exactly matches Dynatrace's default Problem Notification template, then hands it to the same parse_dynatrace → _start_tenant_incident ingest path used by real Davis webhooks. Downstream code never knows whether the incident came from Davis or the watchdog.
The webhook auto-wire. When the user clicks Wire it for me in the onboarding wizard, Heimdall calls the Dynatrace Settings API with the saved access token to look up the customer's Default alerting profile, then POST /api/v2/settings/objects with a builtin:problem.notifications payload pointing at our per-tenant webhook URL. Idempotent — if the webhook already exists, we return its existing objectId instead of creating a duplicate. This is the bridge that lets Davis-AI fire Heimdall directly on enterprise tenants without anyone touching the Dynatrace UI.
The customer platform. PITCH is five FastAPI microservices on Cloud Run — gateway BFF, stats, catalog, leaderboard, comments. SQLAlchemy + asyncpg + Neon Postgres, Upstash Redis, all instrumented with OpenTelemetry (FastAPI, SQLAlchemy, HTTPX, and Redis auto-instrumentors) shipping OTLP/HTTP to the customer's Dynatrace tenant. Real Next.js streaming frontend on top, real World Cup 2022 final video on the live page. A failure-injection admin endpoint reproduces the cache stampede (60 concurrent un-cached fetches every 8s) on demand.
The SaaS chrome. Next.js 14 App Router · Supabase Postgres with RLS · Supabase Auth with multiple sign-up methods · per-tenant integration storage · real-time Supabase Realtime for mission-view phase updates. The whole thing is multi-tenant — every page is scoped to a workspace slug, every webhook URL is scoped to a tenant_slug/service_slug pair.
Stack at a glance.











Challenges we ran into
Every challenge below cost us at least an afternoon. Most cost two.
1. Trial Dynatrace tenants don't have what production tenants have. The hackathon tenant is OneAgent-free (OTel-only), so builtin:service.response.time is never populated — there's nothing for a metric event to threshold on. Logs ingest is gated behind a license the trial doesn't have, so OTEL_LOGS_EXPORTER=none is mandatory or every batch returns 402. Davis-AI needs days of baseline before it raises a Problem on its own. The watchdog was our answer to all three — DQL on the spans bucket bypasses every metric/license/baseline issue and gives us a deterministic 30-second detection time on day zero.
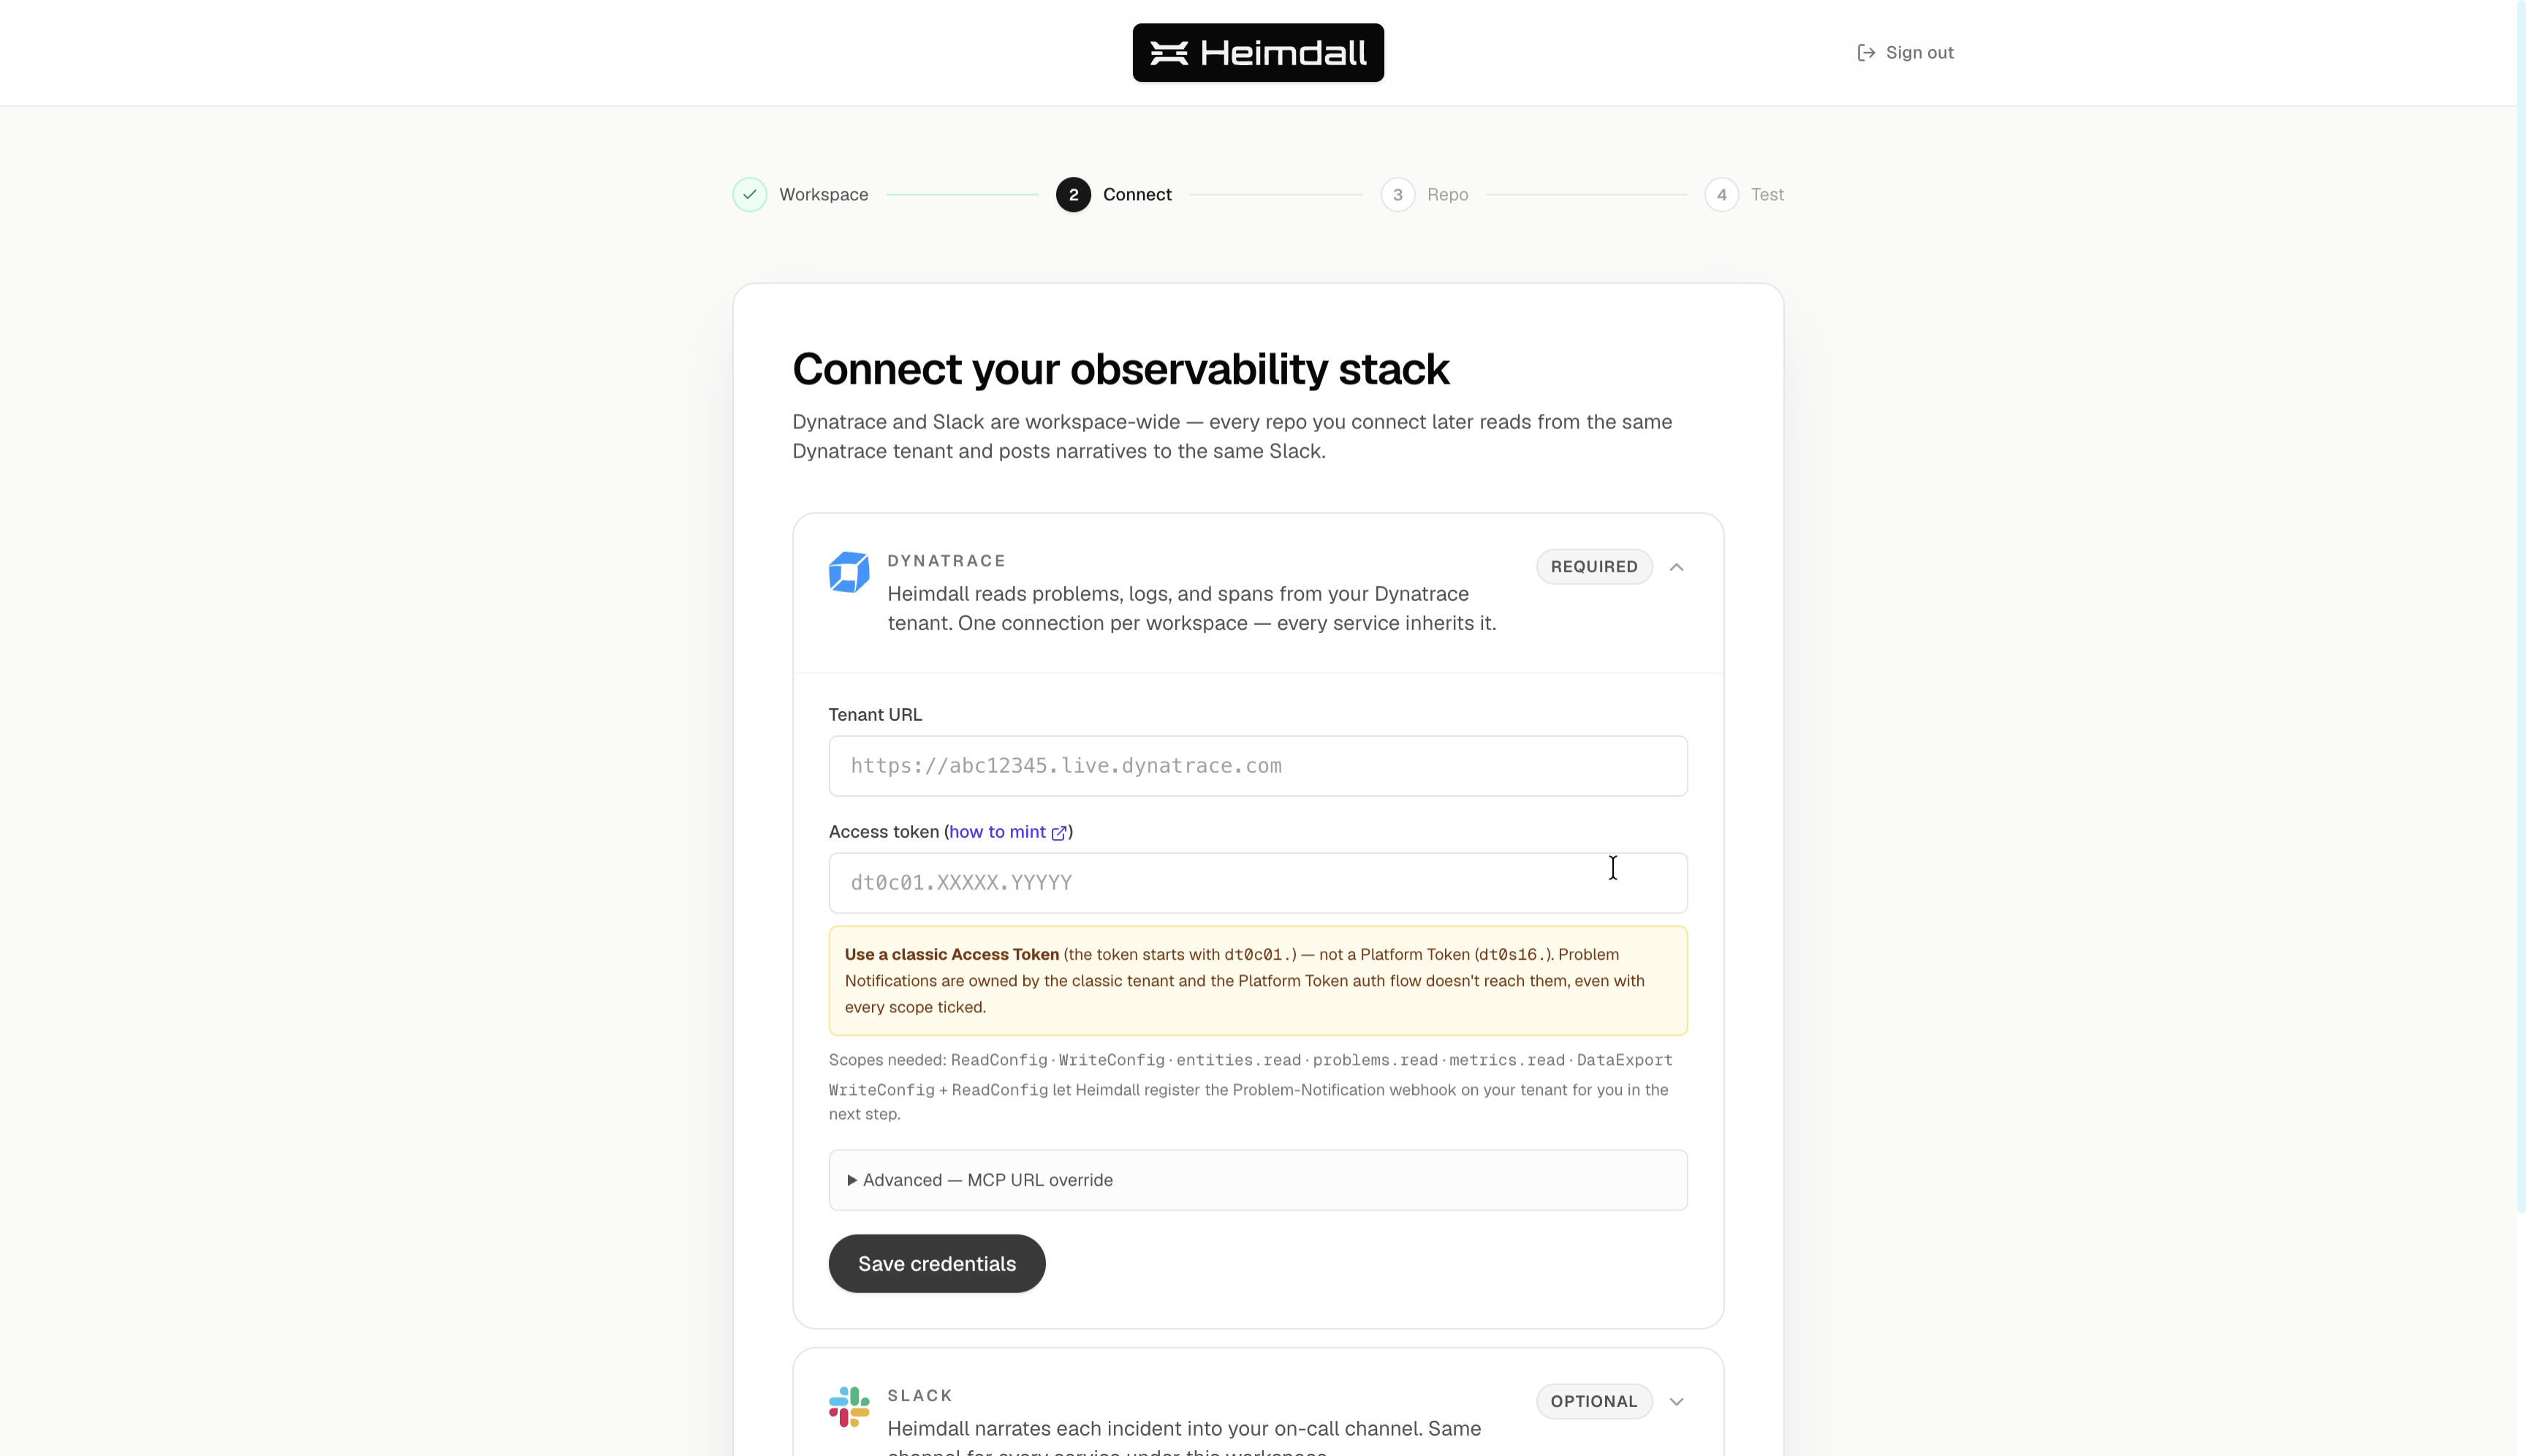
2. Platform tokens (dt0s16.…) can't write classic schemas. We initially asked users for a Platform Token in the wizard. They selected every scope possible — and the Settings API write to builtin:problem.notifications still returned 401. Reason: Problem Notifications are owned by the classic tenant (.live.dynatrace.com), which authenticates classic Access Tokens (dt0c01.…) only, even with platform-token equivalent scopes. We rewrote the onboarding copy to ask for an Access Token specifically, with an amber callout explaining the classic-vs-platform split. The auto-wire now succeeds on the first click.
3. The MCP transport is stateless in 2024-11-05. Every example we found online showed Mcp-Session-Id header round-trips. The official [email protected] server doesn't mint a session ID at all on that protocol version — initialize returns an SSE envelope with no header. Our first watchdog client looped forever raising "MCP server didn't return a session id". We rewrote the client to do a one-time initialize and then send each tools/call independently — no session tracking, no header round-trip.
4. Cloud Run autoscaling makes asyncio dedup unsafe. Default Cloud Run config let a second replica boot under load. Each replica ran its own watchdog with its own in-memory dedup cache. Result: two near-simultaneous incident mints for the same finding, one second apart, both producing real PRs. We capped --max-instances=1 for the server and added cross-instance dedup that queries Supabase for any open watchdog incident on the same (tenant, dt_entity_service) inside the dedup window before minting. Belt and braces.
5. Cloud Run revision rollovers kill background asyncio tasks. When we redeployed mid-incident, the new revision rolled, the old container got SIGTERM, and our asyncio.create_task(run_incident) died with it — the incident sat stuck in queued forever with no error. Fix: --min-instances=1 --no-cpu-throttling so the server doesn't scale to zero or get its CPU starved mid-run.
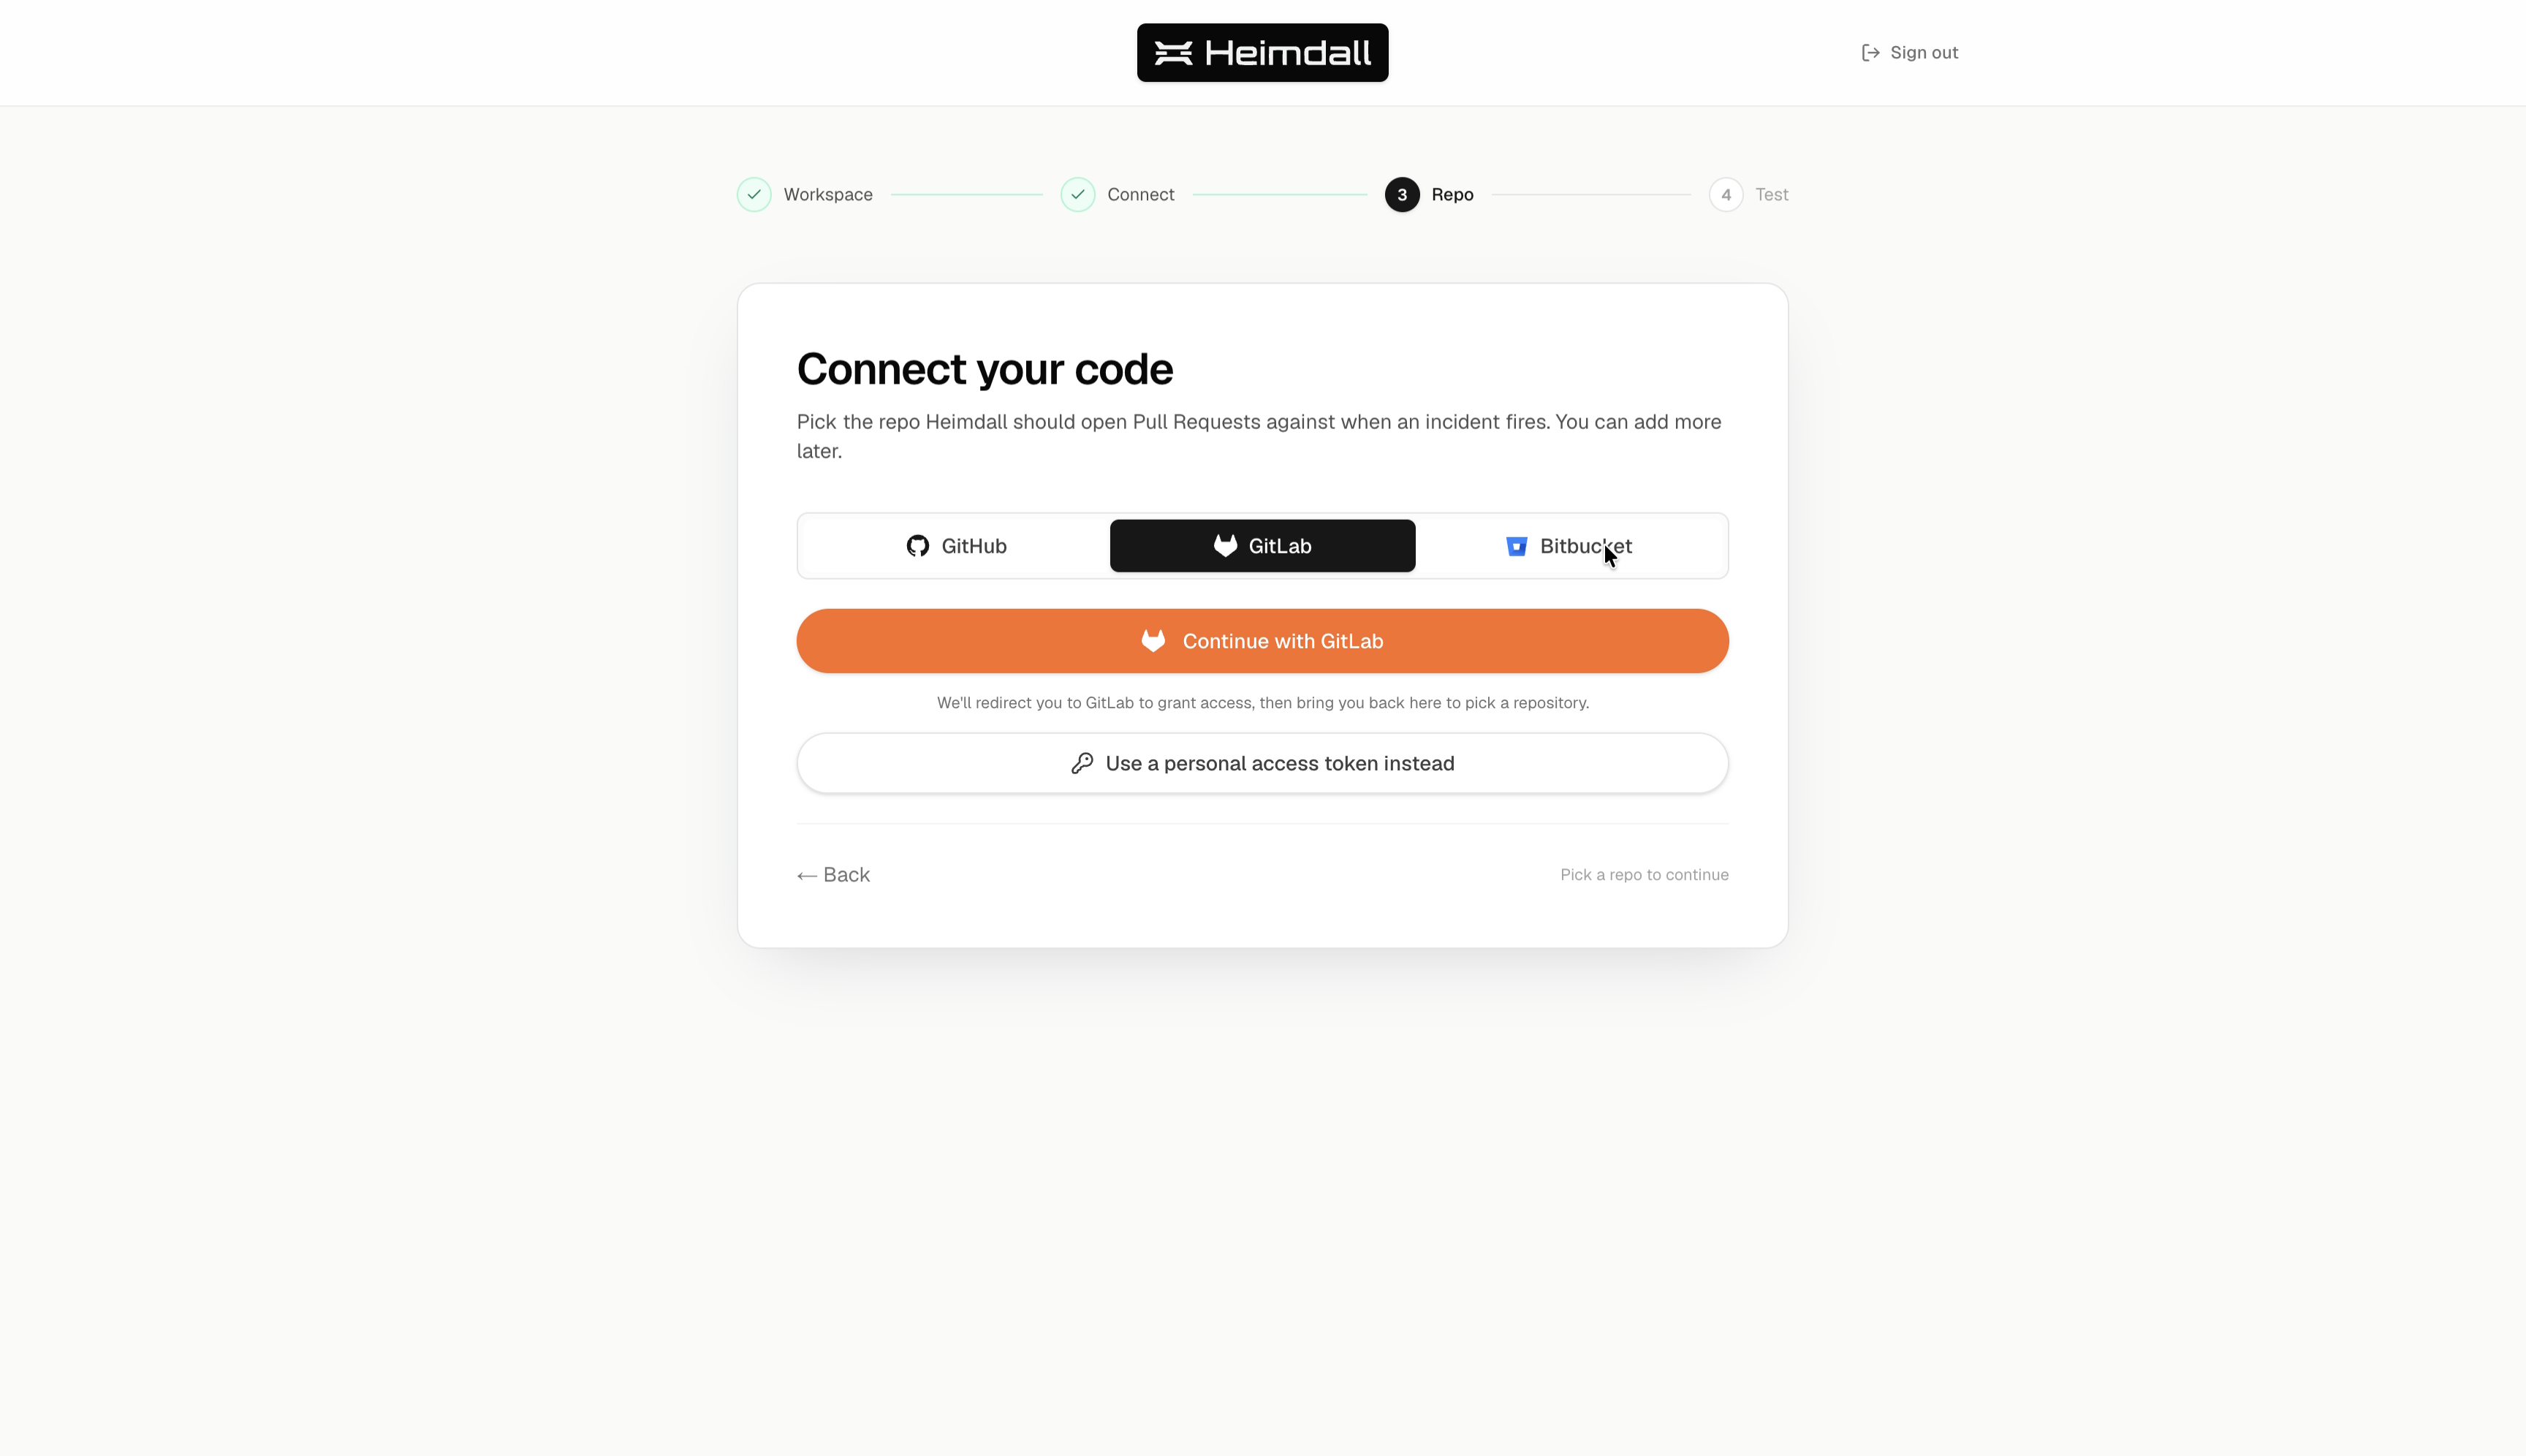
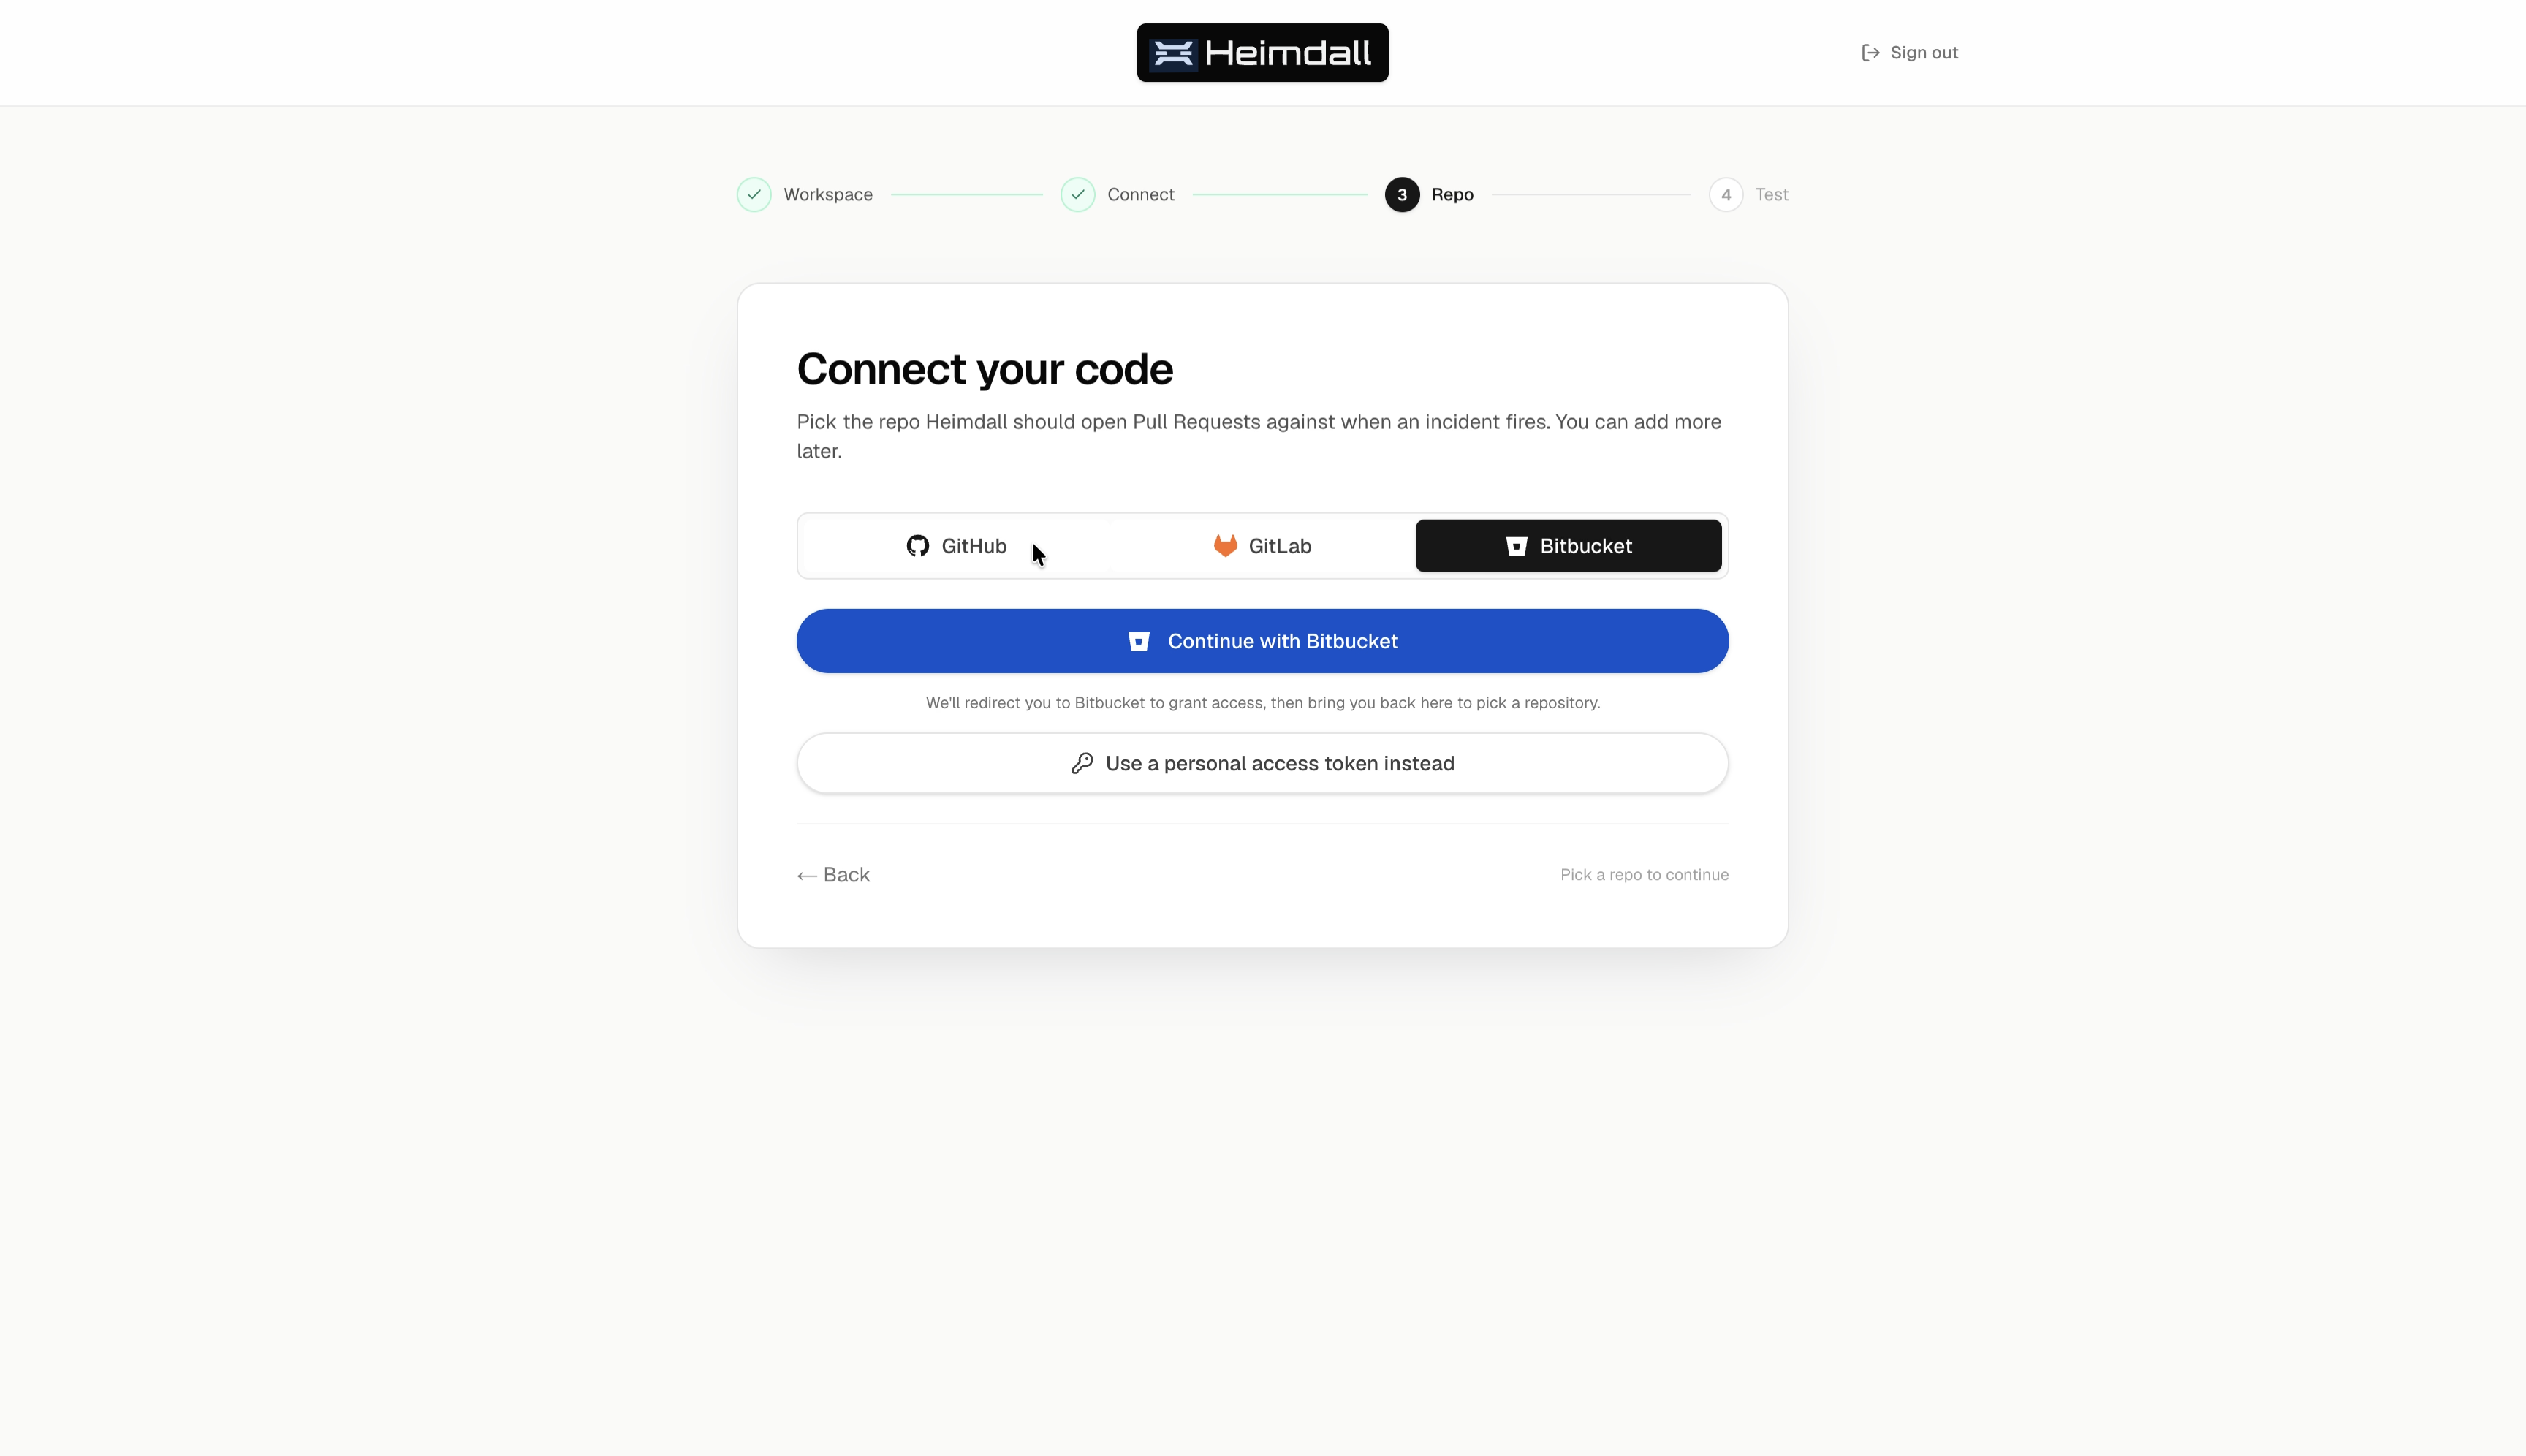
6. Supabase's autoRefreshToken: true races a cross-origin OAuth round-trip. During onboarding, the user signs up with GitHub via Supabase Auth, then clicks Continue with GitHub on the repo step to authorize the code-host integration via Heimdall's own OAuth app. While the browser was off at github.com for the second OAuth, Supabase's background JWT refresh timer fired, hit /auth/v1/token mid-redirect, got 400 "Refresh Token Not Found", and the SDK auto-signed-out the user before they ever made it back to Heimdall. We disabled autoRefreshToken, hardened safeGetUser to classify refresh-token errors as network instead of auth, and shipped the fix.
7. gcloud builds submit silently drops untracked files. When dt_watchdog.py was a new uncommitted file, gcloud builds submit tar'd everything except it (the implicit .gcloudignore derived from .gitignore excludes untracked paths under certain conditions on macOS). The build SUCCEEDED, the container started, the watchdog code didn't exist inside it. We chased a phantom "deploy not taking effect" for an hour before committing the file fixed it.
8. DT MCP rate limit forces tenant round-robin. The MCP server caps clients at 5 tool calls per 20 seconds. Each watchdog tick spends one call per tenant. With MAX_TENANTS_PER_TICK = 4 we stay under the limit even on a multi-tenant deploy.
9. The Settings API requires alertingProfile and isn't documented as such. Our first auto-wire attempt 400'd with "Validation failed: alertingProfile must not be null". The Dynatrace Schema page doesn't say this. We had to GET /api/config/v1/alertingProfiles, find the Default profile UUID (c21f969b-5f03-333d-83e0-4f8f136e7682 on a fresh tenant), and thread that into the create payload. The watchdog now looks it up dynamically so customer tenants with renamed profiles still work.
10. The watchdog's dedupe TTL almost shipped the wrong way. Our first cross-instance dedup query checked the incidents table for any matching watchdog incident ever — meaning the watchdog would never fire on the same service twice. The fix is a sliding window: a started_at > now() - DEDUPE_TTL_S clause on the dedup query, so a service that degrades again two hours later still pages. Easy to miss in code review, easy to find when the second crash never fired.
Accomplishments that we're proud of
- Fully autonomous, end-to-end. Page → DQL → real PR on real GitHub, in under 8 minutes, with no human in the loop until the merge gate.
- Zero forks of Dynatrace tooling. We use the official
dynatrace-oss/[email protected]server, unmodified. Everyexecute_dql,find_entity_by_name,chat_with_davis_copilot,create_dynatrace_notebookcall is a real round-trip to a real tenant. - The webhook auto-wire. Customers don't paste URLs into the Dynatrace UI. They click one button and Heimdall registers itself on their tenant via the Settings API. This is what every other SaaS observability integration does, and we built it in 48 hours.
- The watchdog closes a real production gap. OTel-only deployments + cold-baseline trial tenants are common in the real world. Davis-AI is excellent on enterprise tiers; on day zero of a new tenant it's silent. Heimdall fills the silence with DQL-driven Problem synthesis.
- PITCH itself. Five real microservices on Cloud Run, real OpenTelemetry, real Neon + Upstash backings, real World Cup 2022 video. Not a toy.
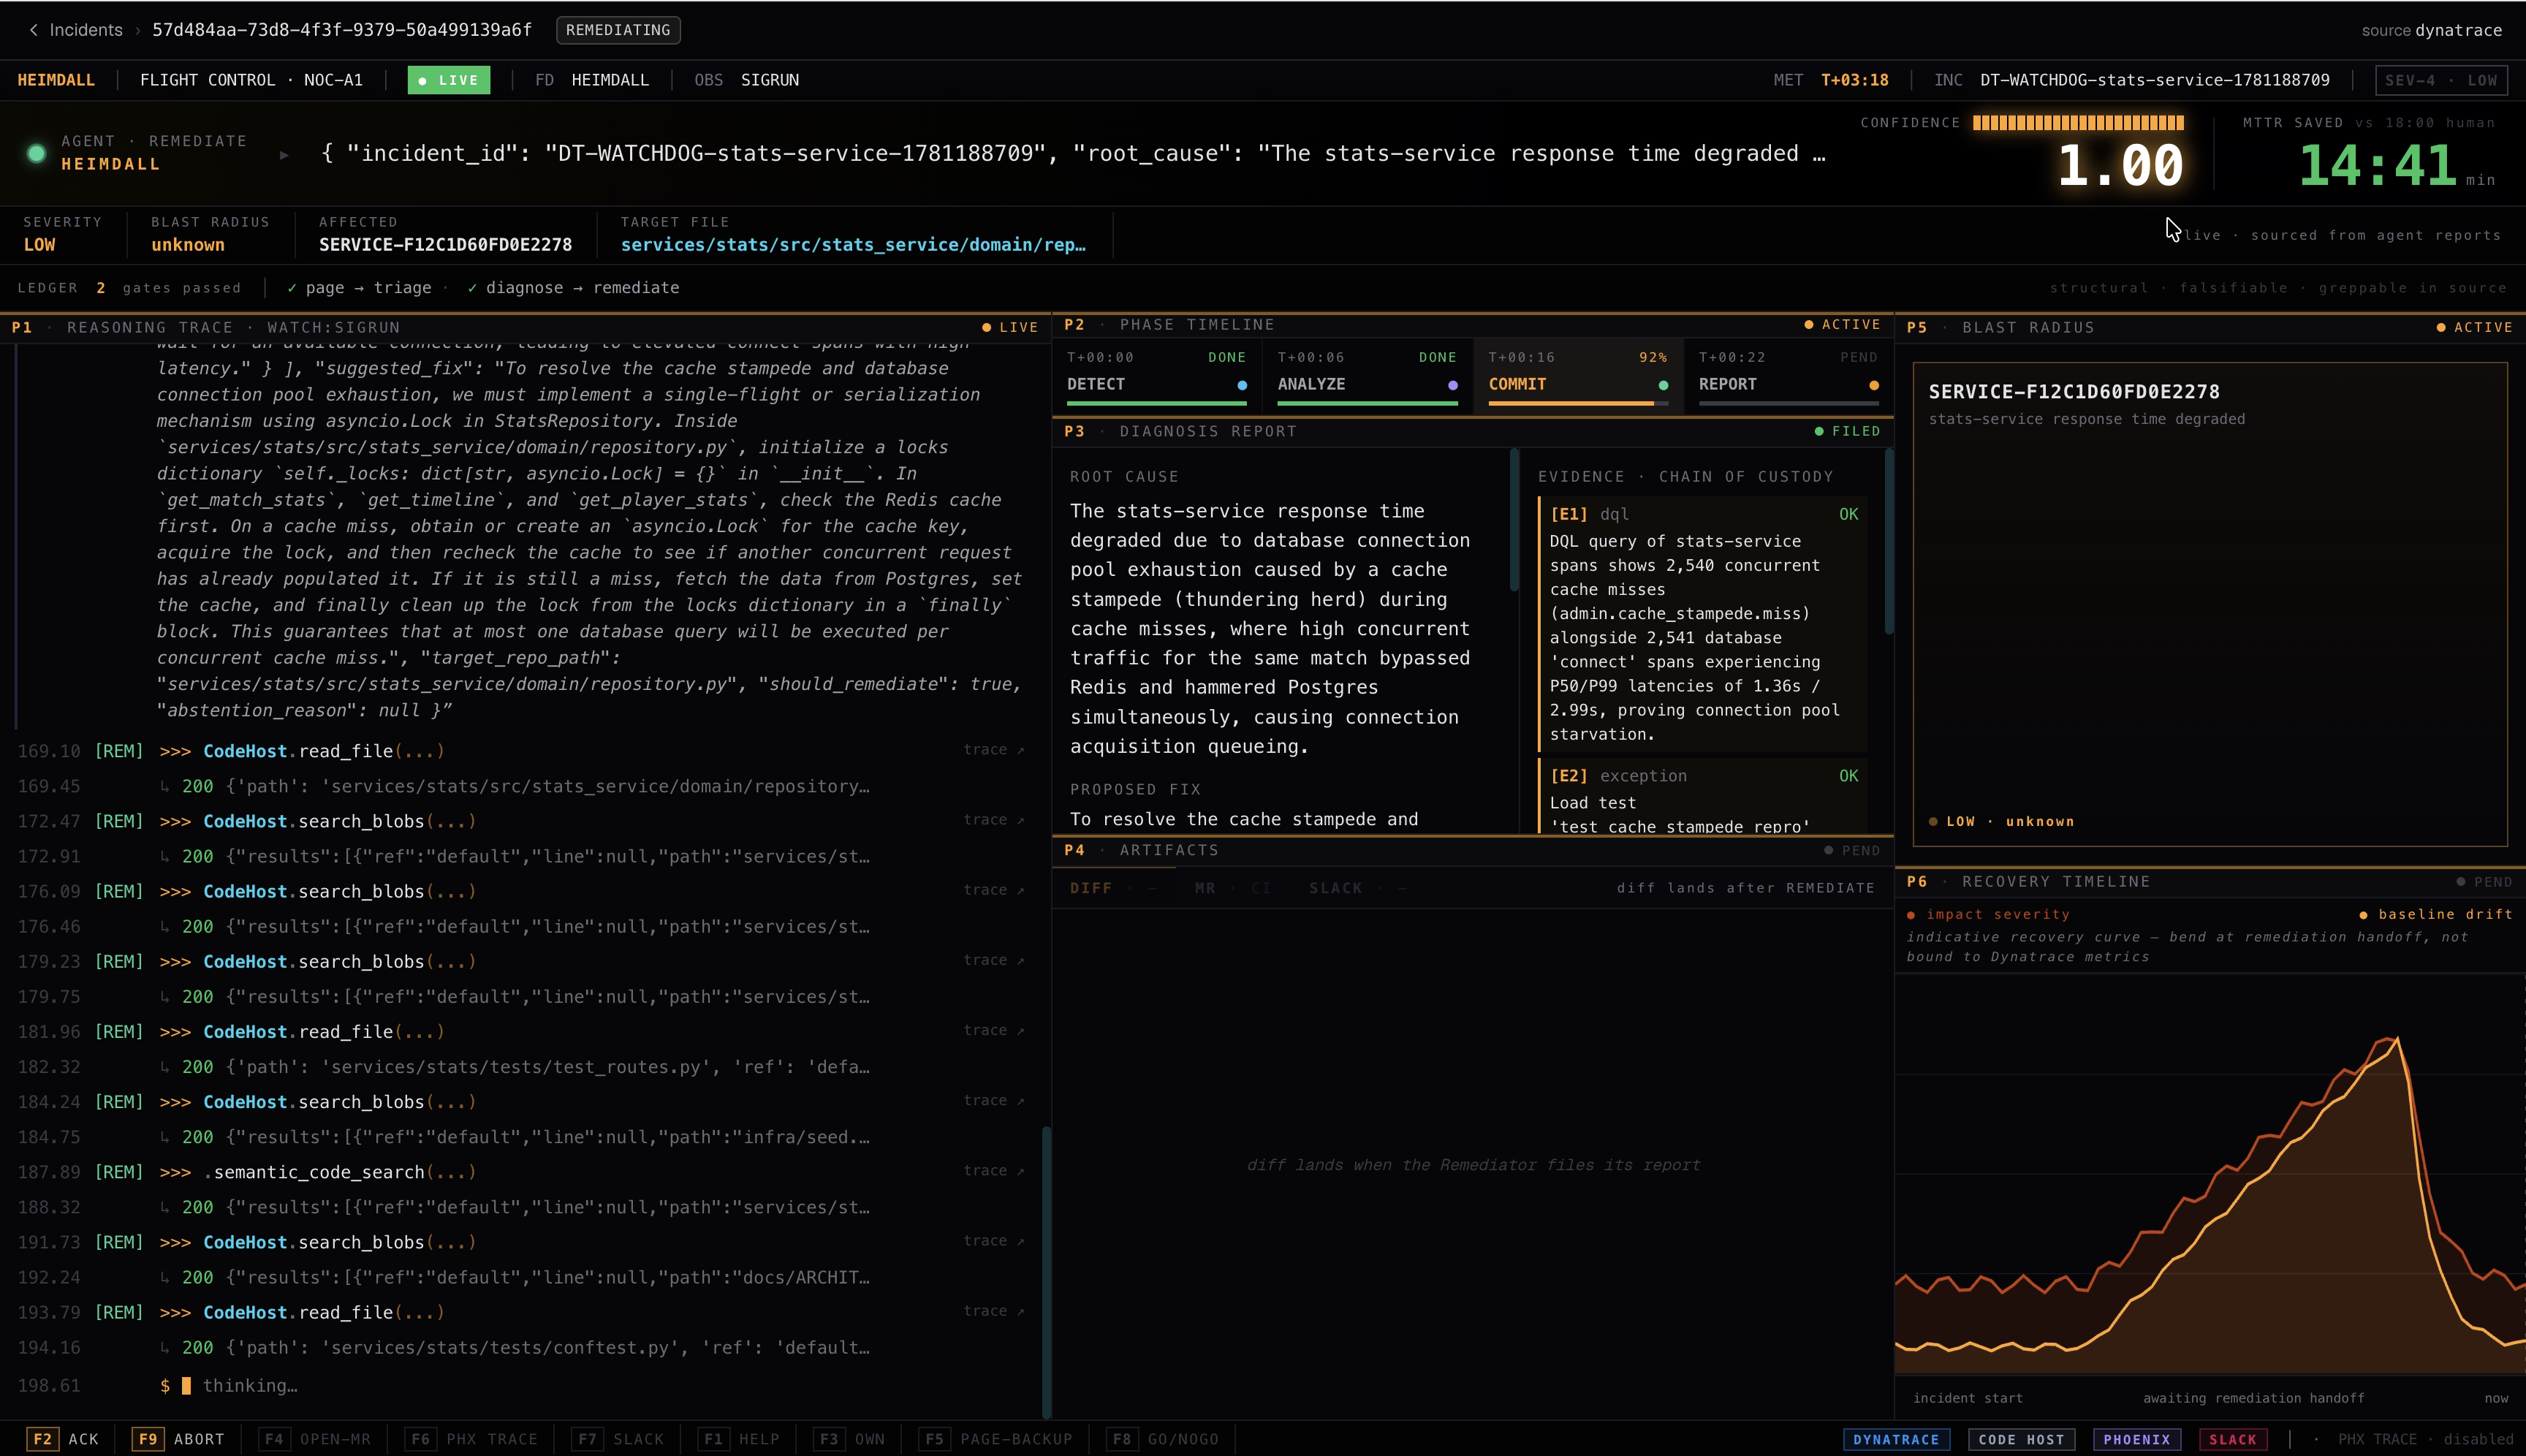
- The mission view. Real-time WS-driven UI showing the agent's tool calls as they happen — every DQL, every Davis CoPilot call, every GitHub
read_file. The agent's reasoning is fully auditable in real time.
What we learned
- The right way to handle "we can't easily verify the customer set this up" in a SaaS wizard is to verify it yourself via the partner's API. Don't make users paste URLs back and forth between two tabs. The Settings API was there the whole time.
- Background tasks on serverless need to be scaled deliberately. Cloud Run will happily kill your asyncio loop on a SIGTERM you didn't expect.
min-instances=1+no-cpu-throttling+ cross-instance dedup or you'll ship duplicate incidents and lose runs. - Agentic loop quality is mostly prompt signal-order. Our diagnostician used to burn 3 DT tool-call budgets querying logs that didn't exist (trial tenant, no log license). Reordering the prompt so it starts with
find_entity_by_name→execute_dql on spans→ only then "everything else" cut diagnose time roughly in half. - Multi-instance asyncio dedup always needs a database-backed check. In-memory caches are a useful fast path but the correctness path has to be in the durable store.
- Read-only code-host tools are safer than write-tools during diagnosis. We give the diagnostician read access to GitHub (
list_repository_tree,read_file,search_blobs) and only let the remediator's separate tool set commit. The diagnostician can't accidentally push something.
What's next for Heimdall: Autonomous Incident Response for Dynatrace
- Auto-merge for low-risk fixes. Config-only single-line changes that pass CI could merge themselves with a 5-minute human window to revert. Higher-risk diffs stay gated.
- Multi-cloud observability. The MCP pattern abstracts cleanly — Datadog, New Relic, Grafana Cloud are next, behind the same agent loop.
- Heimdall Cloud (hosted SaaS). Currently a self-deploy per customer; the next step is a hosted multi-tenant deployment with per-customer KMS-encrypted credentials and tenant-isolated DT MCP instances.
- Tighter Davis CoPilot loop. Ask Davis to verify the proposed fix against the original DQL before the PR opens, rejecting hypotheses that don't actually explain the observed metrics.
- OpenTelemetry-native cross-service root-cause walking. Today the diagnostician identifies the symptomatic service. Next is walking the trace graph through
dt.entity.servicerelationships to find upstream root causes that present as downstream symptoms.
Built With
- asyncio
- asyncpg
- docker
- dynatrace
- fastapi
- framer-motion
- gemini
- github
- github-actions
- google-adk
- google-cloud
- google-cloud-build
- google-cloud-run
- httpx
- mcp
- neon
- nextjs
- oauth
- opentelemetry
- otel
- postgresql
- python
- react
- redis
- remotion
- sqlalchemy
- sse
- supabase
- tailwindcss
- typescript
- upstash
- vertex-ai
- websocket


Log in or sign up for Devpost to join the conversation.