🌿👻 Haunted Greenhouse — Project Story
A smart, IoT-powered, haunted-themed greenhouse monitoring system.
👻 Inspiration
The project idea came from wanting to merge IoT automation, real-time data visualization, and a fun haunted theme.
We wanted each greenhouse zone to feel like a “haunted room,” each with its own identity, behaviors, and thresholds — while still being a fully functional greenhouse monitoring system.
The challenge was to create something both technically meaningful and creatively memorable, where sensors and actuators feel almost like characters in a spooky ecosystem.
🔧 How I Built the Project
The project uses a modern, multi-service architecture based on the following components in the repo:
1. Backend — NestJS
Located under backend/, the backend handles:
- Greenhouse & zone creation
- Sensor ingestion
- Actuator control (like irrigation)
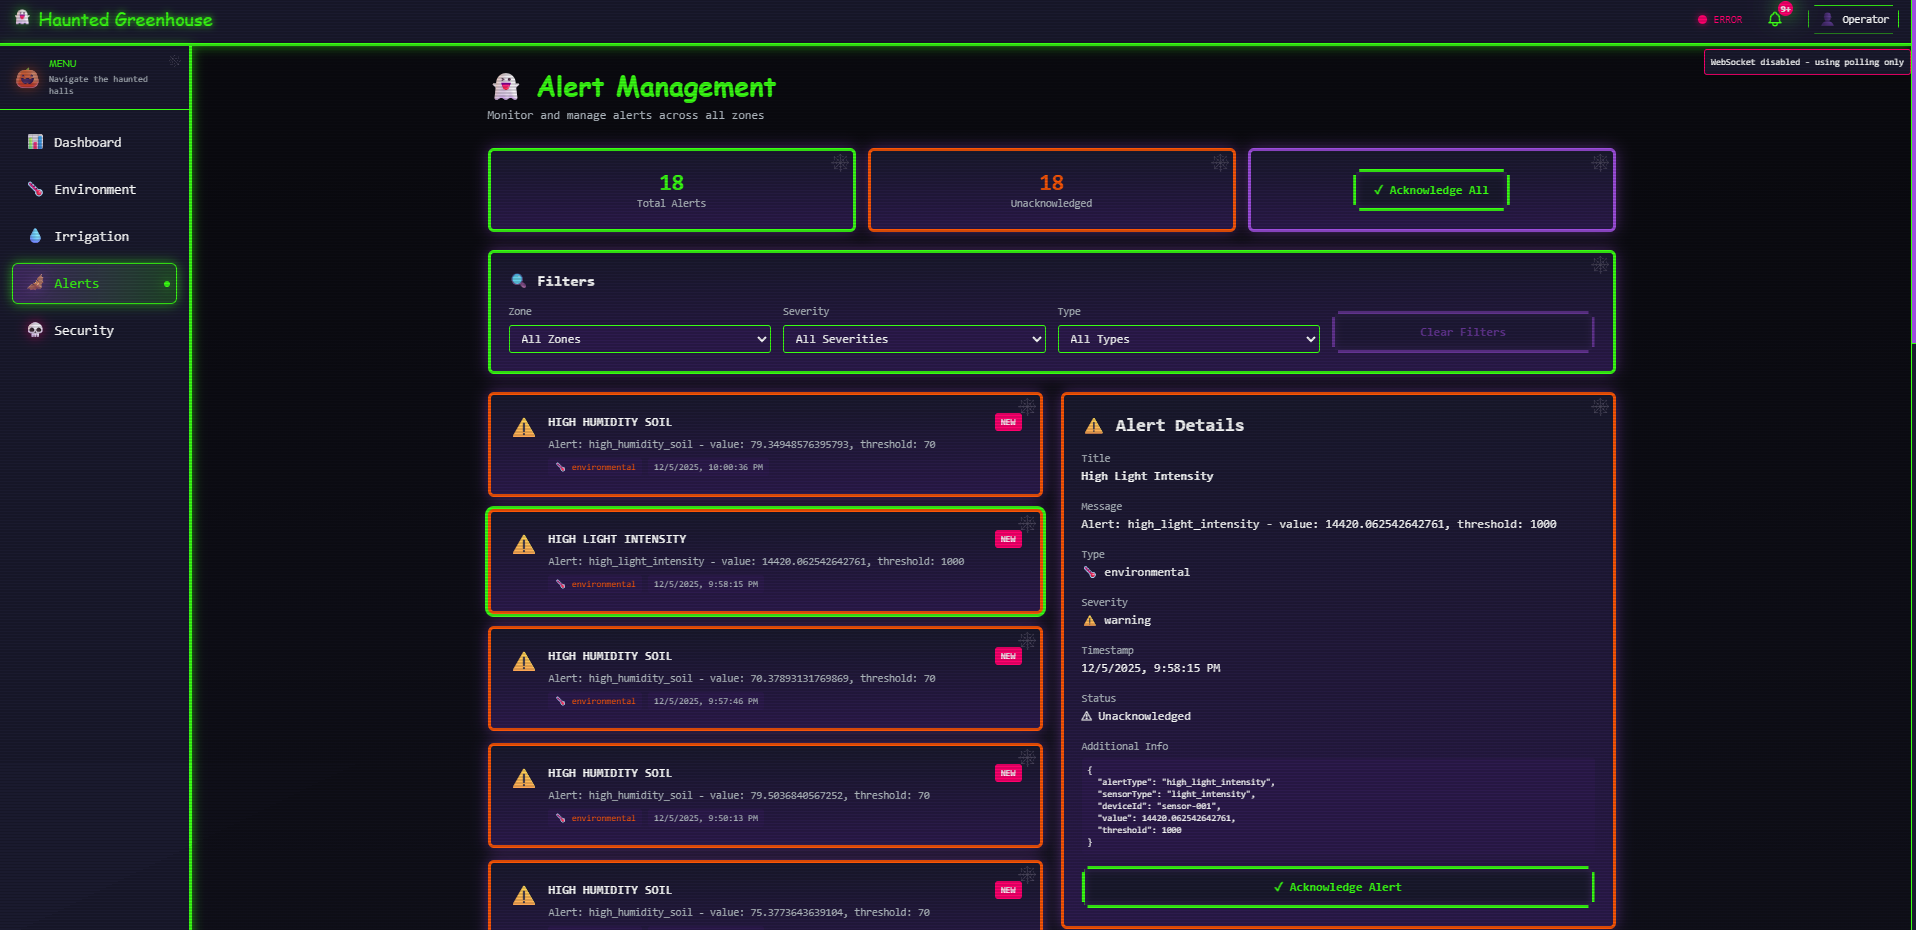
- Real-time alerts
- Weather integration
- Configuration limits
- Analytics aggregation
Everything is modularized using NestJS modules such as:
GreenhouseModuleZonesModuleSensorsModuleIrrigationModuleAlertsModulePlantHealthModuleLimitsModuleAnalyticsModuleWeatherModule
Sensor data follows a model represented as: $$ [ \text{Health Score} = f(T, H, M, CO_2, pH) ] $$
Where:
- (T) = temperature
- (H) = humidity
- (M) = soil moisture
- (CO_2) = carbon dioxide levels
- (pH) = soil acidity
This makes it possible to derive real-time conditions and warnings.
2. Frontend — Next.js Dashboard
Located in frontend/, built with Next.js + TypeScript, the frontend provides:
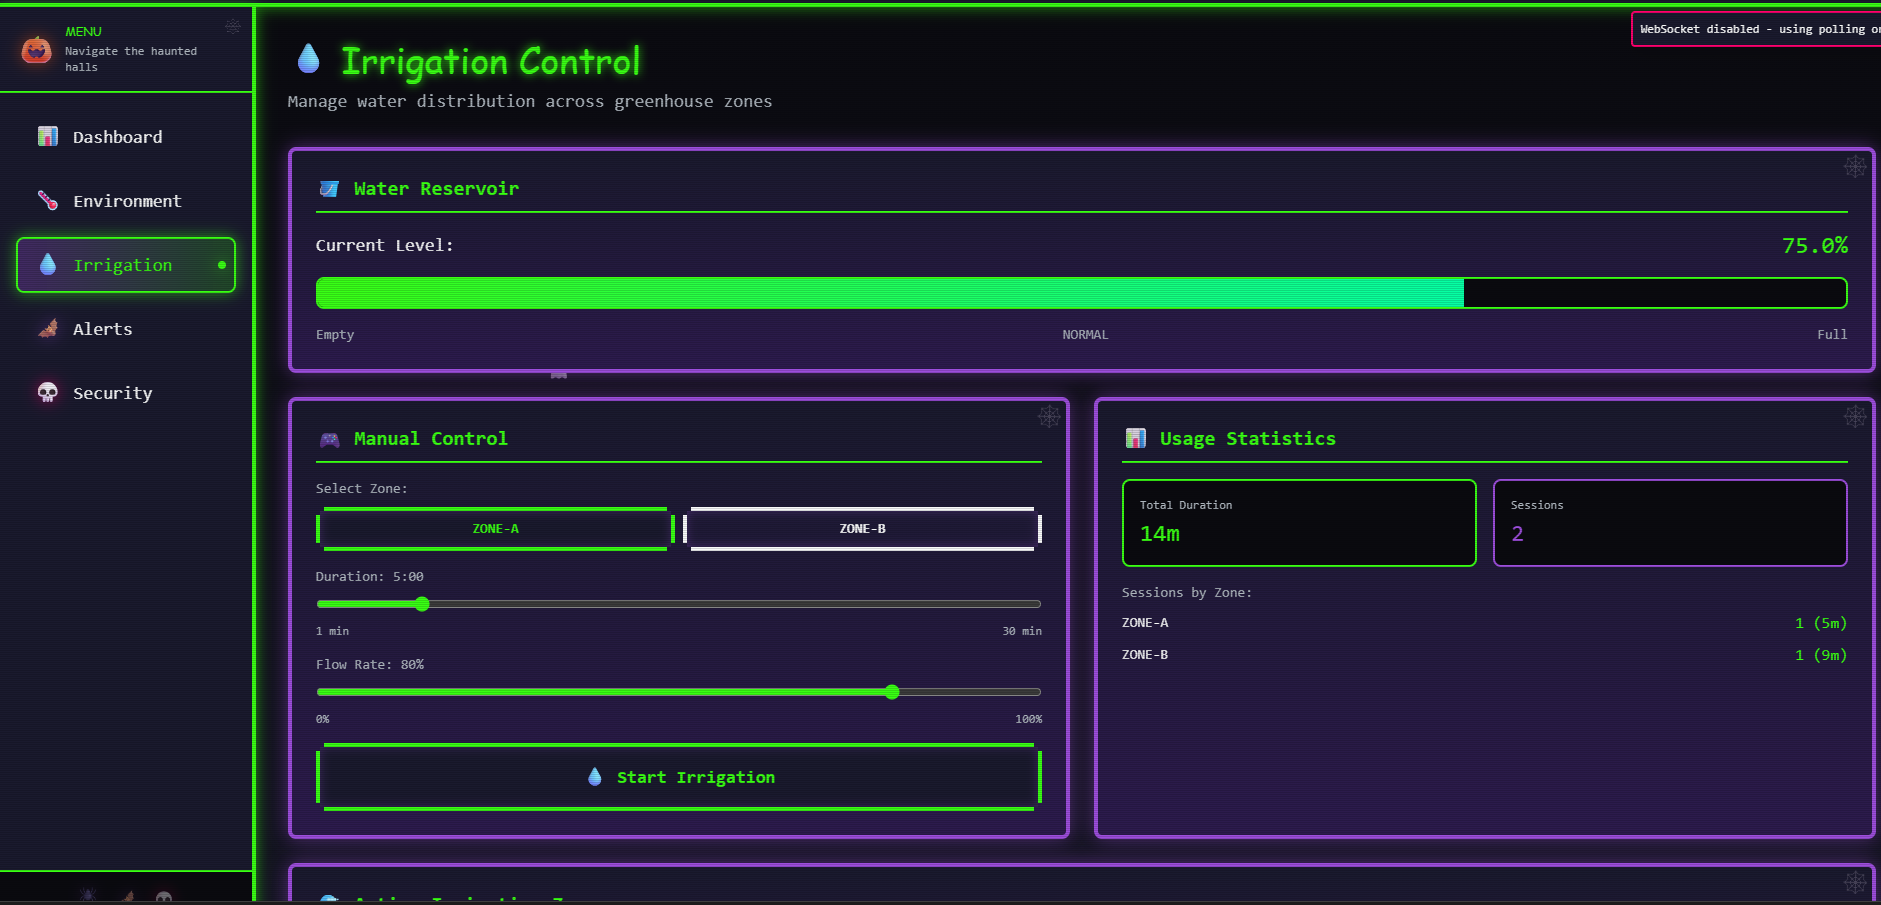
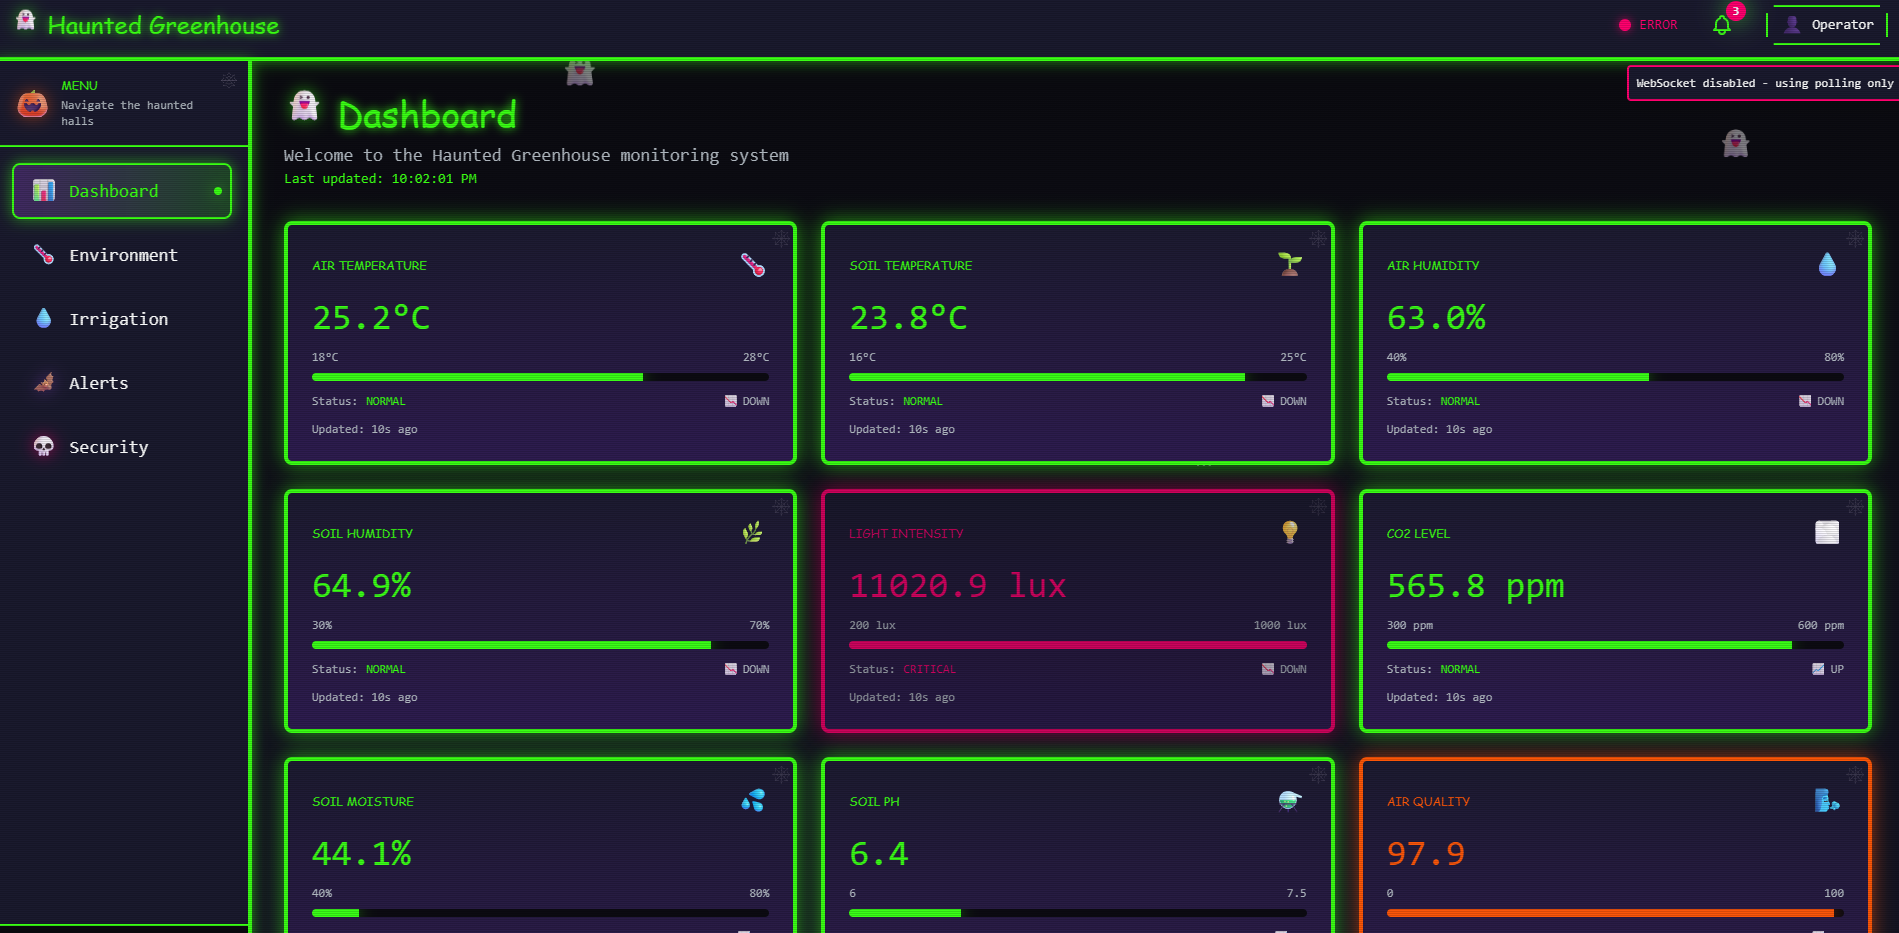
- A haunted-themed greenhouse UI
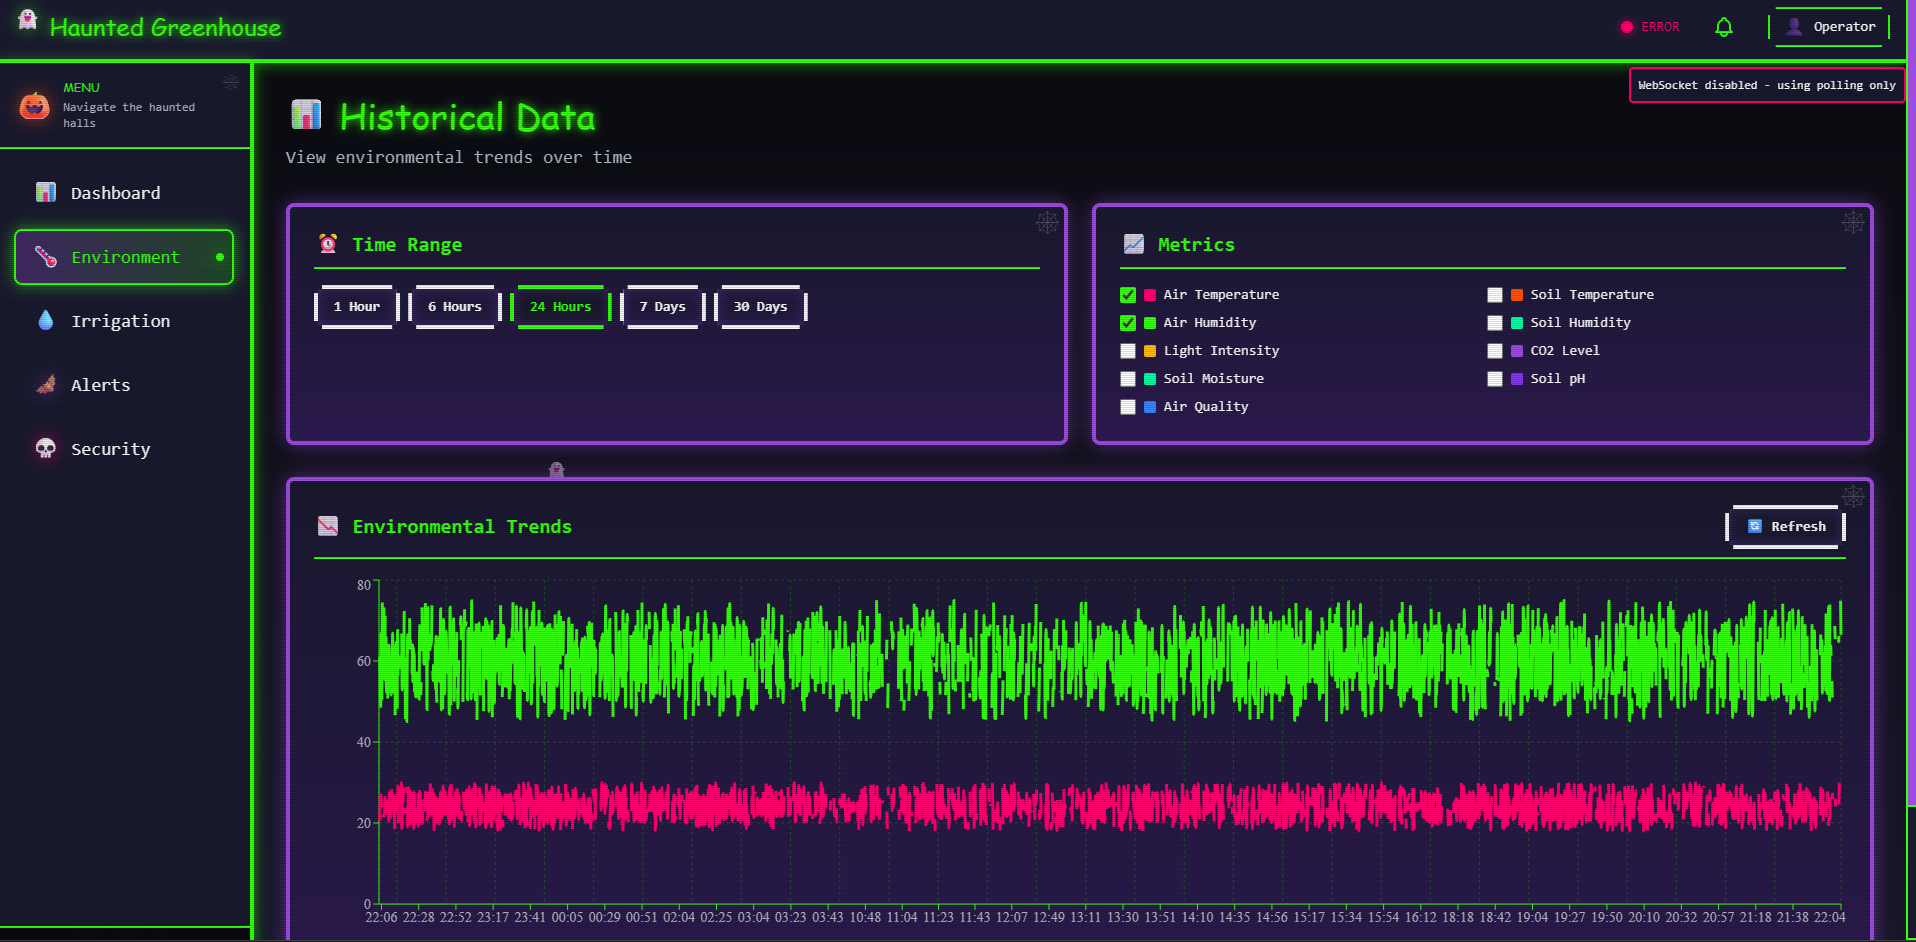
- Real-time sensor charts
- Zone configuration pages
- Actuator control buttons
- Alerts viewer
- Weather-based insights
The dashboard consumes:
- REST API endpoints
- WebSocket streams for live sensor updates
3. IoT Messaging — MQTT Broker
The project uses Mosquitto MQTT (via Docker) for:
- Publishing sensor readings
- Receiving actuator commands
- Broadcasting system alerts
Topics resemble:
$$ [ \text{greenhouse}/{zone}/sensors ] $$
This provides low-latency updates to the system.
4. Simulator — Virtual IoT Device
Under simulator/, I added a Node.js/TypeScript simulator that:
- Randomly generates sensor data
- Publishes readings to MQTT topics
- Allows full testing without physical hardware
Example simulated metrics:
- Temperature
- Humidity
- Soil moisture
- Light intensity
- CO₂
- pH
- Air quality
Mathematically, noisy sensor data is generated using:
$$ [ X_{simulated} = X_{base} + \epsilon ] $$
where $ (\epsilon)$ is random noise.
5. Time-Series Database — InfluxDB
InfluxDB is used to:
- Store all incoming sensor measurements
- Query historical data
- Generate trend analytics in the backend
Queries are optimized for time windows such as:
$$ [ \text{mean}(T) \text{ over last } 24h ] $$
6. Weather Integration
The backend integrates with the OpenWeatherMap API to fetch:
- Real-time conditions
- Five-day forecasts
These are used to adjust greenhouse decisions automatically.
🎓 What I Learned
1. Real-time IoT data processing
Building a pipeline using MQTT + NestJS + InfluxDB taught me how to handle:
- High-frequency sensor streams
- Message throttling
- Real-time WebSocket updates
2. Microservice-style modular design
The NestJS modules grew into clear domains:
- Sensors
- Alerts
- Irrigation
- Weather
- Analytics
I learned how to architect maintainable code for a system with many moving parts.
3. Coordinating frontend real-time data
Using WebSockets and polling taught me how to:
- Keep charts updated live
- Prevent UI blocking
- Manage rapid data changes smoothly
4. Functional data modeling
Modeling greenhouse health as:
$$ [ \text{Health} = f(\text{environmental variables}) ] $$
helped me formalize thresholds and alerts.
⚔️ Challenges I Faced
1. Synchronizing Distributed Components
The MQTT broker, backend, simulator, and InfluxDB all run independently.
Keeping them synchronized required debugging timing issues and message ordering.
2. Handling Sensor Noise
Real (and simulated) data is noisy.
I implemented smoothing strategies such as:
$$ X_{t}^{\text{smooth}} = \alpha X_{t} + (1-\alpha) X_{t-1} $$
to reduce flickering in the dashboard.
3. Container orchestration
With multiple services (MQTT, InfluxDB, backend, simulator), Docker configuration became challenging — especially ensuring correct networking and environment variables.
4. Designing a Haunted Theme
Balancing “fun spooky atmosphere” with “usability and clarity” in the dashboard required careful UI design choices.
5. Weather API limits
Weather API rate limits required caching and scheduled refreshes.
🎯 Final Thoughts
This project taught me how to combine IoT, real-time APIs, frontend dashboards, database systems, and creative storytelling into one cohesive experience.
The Haunted Greenhouse is both a technical system and a themed digital environment.
Built With
- docker
- influxdb
- mqtt
- nestjs
- nextjs
- postgresql
- typescript

Log in or sign up for Devpost to join the conversation.