-
-
CalFire Incident Reports (10.05.2020)
Inspiration
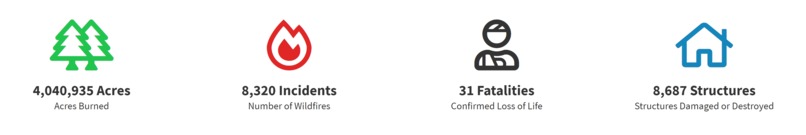
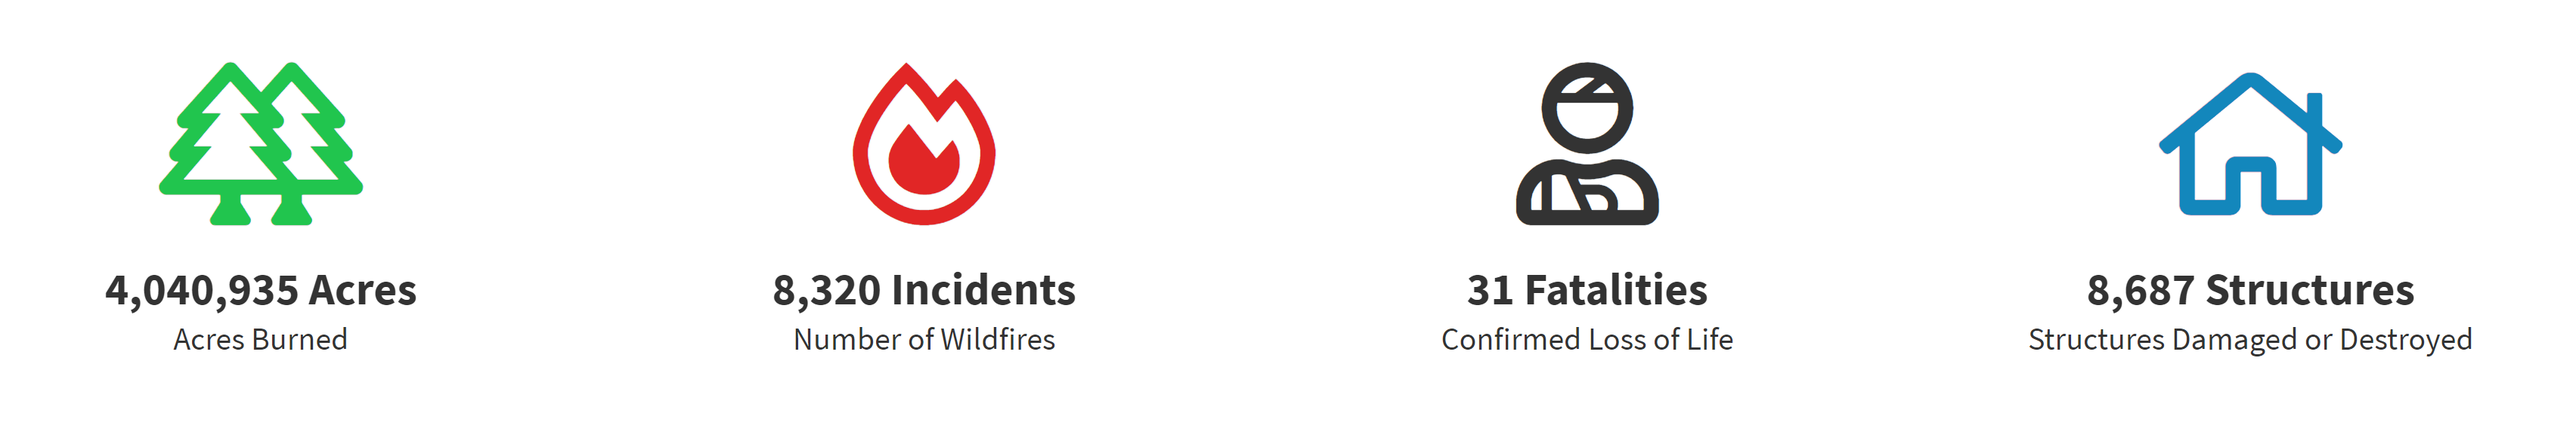
Living in California, our team was keenly aware of how the past few years of wildfires have affected our lives: increasing air pollution, participating in planned public safety power shut-offs, and supporting friends through tragic losses. Since we began working on this project in March, 2020, there have been over 3.7 million of burned acres in, and almost 8000 structures damaged, in California alone. Cal-Fire 2020 Stats as of September 30th, 2020:
The August Complex fire has now surpassed the 2018 Mendico Complex as the largest fire in California history. In fact, four of the top five largest fires in California history have occurred in the last month. Watching these fires around us, we’ve seen how the community-level devastation affects communities of all sizes, with an outsized impact on those who are most vulnerable due to their age, education, language ability, mobility, and socio-economic status. This year, the devastation on vulnerable communities became even more salient due to the existing threats from COVID-19. As we thought about this project, we wanted to ensure we were prioritizing those who needed the most help. Our original vision was to build a defensible-space tool for homeowners to better understand, manage, and implement the jurisdiction's requirements. Interviews in the fire community revealed that over 70% of homes pass on their first inspection, while the remaining 30% often require multiple inspections. The current inspection process is highly manual and inefficient for Cal-Fire; oftentimes inspectors don't return to re-inspect a home due to the progression of the fire season and competing priorities.
As we spoke with Cal-Fire, we started to hear pain points around information accessibility and defensible space during live fire events. A former Cal-Fire unit chief told us that limited access to phones and computers during a live fire heightened the need for better planning tools. In particular, a way for the Incident Commander at a live fire complex to make decisions in line with Cal-Fire’s key priorities: human safety, fire containment, and environmental stewardship.
As a result, we decided to investigate the power of remote sensing to detect defensible space during live fire events, optimistic that the combination of this information with social vulnerability data would help to ensure faster, more efficient, and more equitable live fire response.
Our Tool
Our tool combines risk assessment and social vulnerability data to power faster, more efficient, and more equitable live wildfire response. It assesses predicted fire damage at a "neighborhood" level for groups of California homes in SRA jurisdiction, integrating community vulnerability data, to help Cal-Fire inform live fire response.
Click around in our v1.0 website here to learn about the tool and test the user interface for inputting fire perimeters. Note: this site contains our early front end and working user interface, but shows mock tool output only given Planet datapipe delays and structural system limitations to creating a live API link.
How we built it
Our system primarily depends on predicting the relative "burn risk" among "threatened communities" (defined as a .5 x .5 KM area). This risk, as well as information informing that prediction and social vulnerability information relevant to that community is then visualized to response planners.
In either a live fire or proactive planning event, the tool takes an input (either a lat/long or a polygon drawn by the user) that defines an active or theoretical fire boundary. The system then simulates a series of potential boundaries for the fire and uses the minimum bounding geometry of those various simulations to define the population of "threatened communities". Today, our simulation engine is quite naive as extensive work by groups such as FlamMap and Crowley et al. has been carried out in this domain and we simply did not have the scope to integrate these models into our prototype as we would in a production system.
With the population of "threatened communities" defined as the overlap of the burn radius and populated areas ("the WUI"), a series of individual "neighborhoods" is defined via a simple .5x.5KM grid over-layed on this intersection. For each section of this grid, the most recent satellite image (R, G, B, and Infrared Bands) is extracted from Planet’s API, cut up in .5x.5km and passed into the core prediction model.
The core prediction model is a convolutional neural net with 4 layers that takes as input a 4 channel, 50x50 pixel image and returns a single percentage value (0-100%), which represents the percentage of the image that is likely to truly be damaged or scorched should a fire "come through" the entirety of that area. The labels for this training set was established using an unsupervised clustering and pixel difference algorithm adapted from Rossi et al. that approximated the damaged or scorched areas in populated regions in past fire events.
Additionally, key to the Project Firesafe mission is incorporating the social vulnerability scores of an affected area so that Cal-Fire is equipped with the information needed to make more equitable decisions. Our tool pulls community level US census variables from CDC's Social Vulnerability Index most influential in shaping the resilience of impacted communities in the face of natural disaster including the percentage of the community who are elderly, disabled, facing language barriers, or economically disadvantaged. For more information, please visit the CDC's social vulnerability index here.
Lastly with a series of "neighborhoods" or "threatened communities" defined, a burn risk prediction (simulator), a damage risk prediction (CNN prediction model), and a social vulnerability index score (CDC's SVI) established, we visualize these metrics for a given event to the end user. On the whole, we believe this group of technologies, especially when put into a more robust production implementation, can ensure faster, more efficient, and more equitable live fire response and proactive management.
Challenges
With no prior geo-spatial backgrounds, our team faced several challenges in building and manipulating our data pipeline. Specific data challenges included:
- Data type mismatches due to 'snapped pixels' forcing "squeezed" dimensions
- Only low resolution imagery available
- Difficulty implementing efficient cloud-cover removal and composite scoring
- Lack of familiarity with correct thresholds for filtering, scoring, etc.
- Lack of knowledge with geo-spatial and other visual tools, such as Leafly, Planet, Bubble.io
These data challenges were also coupled with simple time constraints such as:
- Not enough time to collect sufficient labeled images, forcing use of unsupervised approach
- Forced to put the "hack" in "hackathon" at a number of points in the pipeline
- Difficulty building out a robust UI despite complete model implementations
Lastly, the nature of these constraints did limit us algorithmically:
- CNN predictions focused on entire image and not "window panes" or sub-images
- Simulation step was Naive and did not leverage RL or other known simulation techniques
Accomplishments
We're proud of both the process and the output. Despite our varying levels of technical expertise and comfort with geospatial data, we were able to find ways for everyone to push the project forward, whether it was through primary research, secondary analysis, soliciting help, or hacking away.
We are pleased to have a fully working front-end, where a user can input a lat-long or draw a fire boundary anywhere in California. Even more exciting, our model will then provide a reasonable accurate (MSE ~ 10%) burn risk assessment. We were not able to connect the assessment back to the tool, however, so the user cannot input a boundary and seamlessly receive the score. Going forward, this can be achieved through an API connection and more time hacking.
The Vulnerability score is reported based on the user input (lat/long provided, or first point of boundary). With more time, we would want to make that score inclusive of the entire area. We view the inclusion of community vulnerability into this project as an imperative for any "go forward" related projects.
What we learned
We learned an immense amount about fire-risk in California and the monumental challenges ahead as global warming continues to heighten wildfire risks. Technically, we learned that maintaining data integrity while manipulating geo-spatial data is incredibly challenging. Due to the myriad different data types across different layers, we struggled to extract the data we wanted and at times had to "hack" our way to success. Despite backgrounds in a variety of machine learning techniques, including deep learning, this was also the first time many of us did in-depth work with multi-channel image data and convolutional neural nets.
Finally, we left this project with the conclusion that many stakeholders are needed to achieve this at scale: from the users (e.g. Cal-Fire chiefs), to geospatial data companies (e.g. Planet), to the IT and technical teams ensuring Cal-Fire is online and up to speed. While much progress has been made in certain areas of machine learned statistical modeling across the domain of wildland fires, there is considerable room for systems based thinking to provide more holistic solutions.
What's next for Fire Risk Tracking for Vulnerable Communities
We are excited to apply the knowledge we have learned in our respective fields both in an academic and professional capacity. This has been an incredible learning experience for us all! We are deeply grateful to Cal-Fire for their gracious support and time for interviews. We could not have done this without the support of Stanford University -- both the Big Earth Hackathon Class run by Derek Fong and Margot Gerritsen, and the Data Science Institute, which allowed us to continue our research over the summer.

Log in or sign up for Devpost to join the conversation.