Inspiration: Most climate apps are boring and use expensive hardware sensors that regular students like us can't access. I wanted to build a single "planetary dashboard" that pulls real data from space satellites so anyone can see how our planet is doing in real-time.
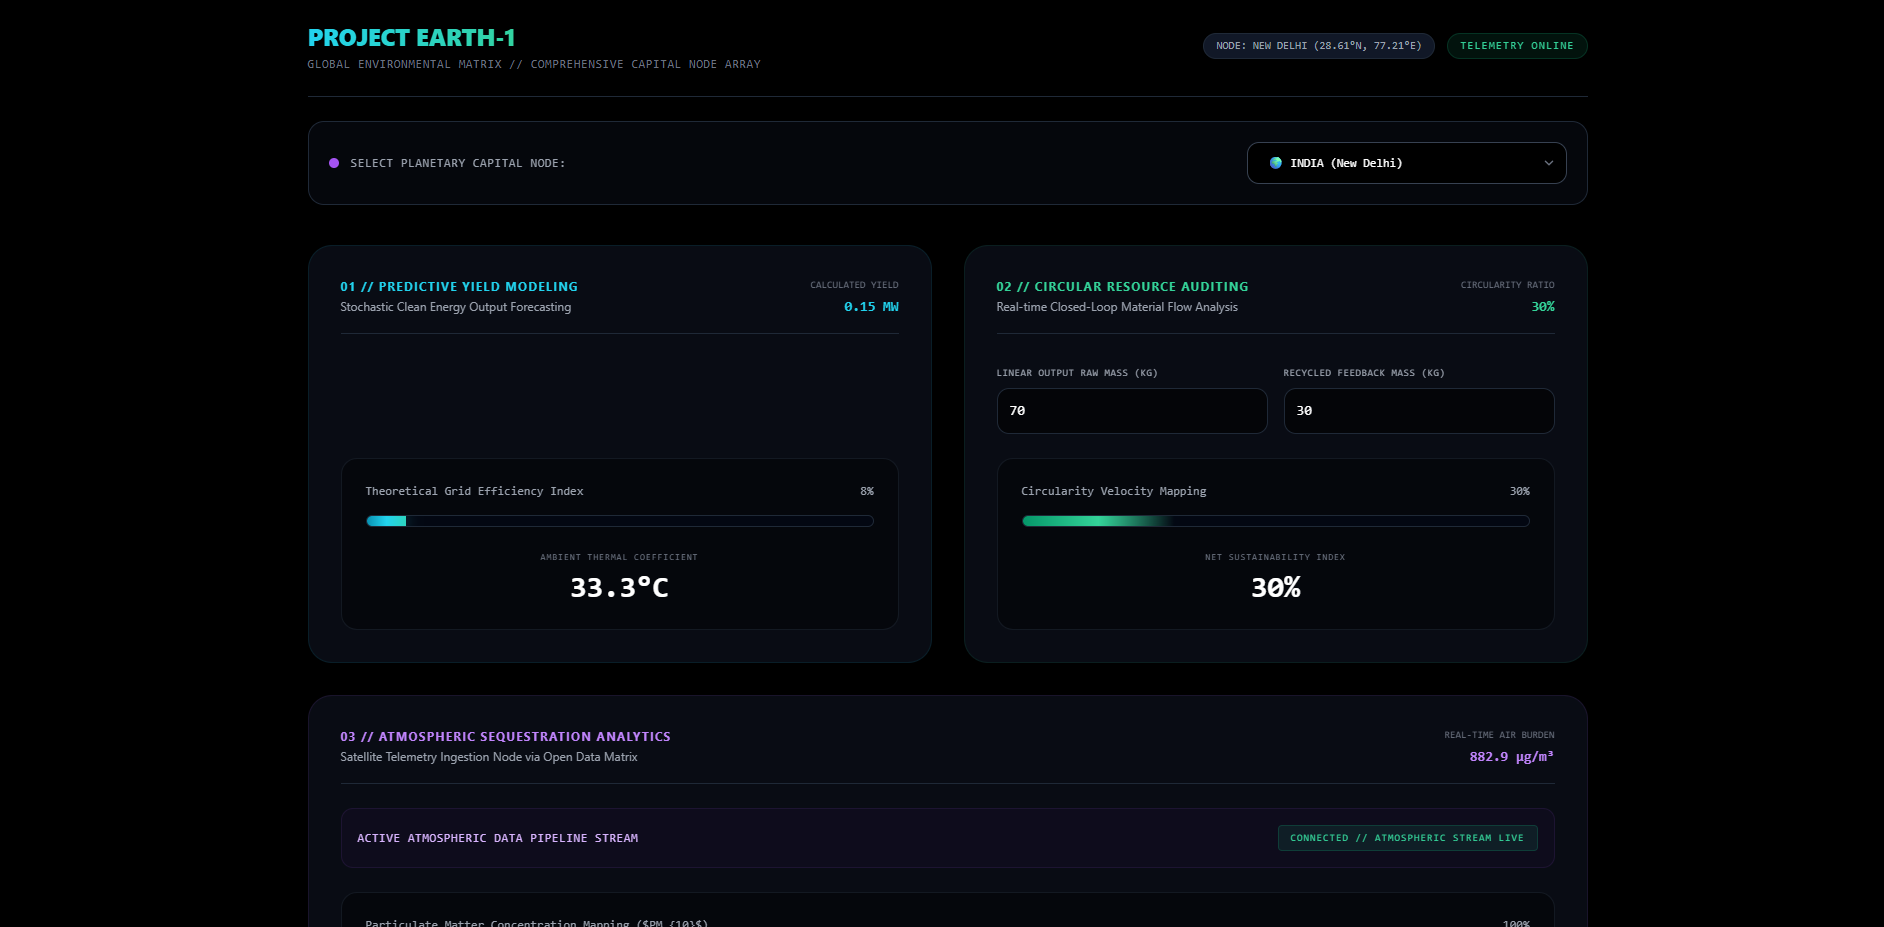
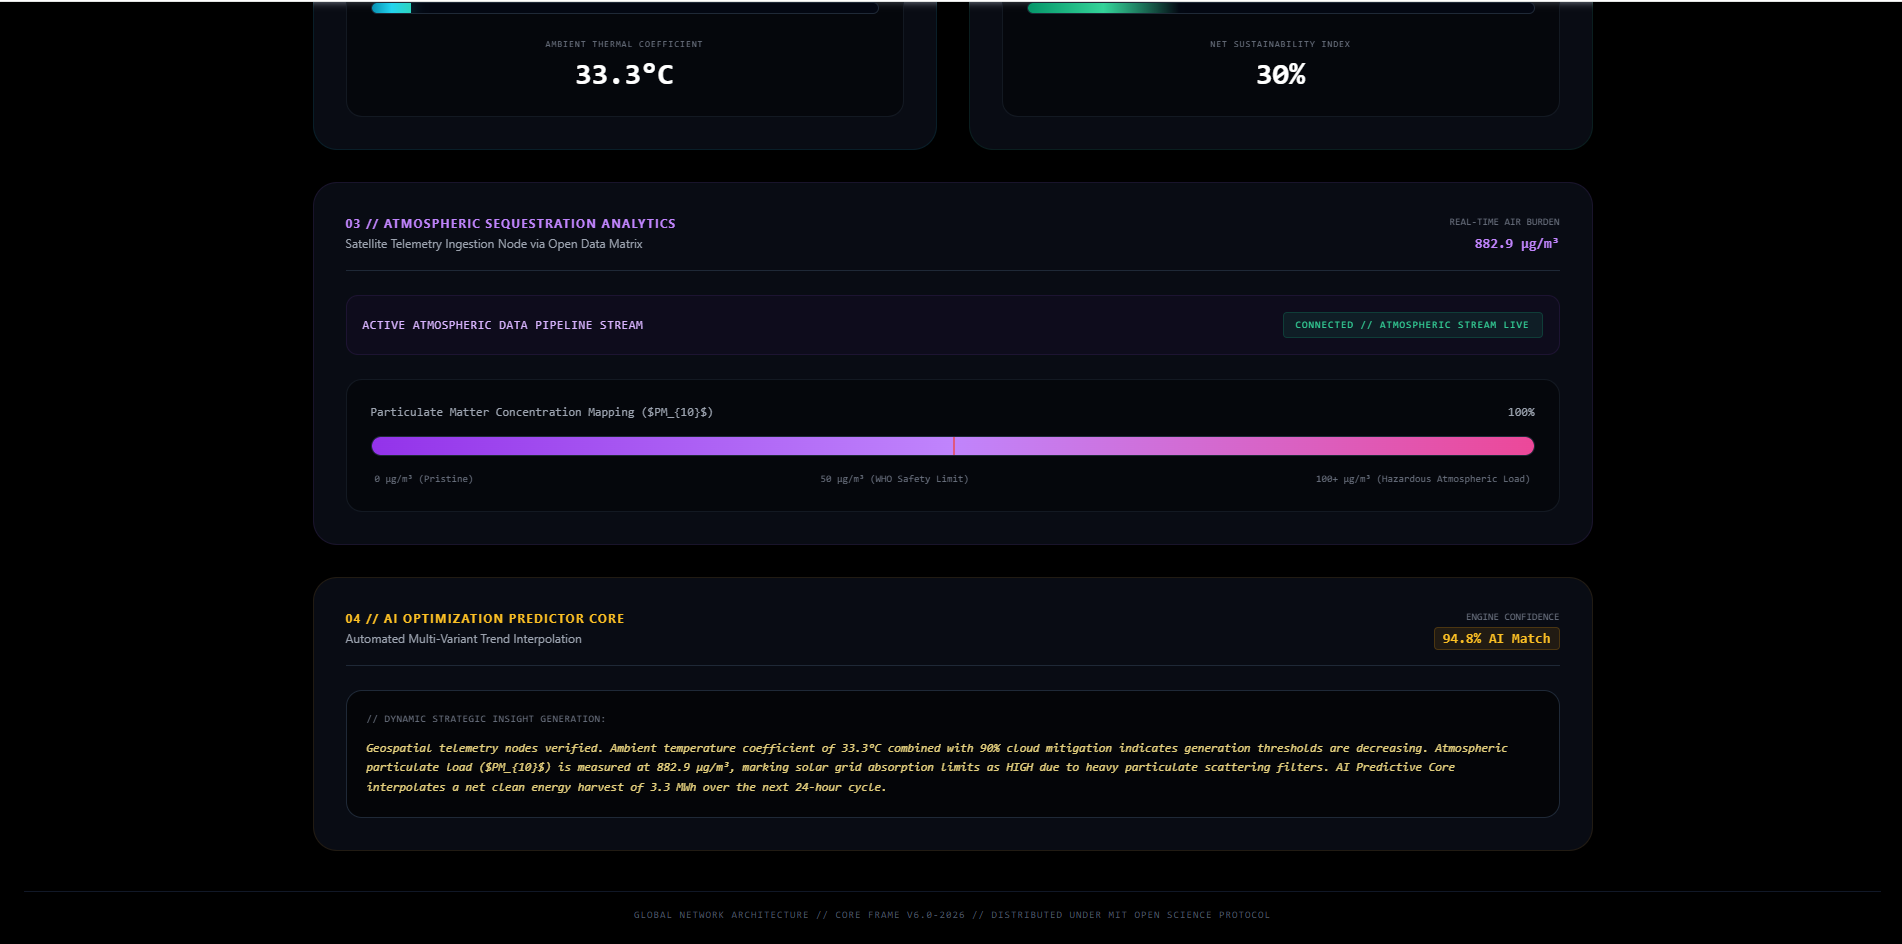
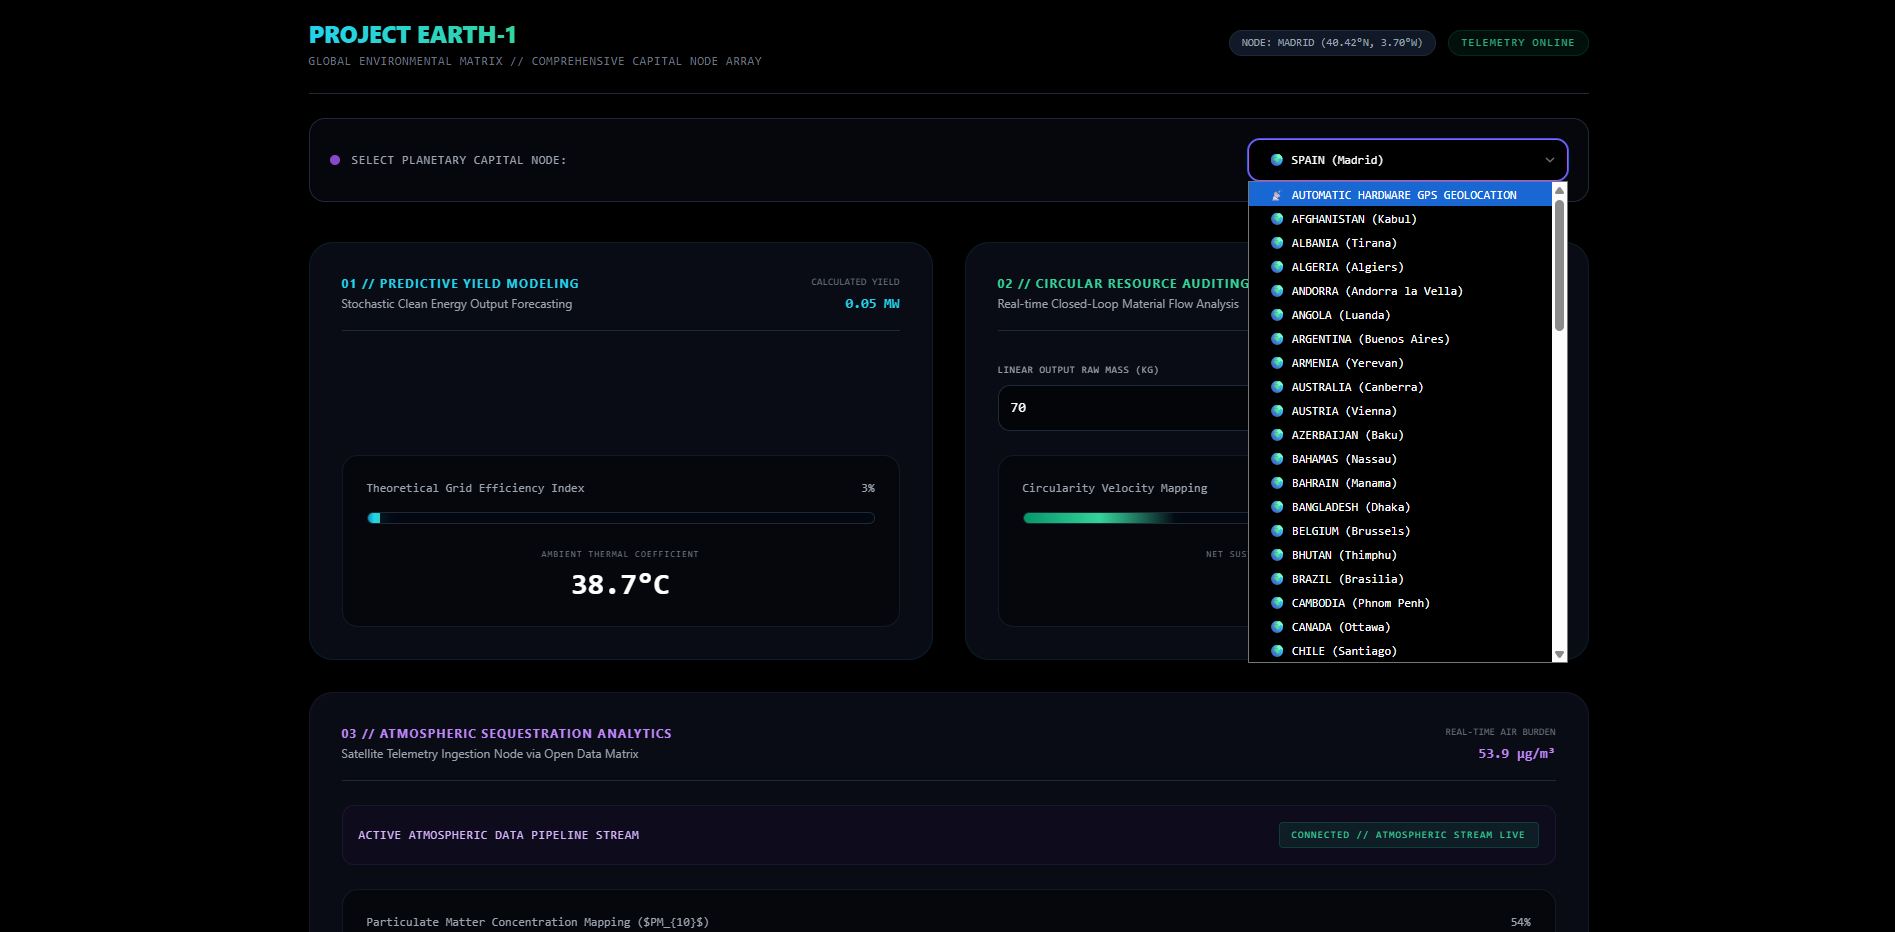
What it does: Project EARTH-1 is a live website dashboard. It streams global environmental data (like air quality and temperature) directly into your browser. It also includes a Kardashev Scale calculator that shows exactly how much clean energy humanity needs to generate to become a Type 1 civilization.
How we built it: I built it using a clean web stack:
HTML5 & CSS3: For designing a clean, scannable dashboard layout.
JavaScript (Fetch API): To grab live satellite data smoothly in the background without freezing the screen.
Python: To write the logic that handles and calculates the heavy environmental data.
Challenges we ran into: When I tried pulling massive data from multiple live APIs at the same time, the browser would completely lag and freeze. I had to learn how to use asynchronous JavaScript (async/await) so the data streams load quietly in the background while the website stays totally smooth.
Accomplishments that we're proud of: I'm proud that I actually got live space and weather APIs to talk to my dashboard! Taking a huge physics concept like the Kardashev Scale and turning it into a real, working calculator as a 9th grader feels awesome.
What we learned: I learned how to work with APIs and data pipelines. I realized you don't need thousands of rupees for expensive hardware sensors when you can use clean code and open-source satellite data to build the exact same thing.
What's next for Project EARTH-1: Next, I want to add local energy models (like how much power we could grow using bio-algae panels) directly into the dashboard. I also want to add a small local database to save the data so the website loads even faster.

Log in or sign up for Devpost to join the conversation.