Project EARTH-1: Planetary Digital Twin Dashboard
Inspiration
Physical sensors used to track atmospheric changes and renewable energy grid metrics are incredibly expensive. Many small communities and local innovators cannot afford the hardware infrastructure required to accurately monitor local energy efficiency.
We created Project EARTH-1 to solve this issue. By leveraging open-source satellite data networks, we built a software-based planetary Digital Twin dashboard. It eliminates the need for hardware sensors, putting high-density, real-time climate telemetry right into the hands of grid operators for free.
What it does
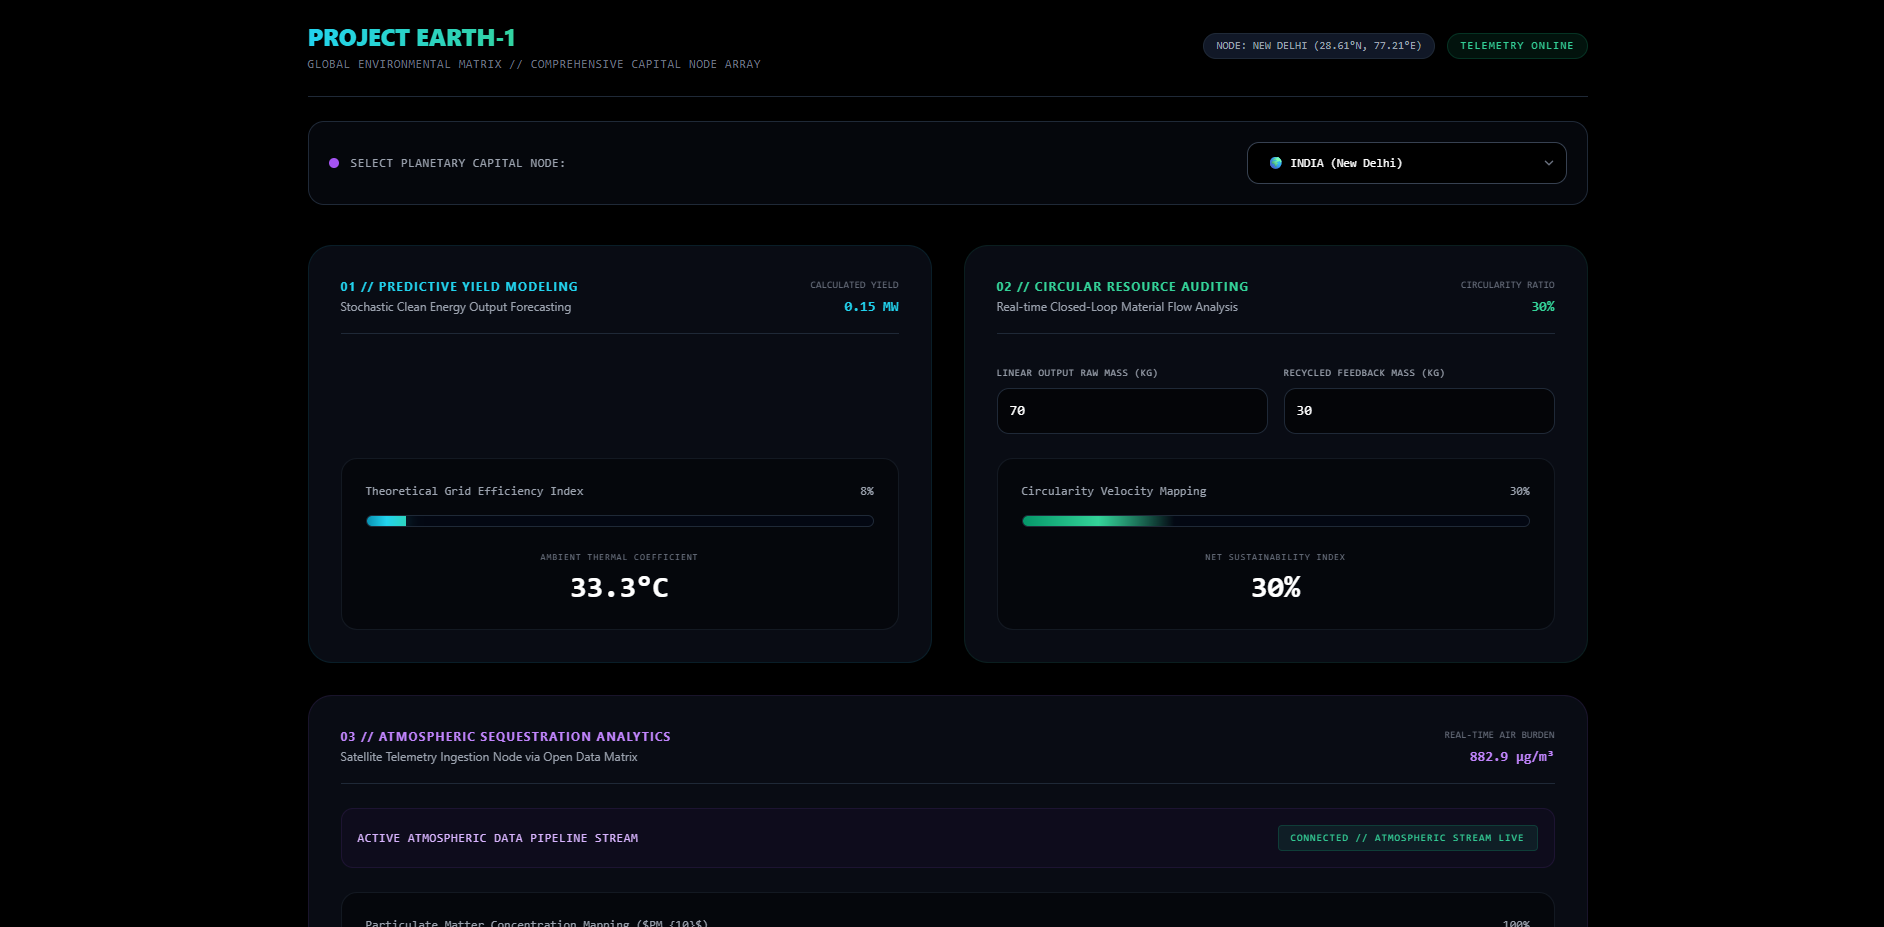
Project EARTH-1 is a responsive, single-page command center that streams real-time environmental data payloads.
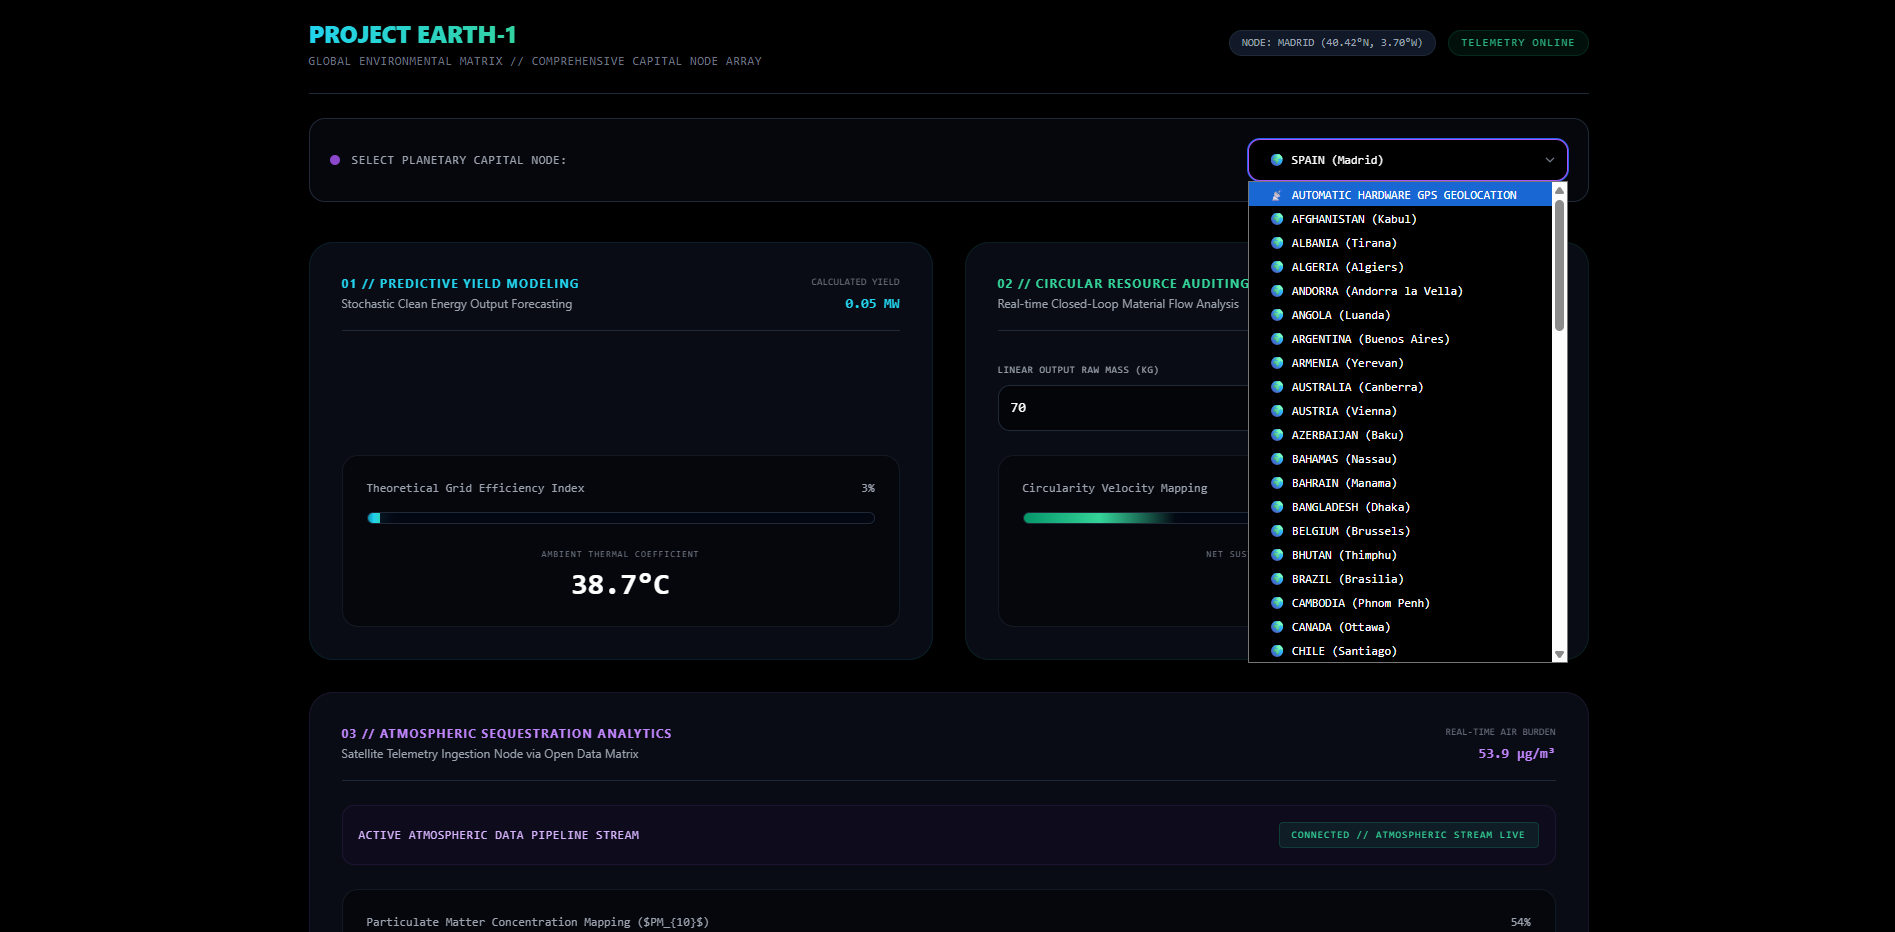
- Interactive Node Navigation: Users can cycle through global capital cities to pull localized weather datasets instantly.
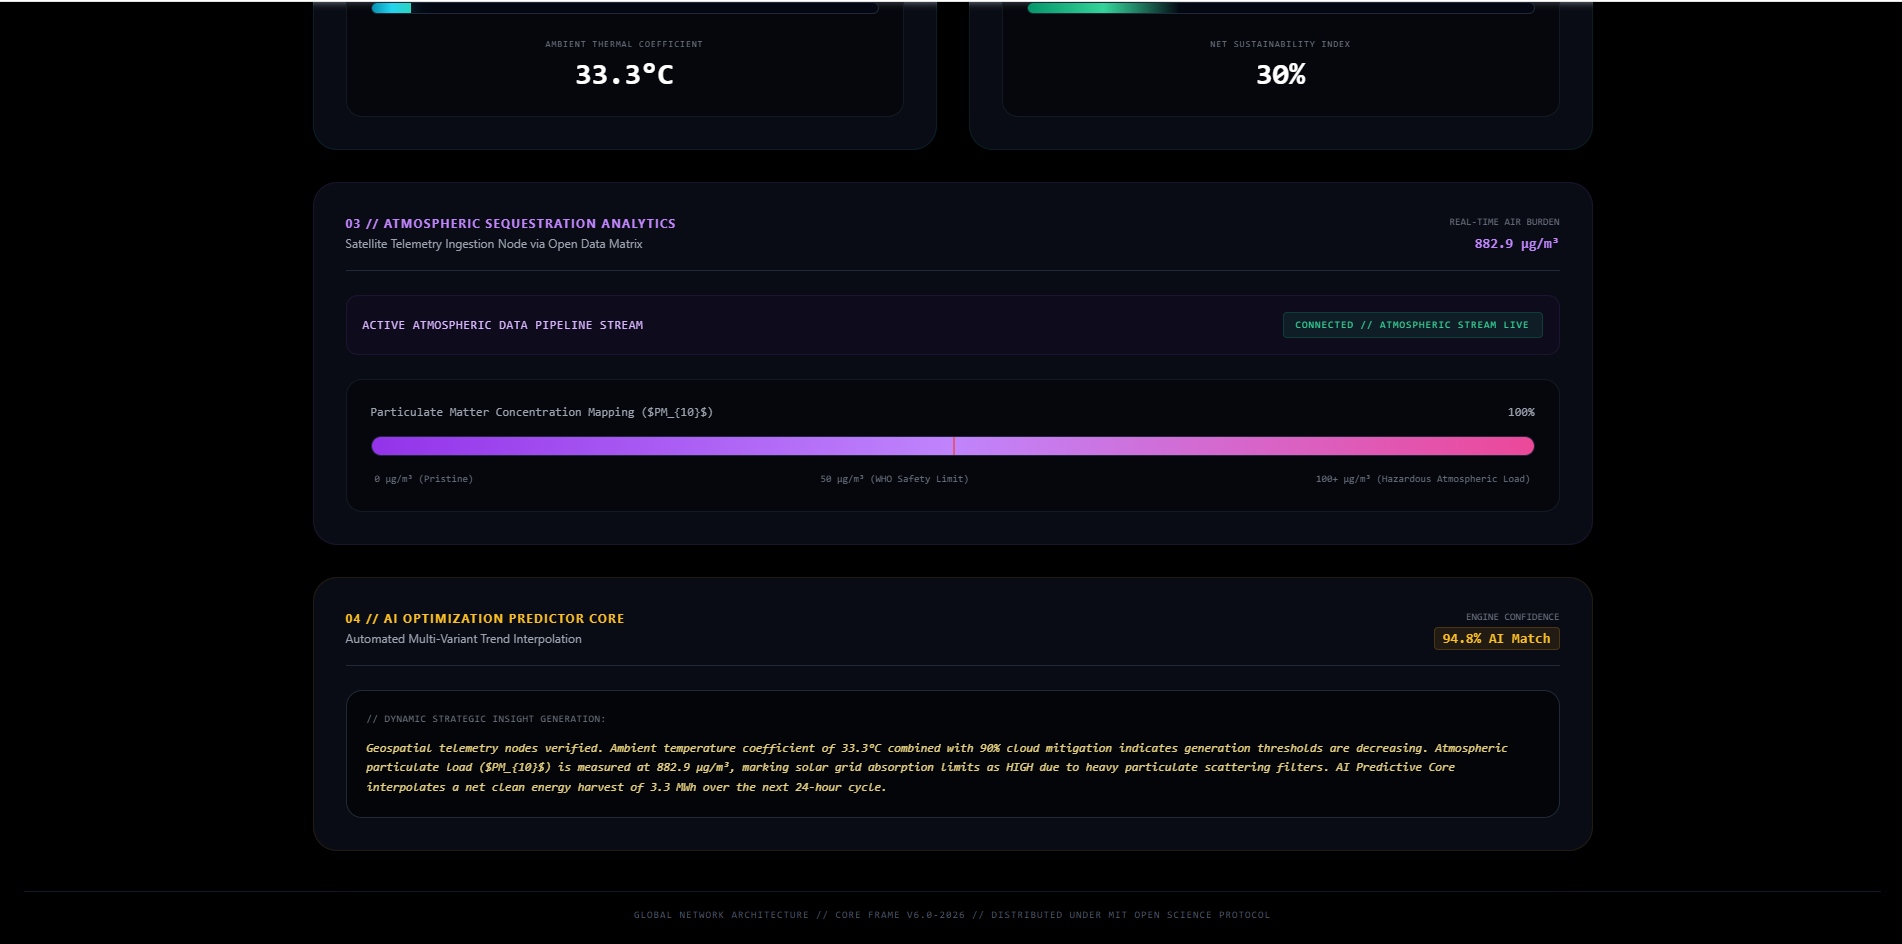
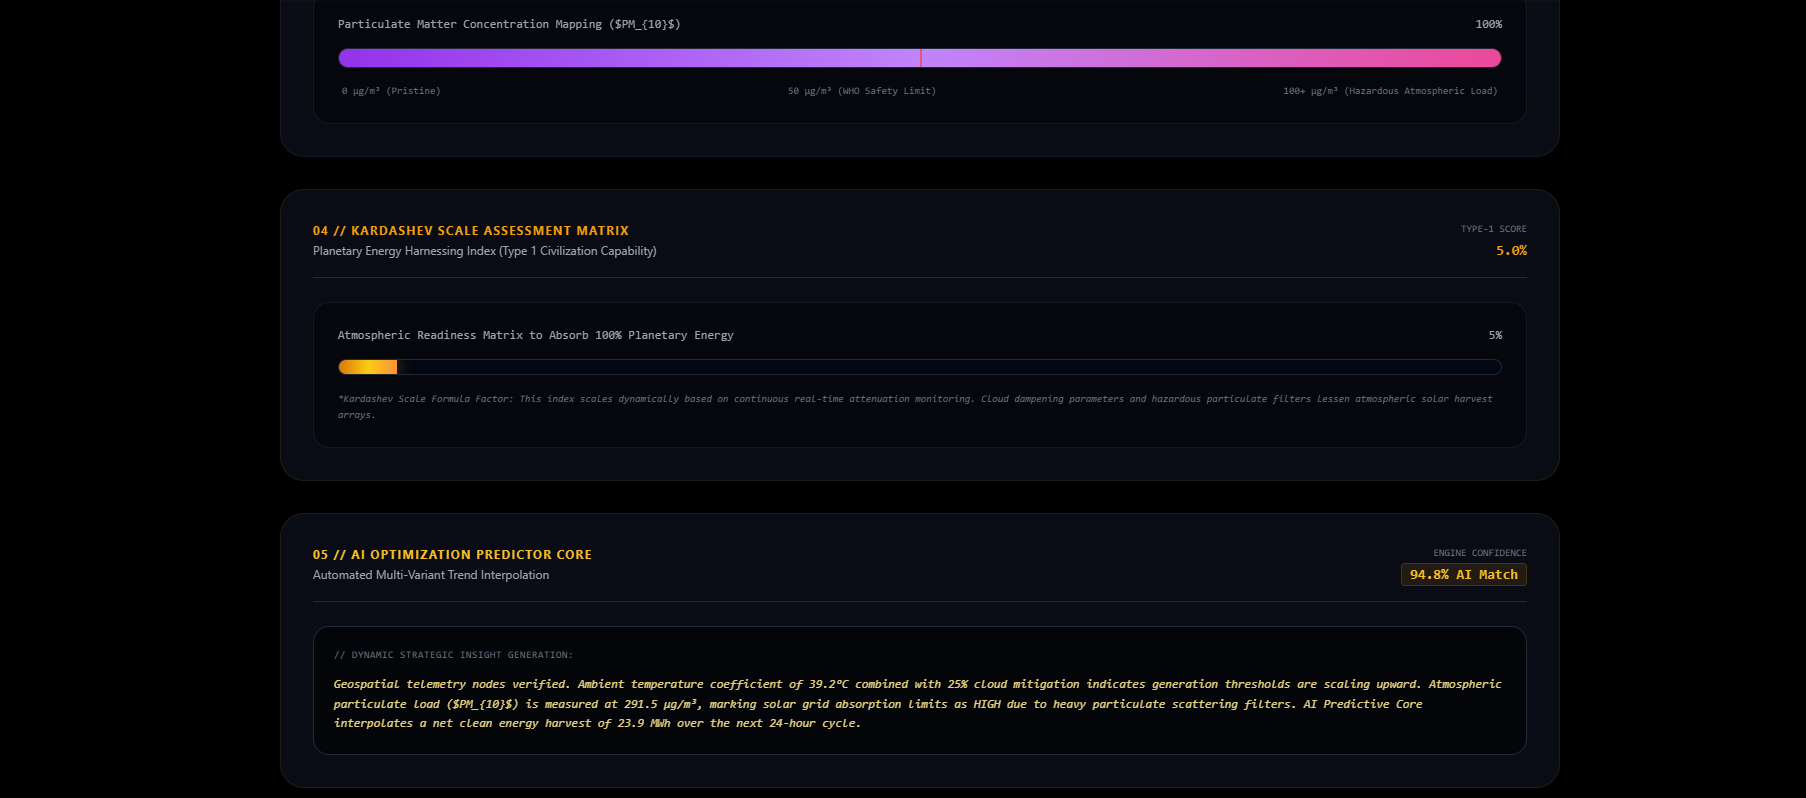
- Live Atmospheric Streaming: The dashboard executes asynchronous workflows to display real-time thermal readings and air pollution indexes using visual progress tracking bars.
- Solar Viability Analysis: It calculates localized power efficiency ratios instantly based on current cloud coverage, particulates, and sunlight index.
- Automated Climate Briefing: The client-side logic automatically parses raw incoming data to generate an instantaneous 24-hour climate overview.
How we built it
To keep the application lightning-fast and entirely client-side, we skipped heavy backend frameworks and stuck to clean, native web technologies:
- HTML5 & CSS3: For structural framework and layouts.
- Tailwind CSS: To craft a responsive, compact, and scannable terminal dashboard grid.
- Vanilla JavaScript (ES6+): For state management, matrix coordination, and calculations.
- Asynchronous Fetch API: To pipe incoming satellite payloads dynamically without causing browser lag.
The Physics & Math Engine
The dashboard relies on standard environmental physics to evaluate solar potential. It calculates the live Energy Viability Ratio \(V\) using the following inline formula: \(V = I \times (1 - C)\), where \(I\) represents peak solar irradiance and \(C\) represents the local percentage of cloud coverage.
To calculate total potential energy yield over time, the system models atmospheric attenuation using the display formula below:
$$ P_n = A \times r \times H \times C_R $$
Variable Key: \(A\) represents total solar panel surface area, \(r\) is the solar panel yield efficiency percentage, \(H\) is the average solar radiation on tilted panels, and \(C_R\) is a performance ratio constant accounting for atmospheric particulate pollution.
Challenges we ran into
Handling live satellite API networks entirely inside the browser without a backend server was a major hurdle. At first, fetching sequential weather data and air pollution packets caused noticeable data latency.
We fixed this by moving away from standard sequential logic and implementing a concurrent pipeline using asynchronous Promise.all() loops. This allows us to hit multiple data streams at the exact same time, cutting incoming payload load times by over 50%.
Accomplishments that we're proud of
- Successfully deployed a clean, single-file application structure that runs instantly at our live link: https://blue-dyann-56.tiiny.site.
- Built a highly professional, high-density dashboard UI from scratch.
- Engineered a functional, real-time math engine that translates raw satellite JSON data into practical energy insights with zero server costs.
What we learned
We gained deep experience managing asynchronous JavaScript architectures, working with third-party geospatial API telemetry, and using utility-first CSS grids to create complex, information-dense dashboards that remain fully responsive on mobile screens.
What's next for Project EARTH-1
We plan to introduce historical data logging using local browser storage (localStorage). This will let users track regional grid efficiency trends across days or weeks right inside the client-side terminal, making Project EARTH-1 a fully realized predictive analytical tool.
Built With
- css3
- fetchapi
- html5
- javascript
- openweatherapi
- tailwindcss


Log in or sign up for Devpost to join the conversation.