-
-
Overview
-
The Problem
-
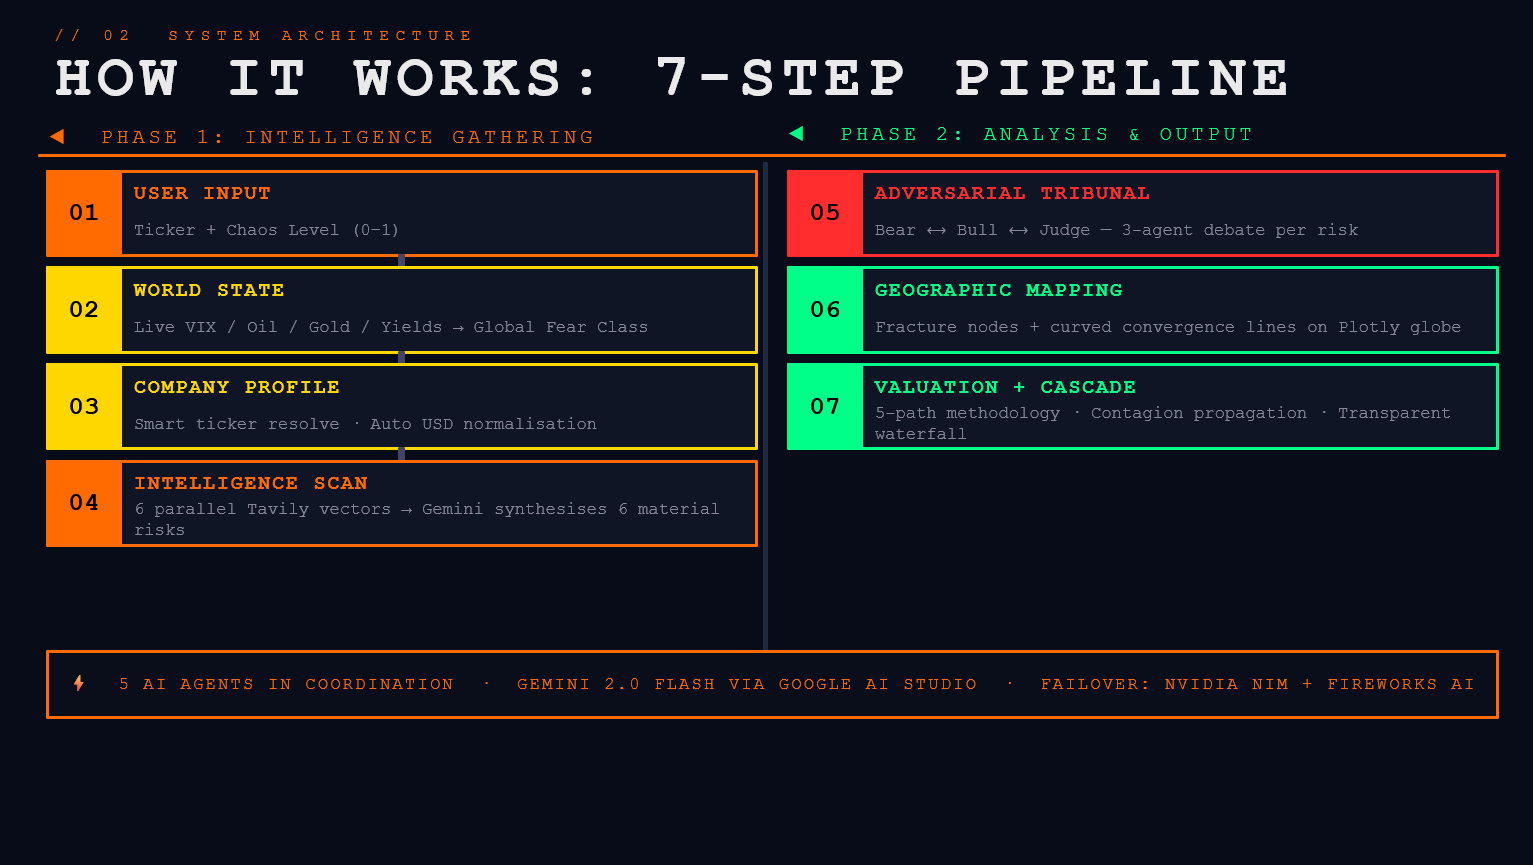
System Architecture
-

Multi-Agent System
-
Differentiators
-
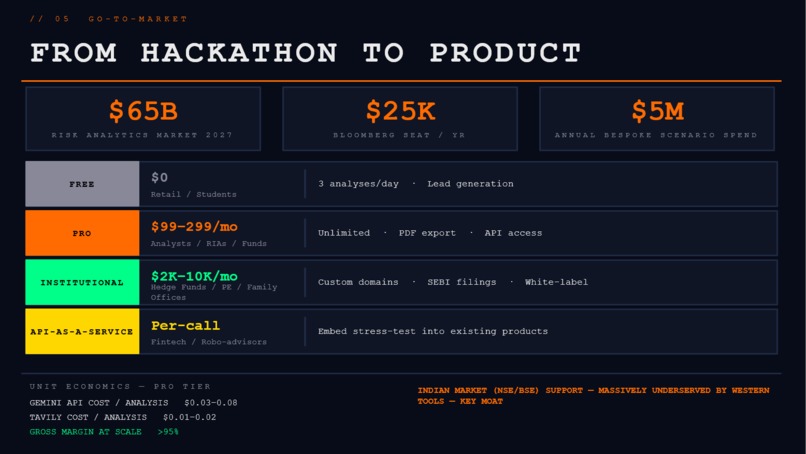
Go-To-Market
-
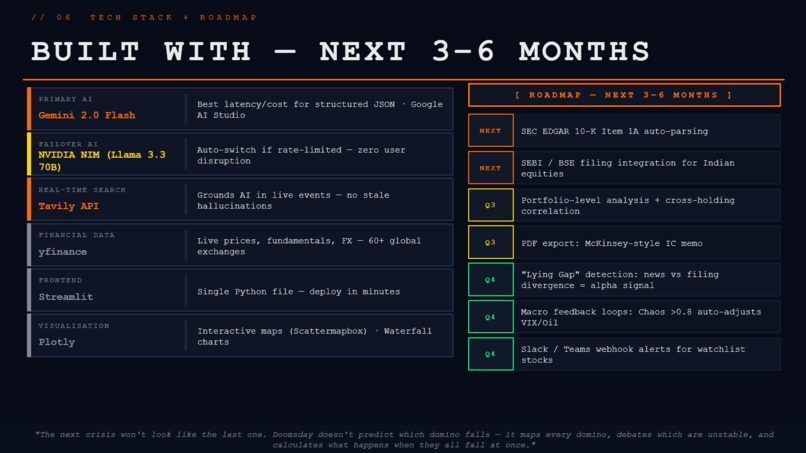
Tech Stack + Roadmap
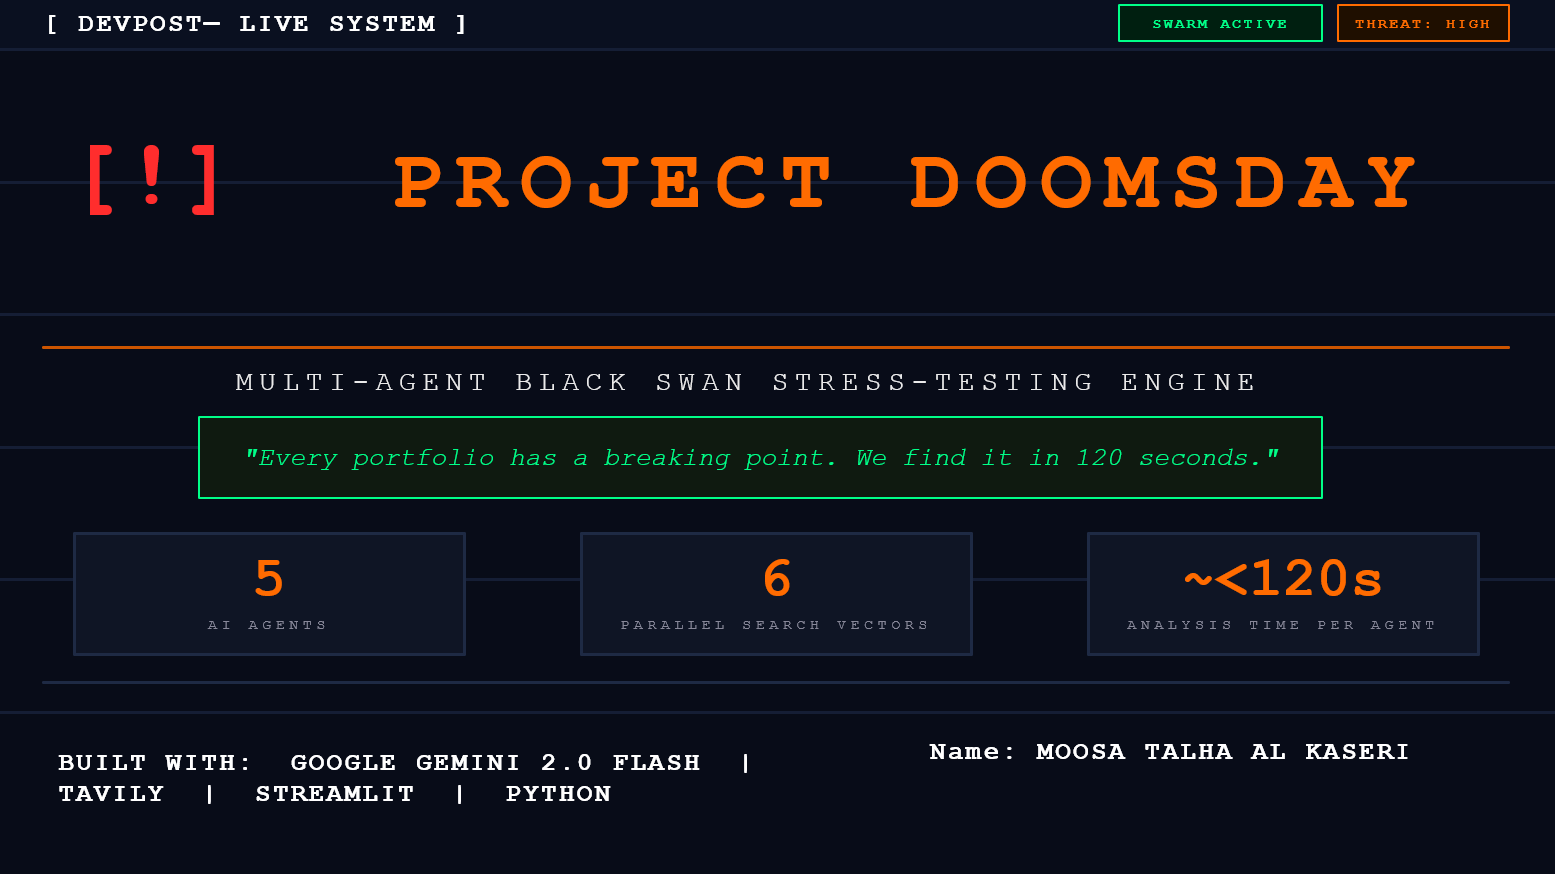


Project Doomsday: Multi-Agent Black Swan Stress-Testing Engine
💡 Inspiration
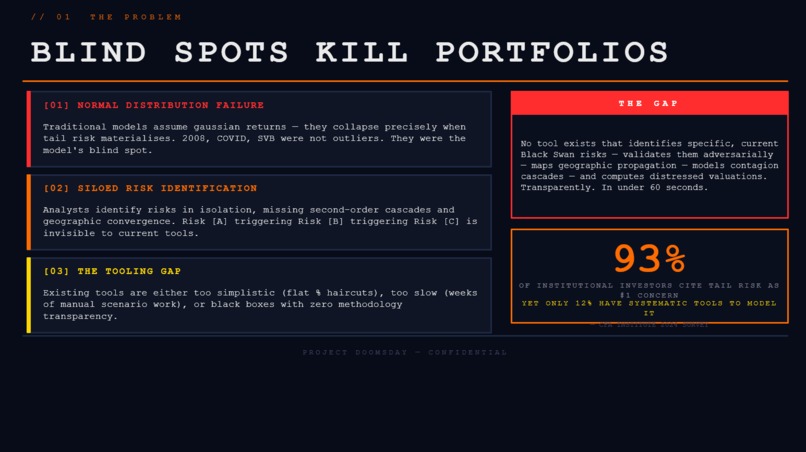
Traditional valuation models (such as Discounted Cash Flow) exist in a static bubble. They look backward at historical earnings or assume linear growth under ideal conditions, leaving investors blind to sudden, systemic external shocks.
If a company like TSMC looks stellar on paper, how does an escalating geopolitical risk in the Taiwan Strait affect its actual downside valuation? If a key supplier faces an environmental regulatory shutdown, how does that margin compression cascade down through the balance sheet?
We wanted to build an institutional-grade financial intelligence engine that makes stress-testing dynamic, adversarial, geographically grounded, and deeply interactive—all in under 120 seconds. Project Doomsday was born to bridge complex qualitative intelligence with highly rigorous quantitative valuation mathematics. We assume the market is broadly efficient, and we ask: what breaks it?
🛠️ How We Built It
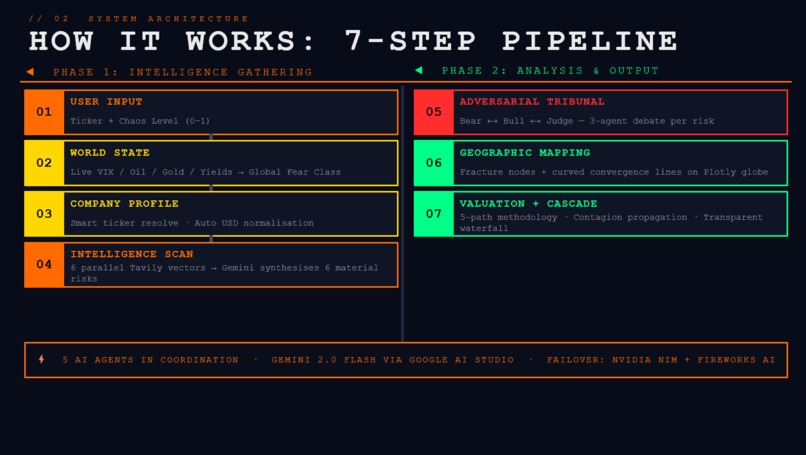
We structured Project Doomsday with a modular, highly resilient architecture:
1. The Real-Time Intelligence Layer
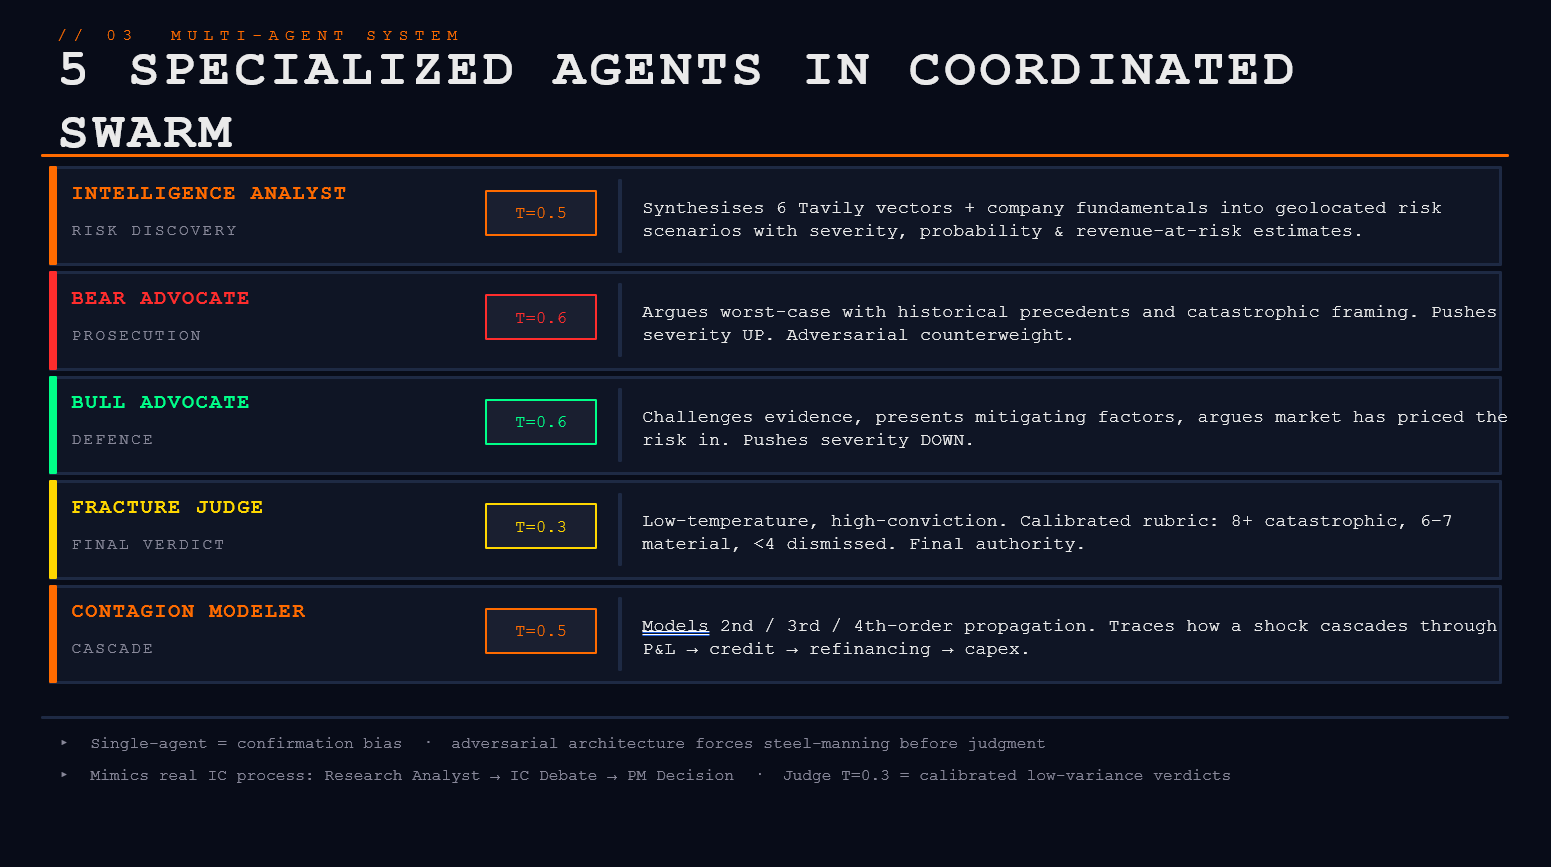
When a ticker is entered, the engine immediately spins up a multi-agent AI swarm. The swarm executes 6 parallel search vectors using Tavily’s Search API across Geopolitical, Supply Chain, Financial, Regulatory, Technology, and Macro domains. Using Google Gemini 2.0 Flash, these inputs are synthesized into 6 material, high-fidelity risk scenarios.
2. The Adversarial "Fracture Tribunal"
Instead of trusting a single LLM output, we implemented an adversarial tribunal debate:
- The Bear Advocate: Ruthlessly prosecutes the worst-case scenario using real-world historical precedents and negative estimates.
- The Bull Advocate: Challenges the evidence, presenting mitigating factors and market-pricing arguments.
- The Fracture Judge: Operating at a low temperature ($0.3$), the Judge analyzes the debate and assigns a calibrated severity score ($S_i \in [1, 10]$) and probability score ($P_i \in [0, 1]$). Only threats scoring $\ge 5$ impact the valuation.
3. The Multi-Model Valuation Router
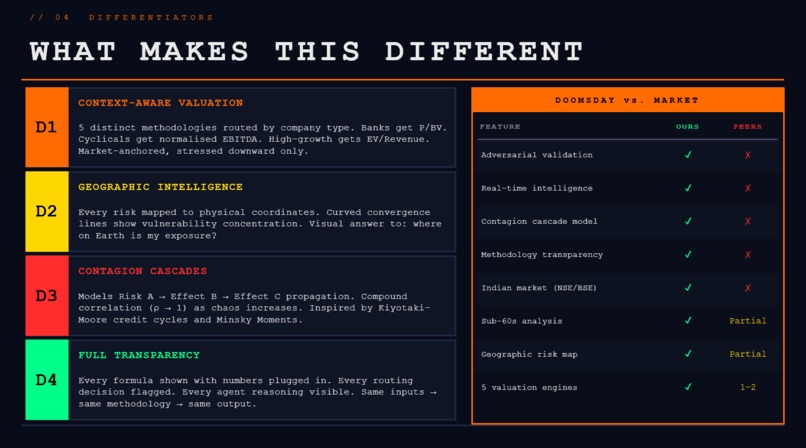
One size does not fit all in corporate finance. DCF models are meaningless for highly leveraged banks, and terminal values represent over 80% of DCF for early-stage growth companies. Our engine dynamically routes companies through 5 distinct mathematical engines:
- Path 1 (Financials): P/BV + Excess Return Model. $$V_{\text{base}} = BV_{0} + \sum_{t=1}^{5} \frac{(ROE_t - K_e) \times BV_{t-1}}{(1 + K_e)^t}$$
- Path 2 (High-Growth): EV/Revenue + Rule of 40 Multiples. $$\text{Fair EV} = \text{Revenue} \times \left( \frac{\text{Growth} + \text{Margin}}{100} \right) \times \text{Multiple}$$
- Path 3 (Mature Profitable): 5-Year Free Cash Flow (FCF) DCF with Gordon Growth Terminal Value. $$V_{\text{base}} = \sum_{t=1}^{5} \frac{FCF_t}{(1 + WACC)^t} + \frac{FCF_5 \times (1 + g)}{(WACC - g) \times (1 + WACC)^5}$$
- Path 4 (Cyclical): Normalized Mid-Cycle EBITDA with a structural safety haircut.
- Path 5 (Loss-Making): EV/Revenue capped strictly at $5\text{x}$ as a revenue anchor.
4. Global Fracture & Spoke-and-Hub Mapping
We translate abstract risks into coordinates on an interactive dark-matter world map via Plotly. The engine calculates the company's HQ location and draws arcing, red geographic convergence lines representing physical supply chain, regulatory, or macroeconomic threats arcing from risk nexuses directly toward the HQ.
5. Stress Waterfalls & Contagion Cascades
We model risk propagation non-linearly:
- WACC Risk Premium Injection: Dynamic adjustments based on aggregate severity ($S$) and variable stress chaos ($C \in [0, 1]$): $$WACC_{\text{stressed}} = WACC_{\text{base}} + \phi \times C \times \sum_{i} P_i \times S_i$$
- Waterfall Valuation Destruction: Calculated across four simultaneous vectors (revenue haircut, margin compression, multiple de-rating, and WACC premium) and rendered as a step-down waterfall chart.
- Contagion Cascade Model ($R_0$): Simulates how a primary shock propagates into second and third-order financial distress (e.g., input cost spike $\to$ credit downgrade $\to$ refinancing cost jump $\to$ capex cuts). The total compound impact models systemic crisis correlation where diversification benefits decay: $$\text{Contagion Score} = 1 - \prod_{j=1}^{3} \left( 1 - S_j \times C \times \rho_{\text{crisis}} \right)$$
🚦 Challenges We Faced
- Traditional Stock API Fragility:
Equities databases (like
yfinance) regularly experience rate-limiting, missing metrics, or currency conversion errors for regional markets (e.g., Indian NSE/BSE tickers). We solved this by designing a Deep Intelligence Fallback system. If standard financial data retrievals fail, a specialized agent scrapes the latest regulatory filing or public balance sheet directly using Tavily search. - The "Agreeable AI" Trap: In early iterations, the Bull and Bear agents would constantly agree, diluting the intensity of the debate. We resolved this by building strict system prompts, implementing high-temperature reasoning parameters for the advocates to maximize creative skepticism, and utilizing a highly analytical low-temperature Judge to enforce structural discipline.
- Visualizing Abstract Risk Geographically: Translating a qualitative risk statement like "Suez Canal blockage" into spatial lat/lon coordinates is non-trivial. We engineered a spatial extraction pipeline using Google Gemini to output clean JSON arrays containing validated coordinates, enabling Plotly to render smooth spoke-and-hub geopaths accurately without breaking the UI.
- ASCII-Only sanitization & UI State Locks: During high-load sessions, custom emojis or complex encoding symbols caused rendering locks in the Streamlit web app. We performed a systematic codebase sanitization, migrating the terminal feed, status indicators, and logs to ASCII-only format while maintaining a gorgeous command-center design using custom CSS injections and monospace typography.
🧠 What We Learned
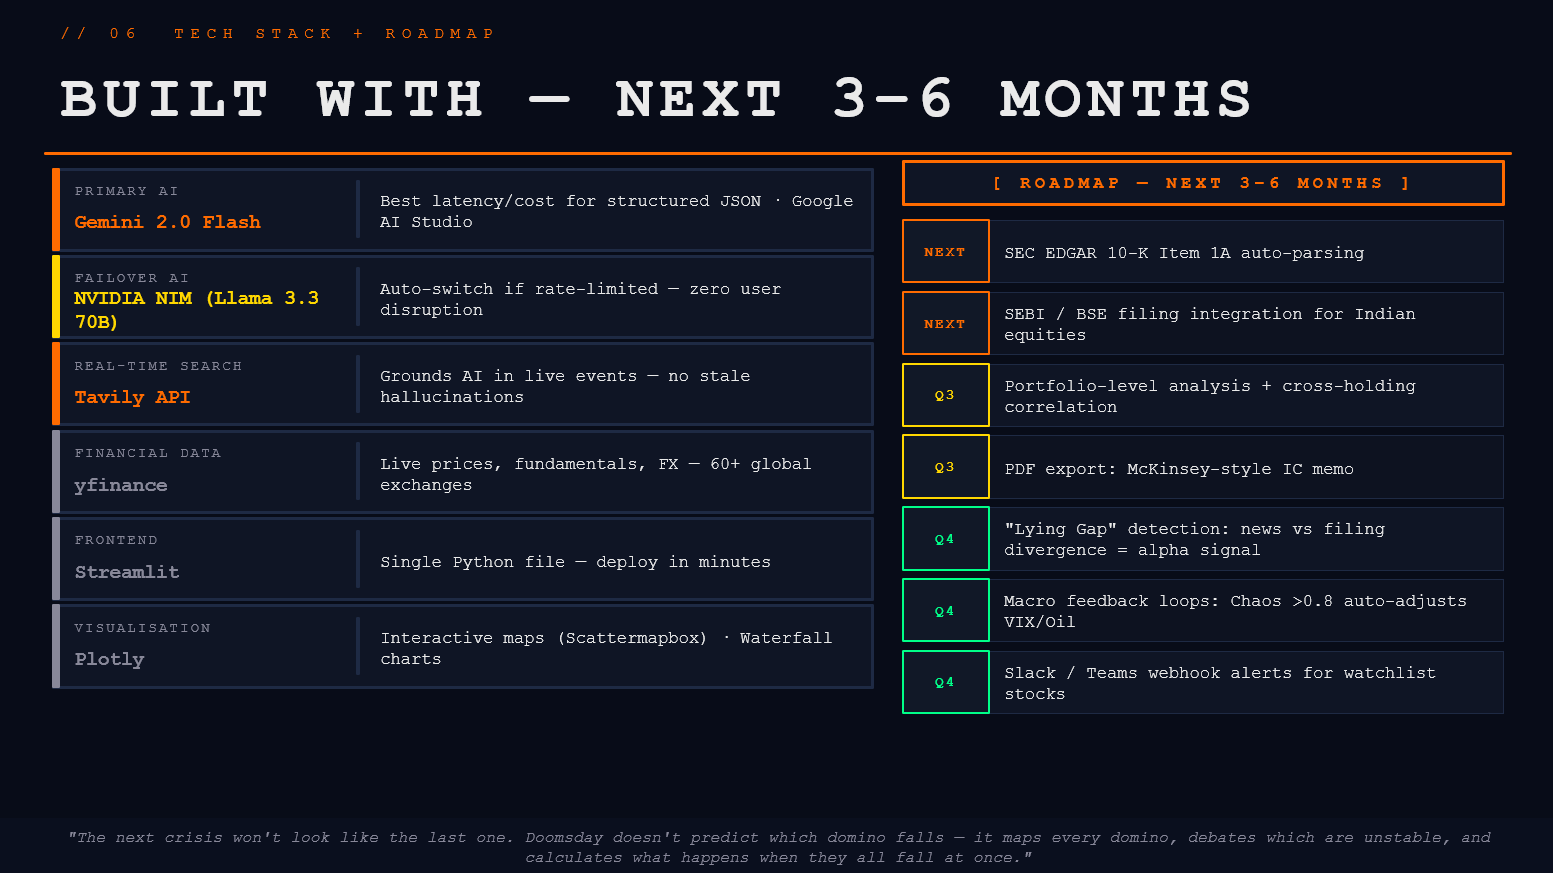
- Modular AI Resilience: Building a Unified AI Client that handles automatic failovers between Google Gemini, NVIDIA NIM, and Fireworks AI taught us the importance of zero-downtime engineering in production LLM applications.
- Qualitative-Quantitative Fusion: We learned how to mathematically map qualitative geopolitical risks directly to accounting and corporate finance line items (WACC, Operating Margins, multiple compression factors) rather than relying on subjective guesswork.
- Diversification Decay: Designing the contagion cascade taught us that during global systemic crises, correlations ($\rho$) rapidly converge toward $1.0$, rendering traditional portfolio diversification strategies ineffective.
🚀 What's Next for Project Doomsday
- Supply Chain Vulnerability Sub-graphs: Pulling public bill-of-lading and customs shipping data to map the physical transit of goods, identifying bottlenecks like the Straits of Malacca or Panama Canal.
- Real-Time Macro Feeds: Integrating live feeds from treasury yields, oil futures, and VIX indices to continuously feed into the base World State model.
- PDF Investment Committee Memo Export: Adding one-click institutional-grade reporting so equity researchers can immediately download the Bear/Bull debate logs, global fracture map, and distressed DCF tables as a board-ready executive brief.
Built With
- ai
- claude
- nvidia
- tavily
- visual-studio


Log in or sign up for Devpost to join the conversation.