-
-
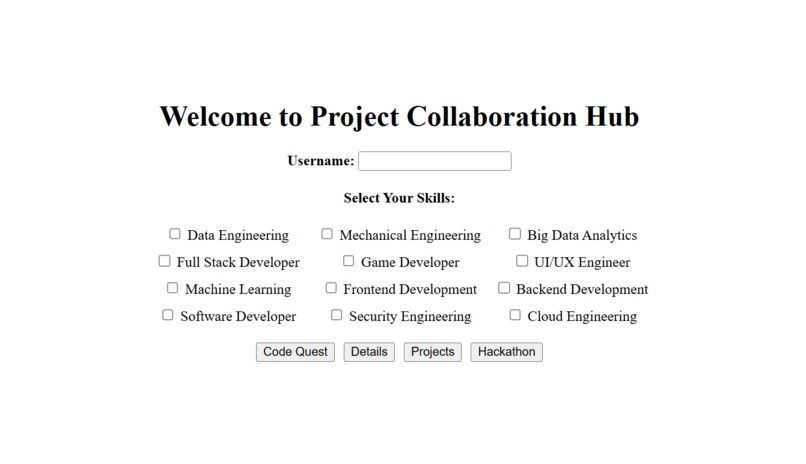
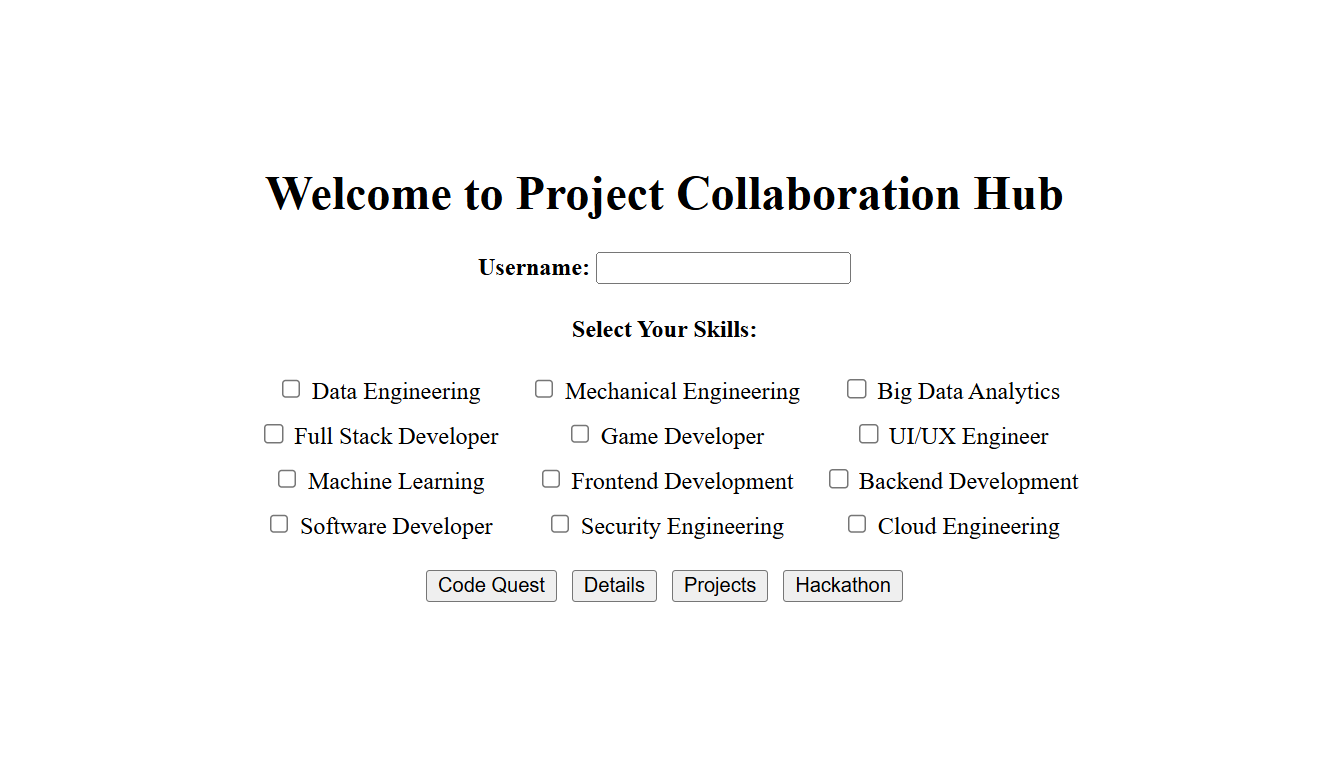
HOME PAGE
-
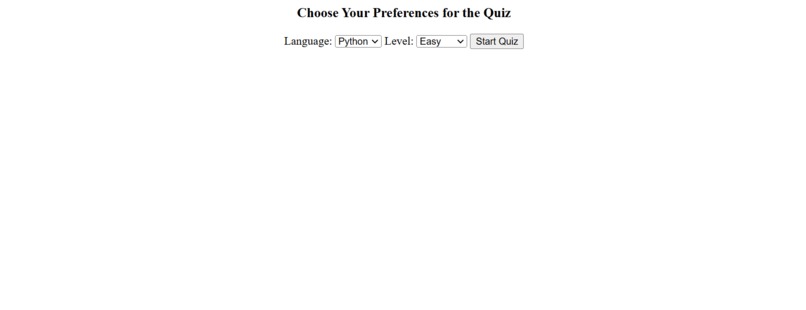
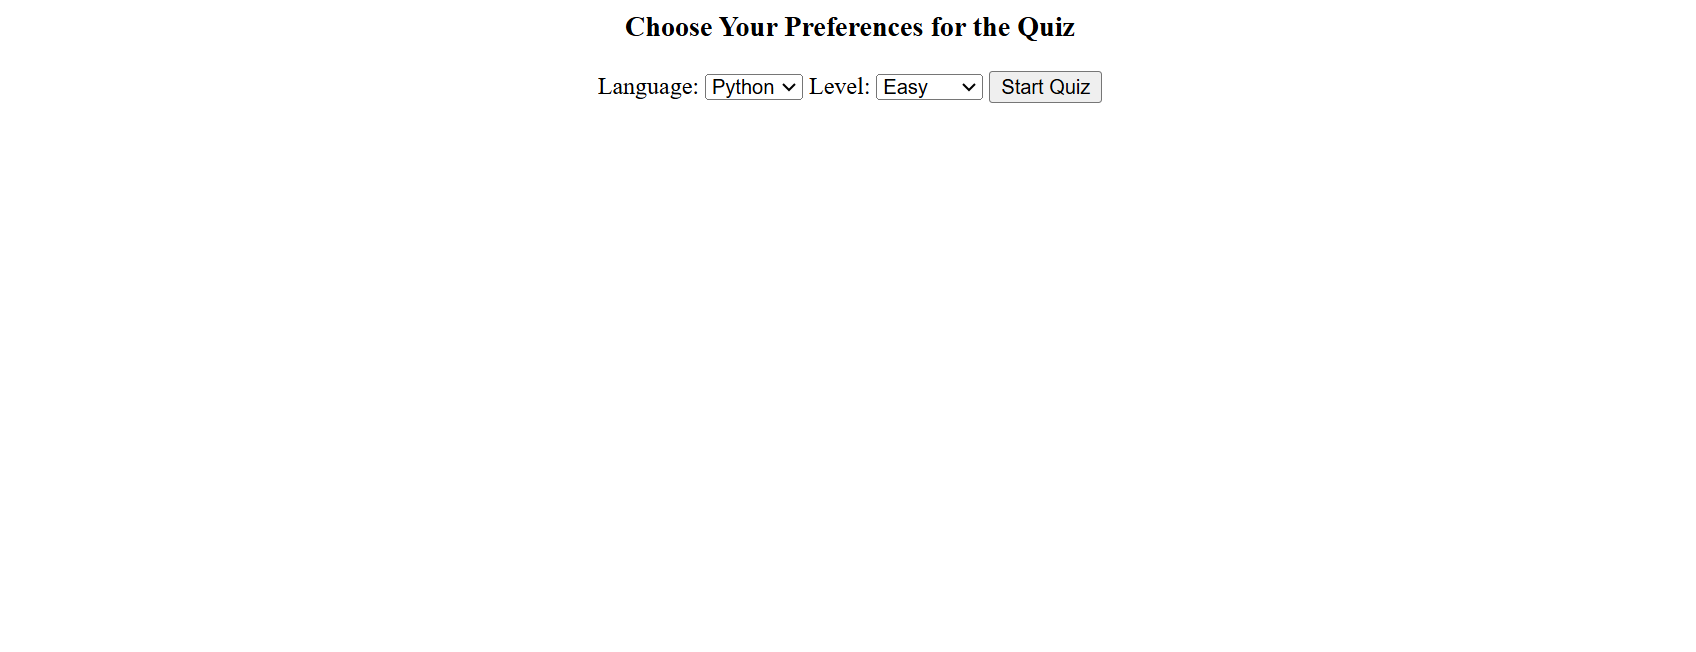
CODE QUEST SECTION
-
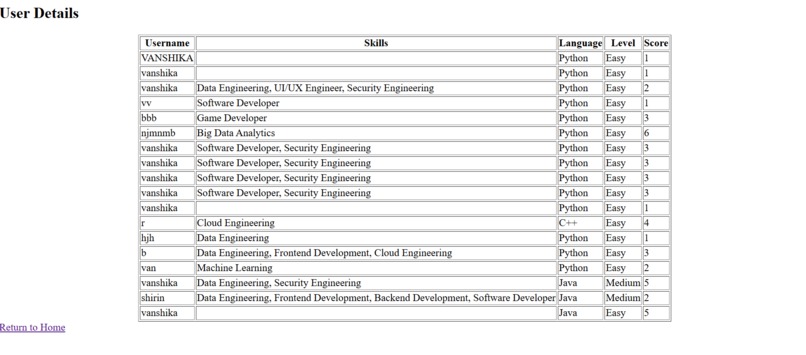
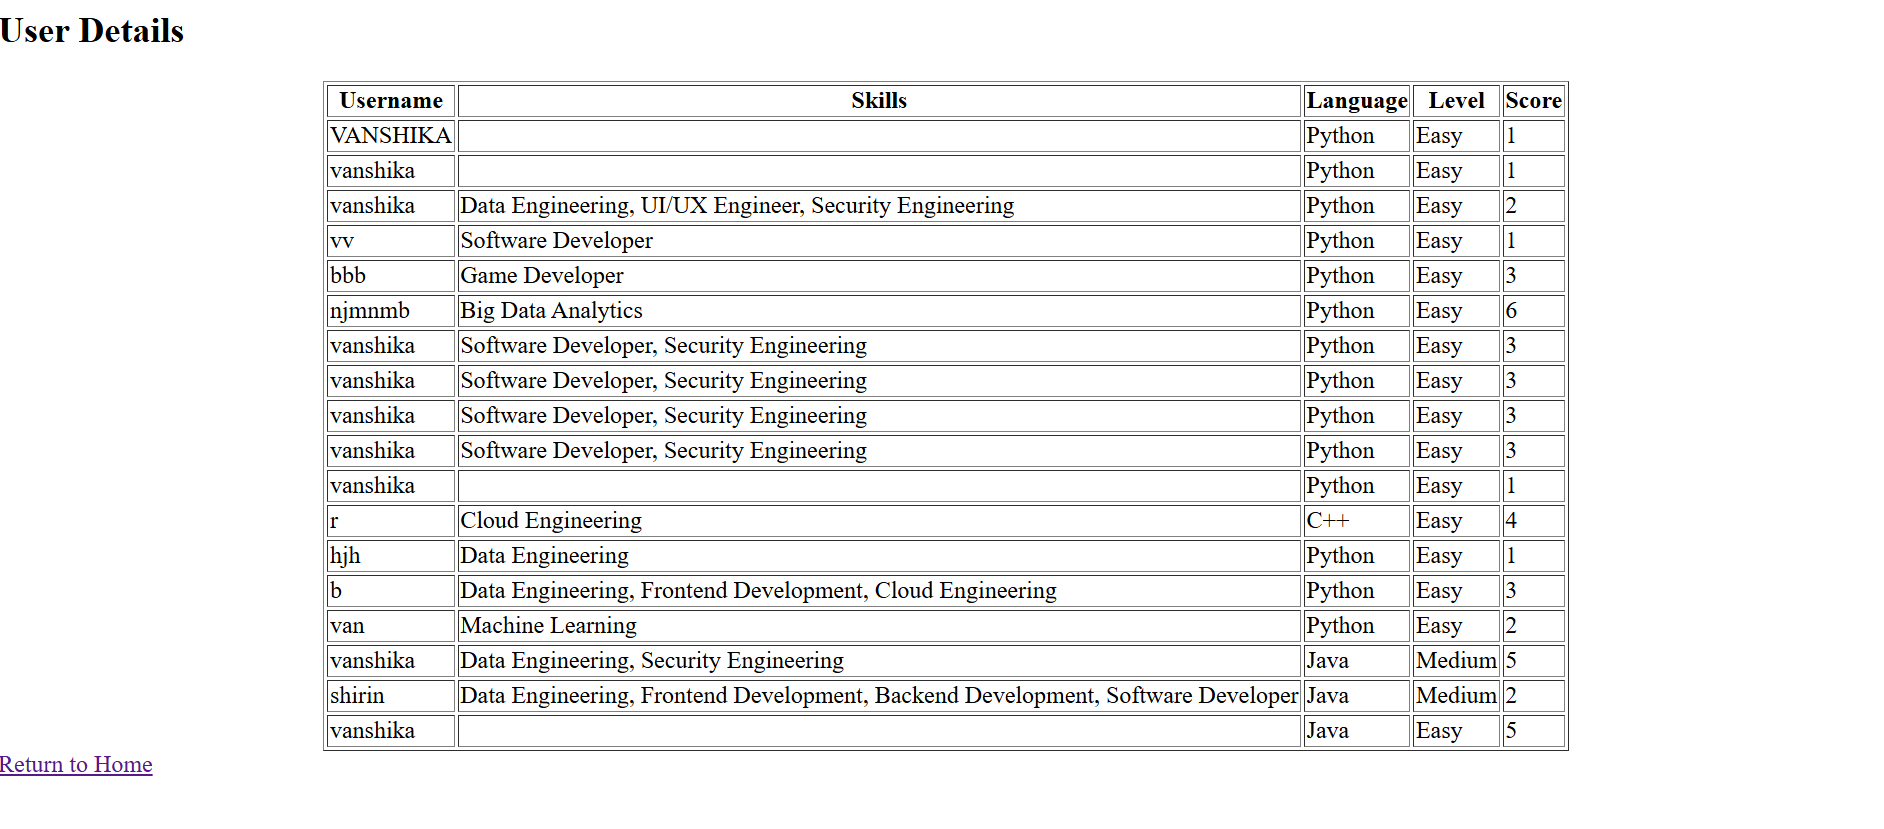
USER DETAILS SECTION
-
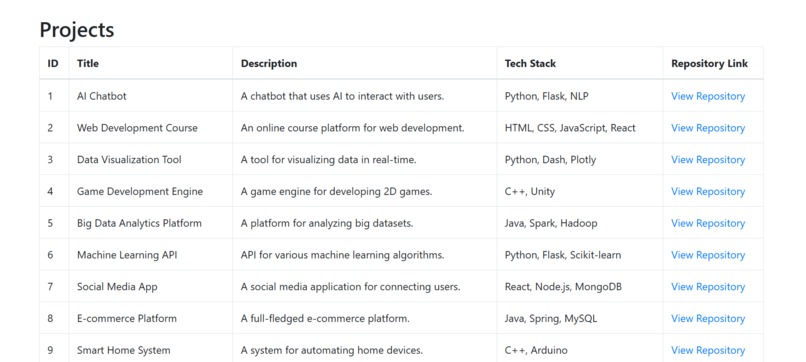
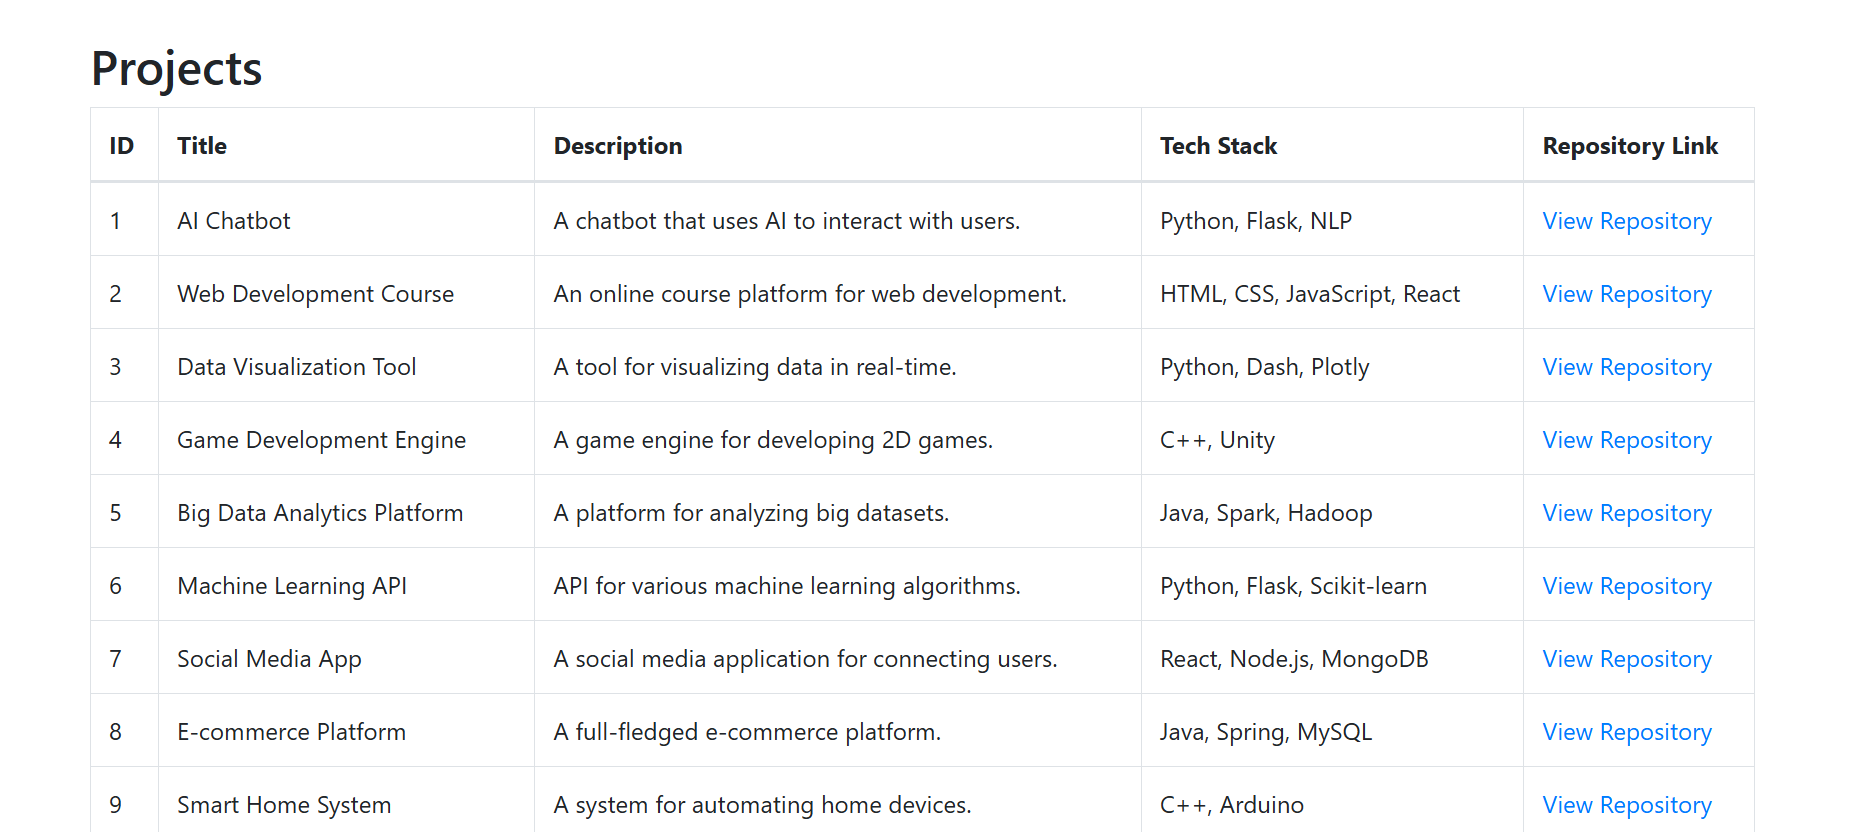
PROJECTS SECTION
-
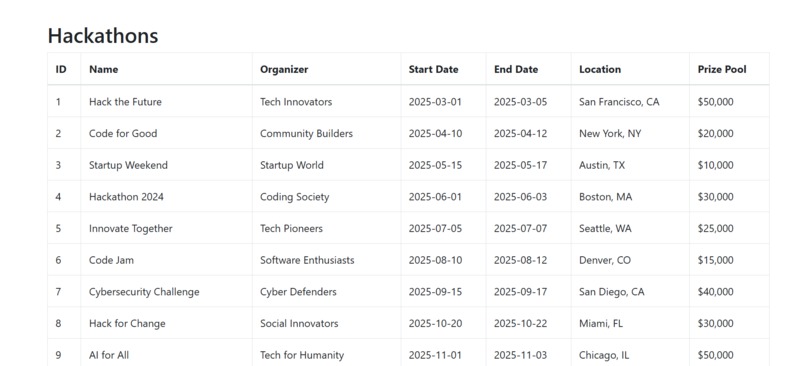
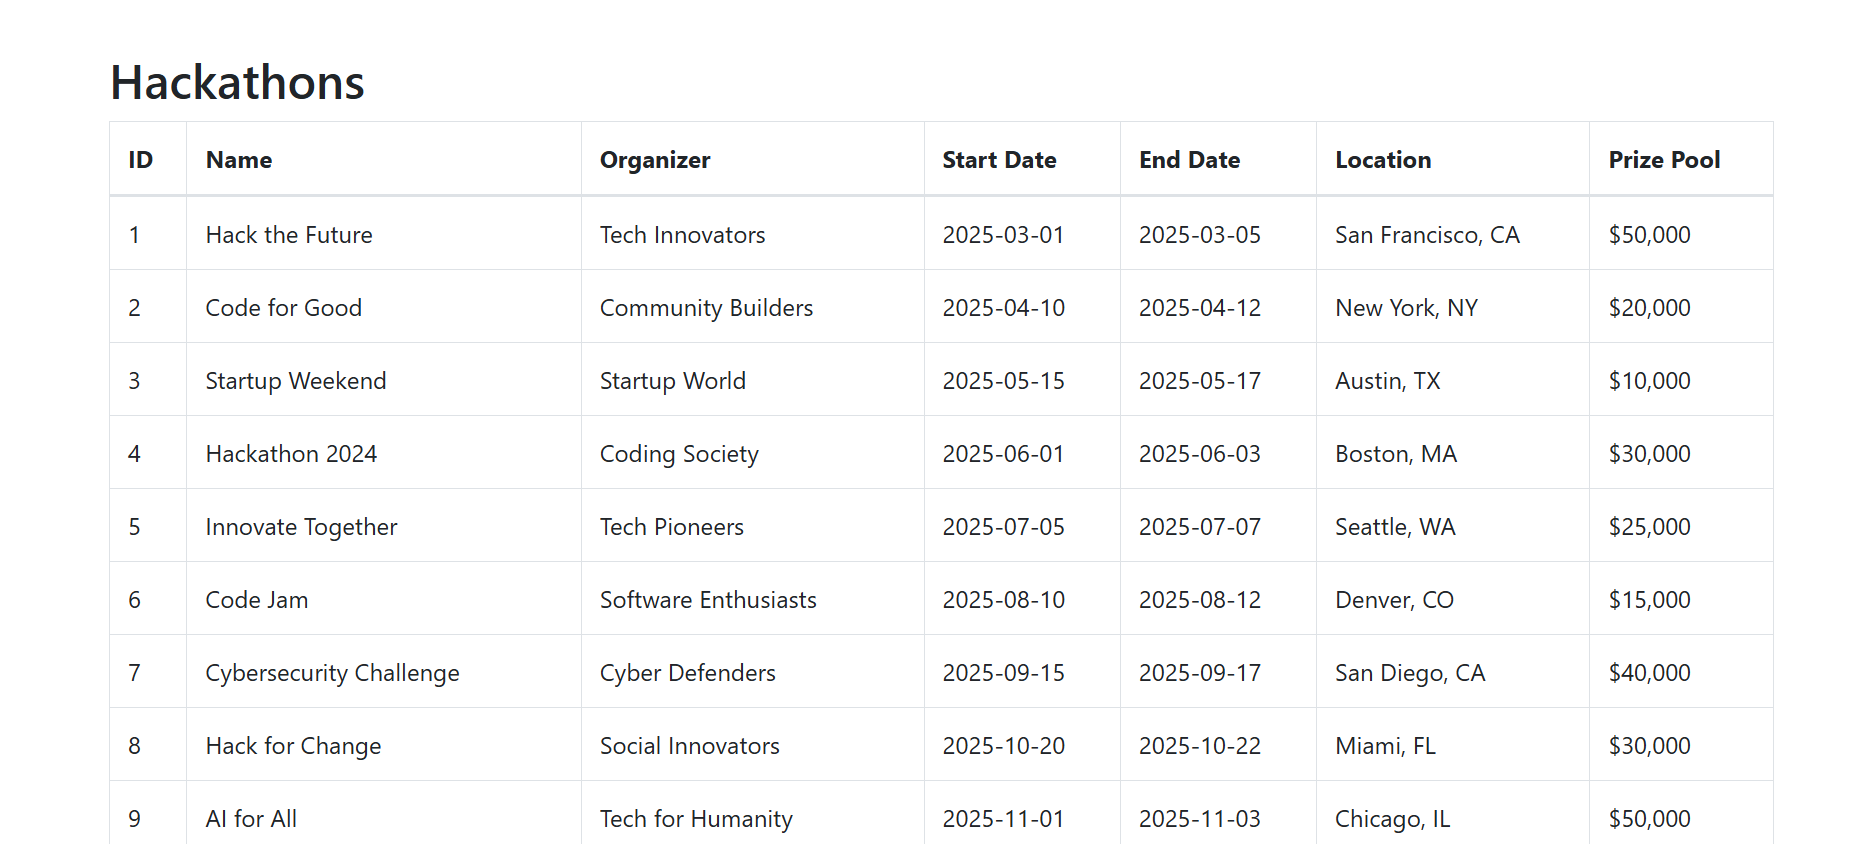
HACKATHONS SECTION
Inspiration
The inspiration behind this project was to create a dynamic and interactive platform that bridges the gap between learning and opportunity. I wanted to combine data visualization with practical skill assessment and real-world applications, making it an engaging tool for both learners and professionals.
What it does
The project offers a web-based interface where users can:
- Take coding tests in Java, Python, and C++ across multiple difficulty levels.
- View performance insights through graphs like confusion matrix, accuracy, and feature importance.
- Explore project opportunities and hackathons, complete with details like dates, location, and prize pools.
- Track their progress, skills, and test scores in the User Details section.
How we built it
- Backend: Jupyter Notebook was used with Python libraries such as Flask for web integration.
- Visualization:Matplotlib and Seaborn were employed to create performance graphs.
- Frontend: Dynamic web pages were designed with buttons for User Details, Code Quest, Projects, and Hackathons.
- Logic Implementation: Coding challenges and scoring systems were developed, dynamically updating user data.
Challenges we ran into
- Data Visualization: Ensuring graphs were both accurate and visually appealing required fine-tuning parameters and layouts.
- Dynamic Web Links: Building a seamless transition between the Jupyter Notebook and the web interface posed technical challenges.
- User Interaction: Developing a system to dynamically update user scores and project selections in real time was complex.
- Integration: Merging coding tests, project details, and hackathon listings into a cohesive system demanded careful planning and testing.
- Question Variability: Ensuring that questions appear differently every time required the development of an advanced randomization and question-banking algorithm to maintain fairness and engagement.
Accomplishments that we're proud of
- Successfully built a seamless and interactive platform.
- Developed visually appealing and accurate performance metrics.
- Integrated diverse functionalities like coding tests, project exploration, and hackathon listings into a cohesive user experience.
- Achieved effective randomization in question delivery, ensuring unique and engaging experiences for users.
What we learned
- Advanced graphing techniques for performance visualization.
- Building dynamic web applications using Flask and Jupyter Notebook.
- Effective UI/UX design to ensure user engagement and satisfaction.
- The importance of real-time data handling in interactive platforms.
What's next for PROJECT COLLABORATION HUB
- Adding more languages and test categories to Code Quest.
- Incorporating a leaderboard to encourage healthy competition.
- Expanding project and hackathon listings with direct application options.
- Enhancing the UI for a more polished and user-friendly experience.
")
")
Log in or sign up for Devpost to join the conversation.