Inspiration
Our inspiration comes from our combined experiences working with data visualization, machine learning, and finance. While backgrounds might differ, managing personal finance is a necessity. A tool that simplifies the experience is an asset to everyone. According to an Intuit survey, over 60% of people are unaware of the amount of money that they are spending, establishing the need for banking apps that help monitor a user’s transactions and account balances. However, many people have faced issues with current banking apps provided by various institutions. In a recent survey, 47% of participants claimed they were experiencing poor user interface and 37% claimed a lack of enough features.
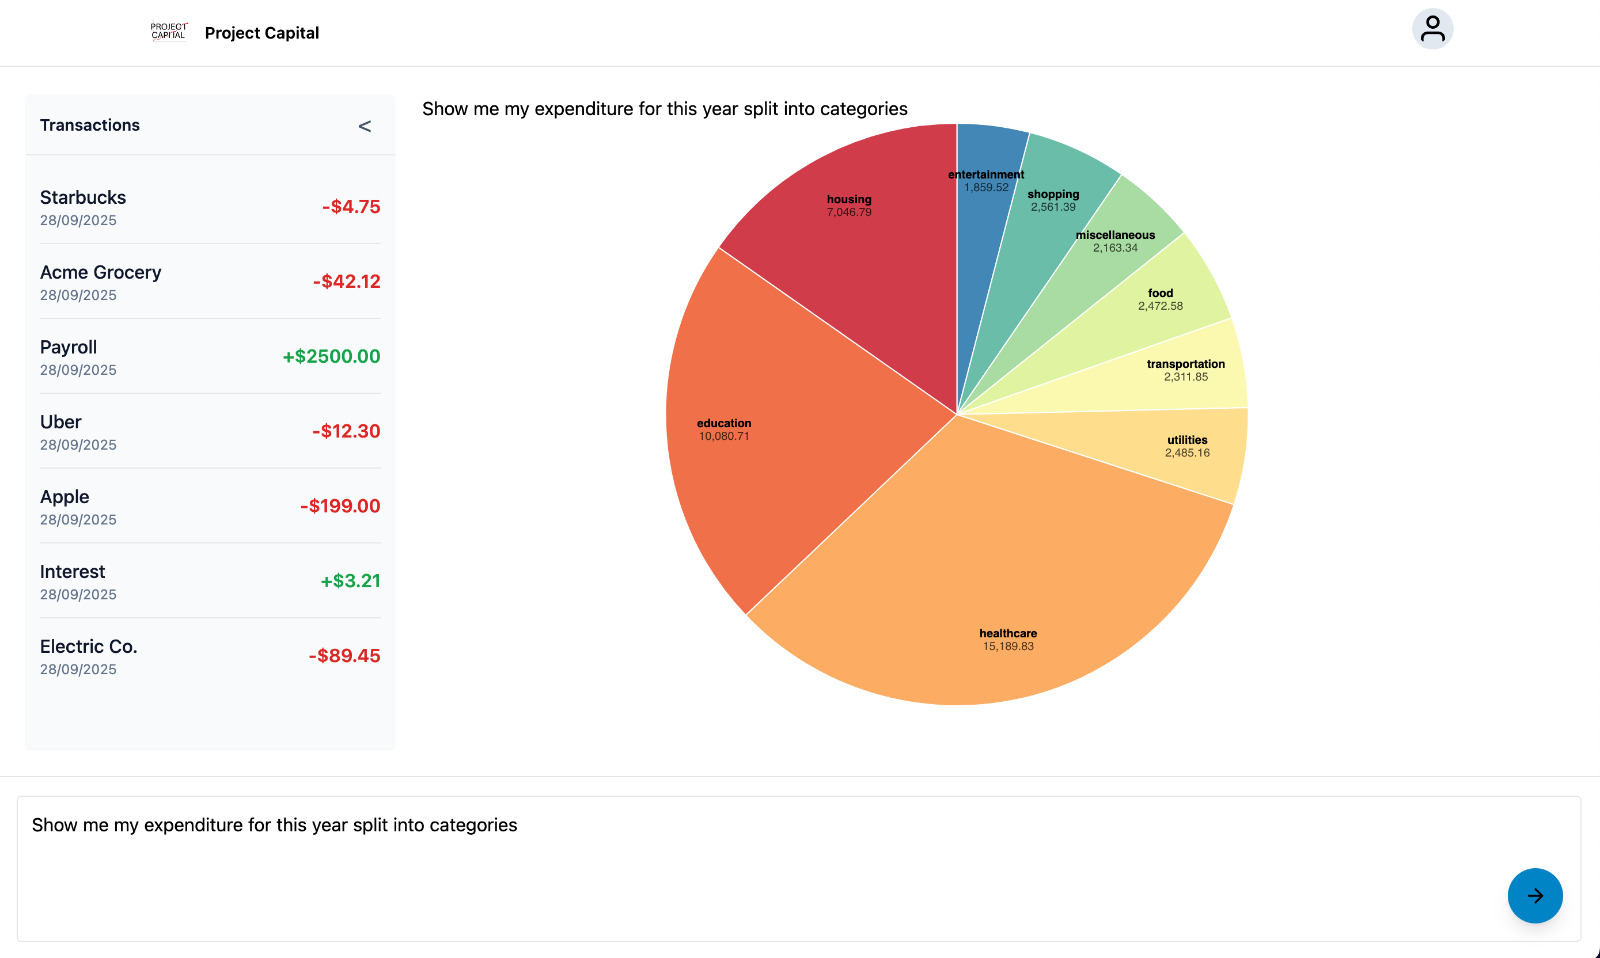
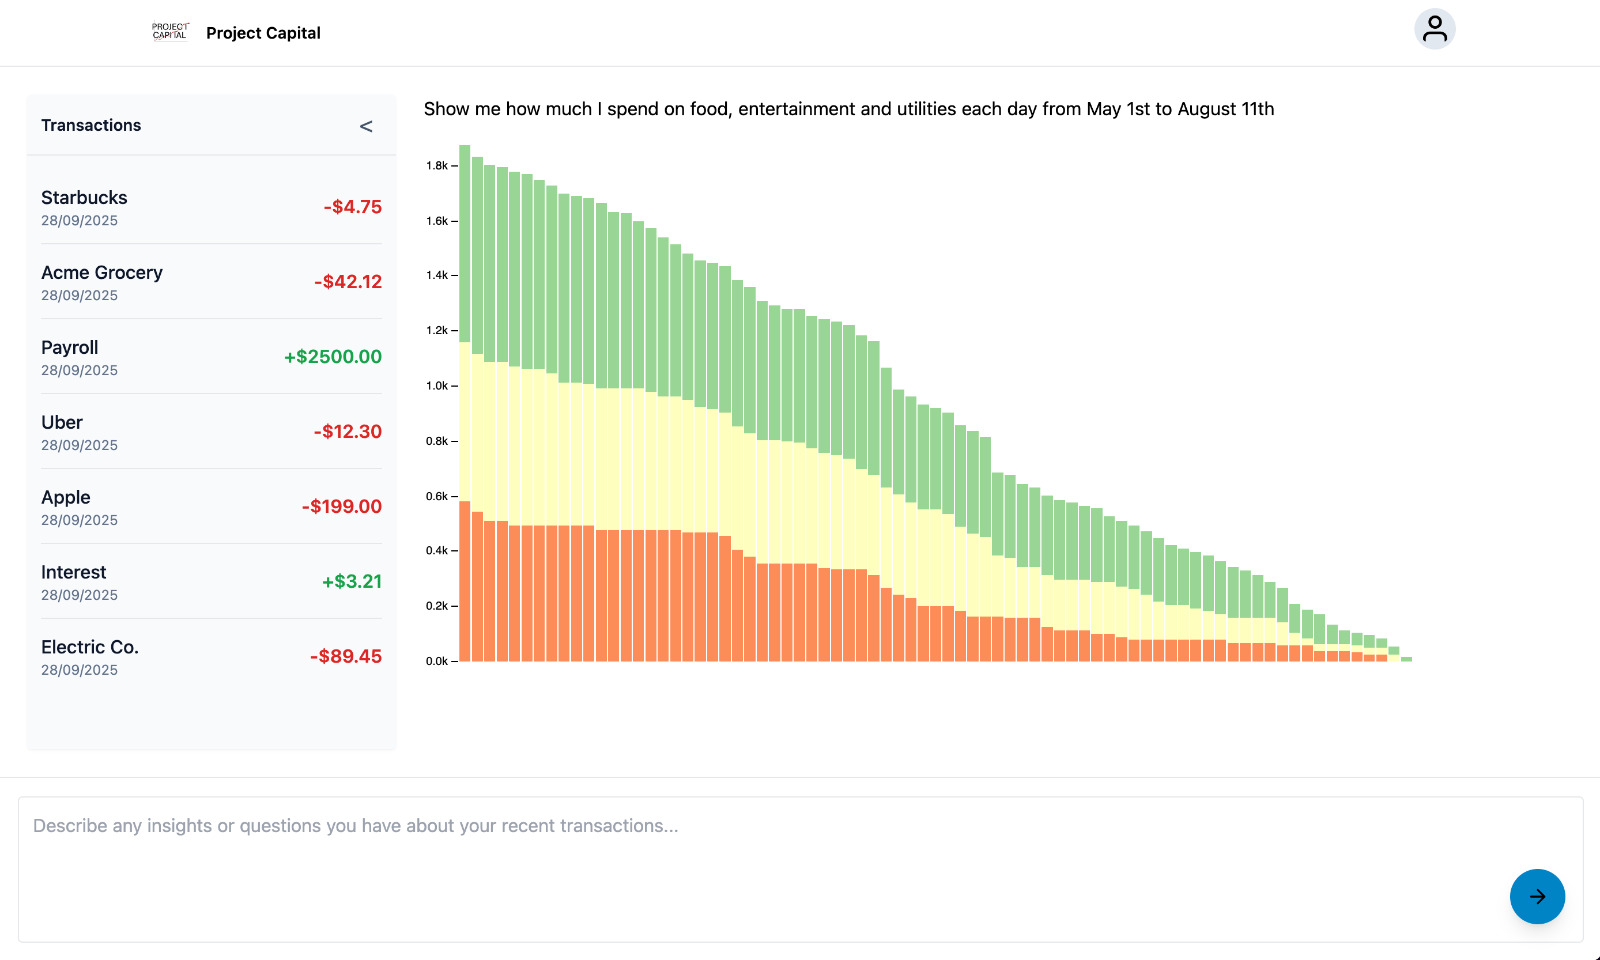
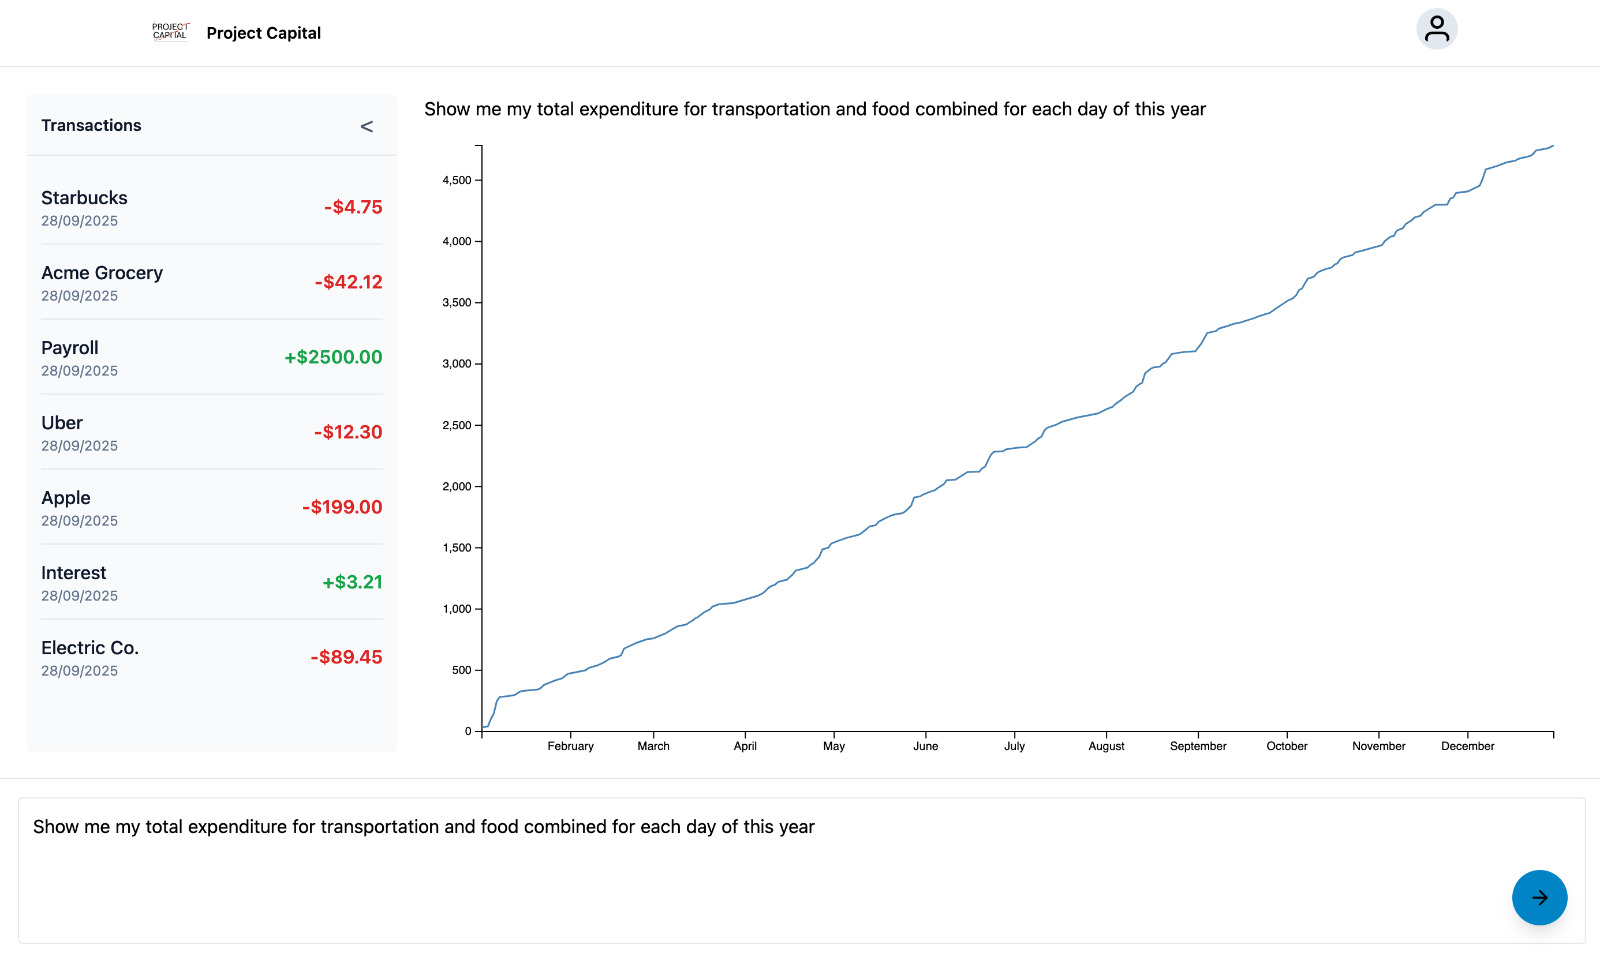
That’s why we created a banking app providing information about transactions and accompanying visualization to illustrate the data. Instead of creating pre-selected options for features, which often fail to include important information or contain unnecessary information, we created a conversational interface, where users can input questions relating to their banking data. The banking data stored in our system for each transaction is the monetary amount, date of transaction, card type, transaction ID, and the customer’s account ID. For example, this includes transactions that occurred within particular periods of time and the distribution between various categories of spending. Each query will be supported with a graph that best supports the data for the corresponding question. Additionally, there will also be a chart illustrating every transaction in chronological order, including the data and place of purchase.
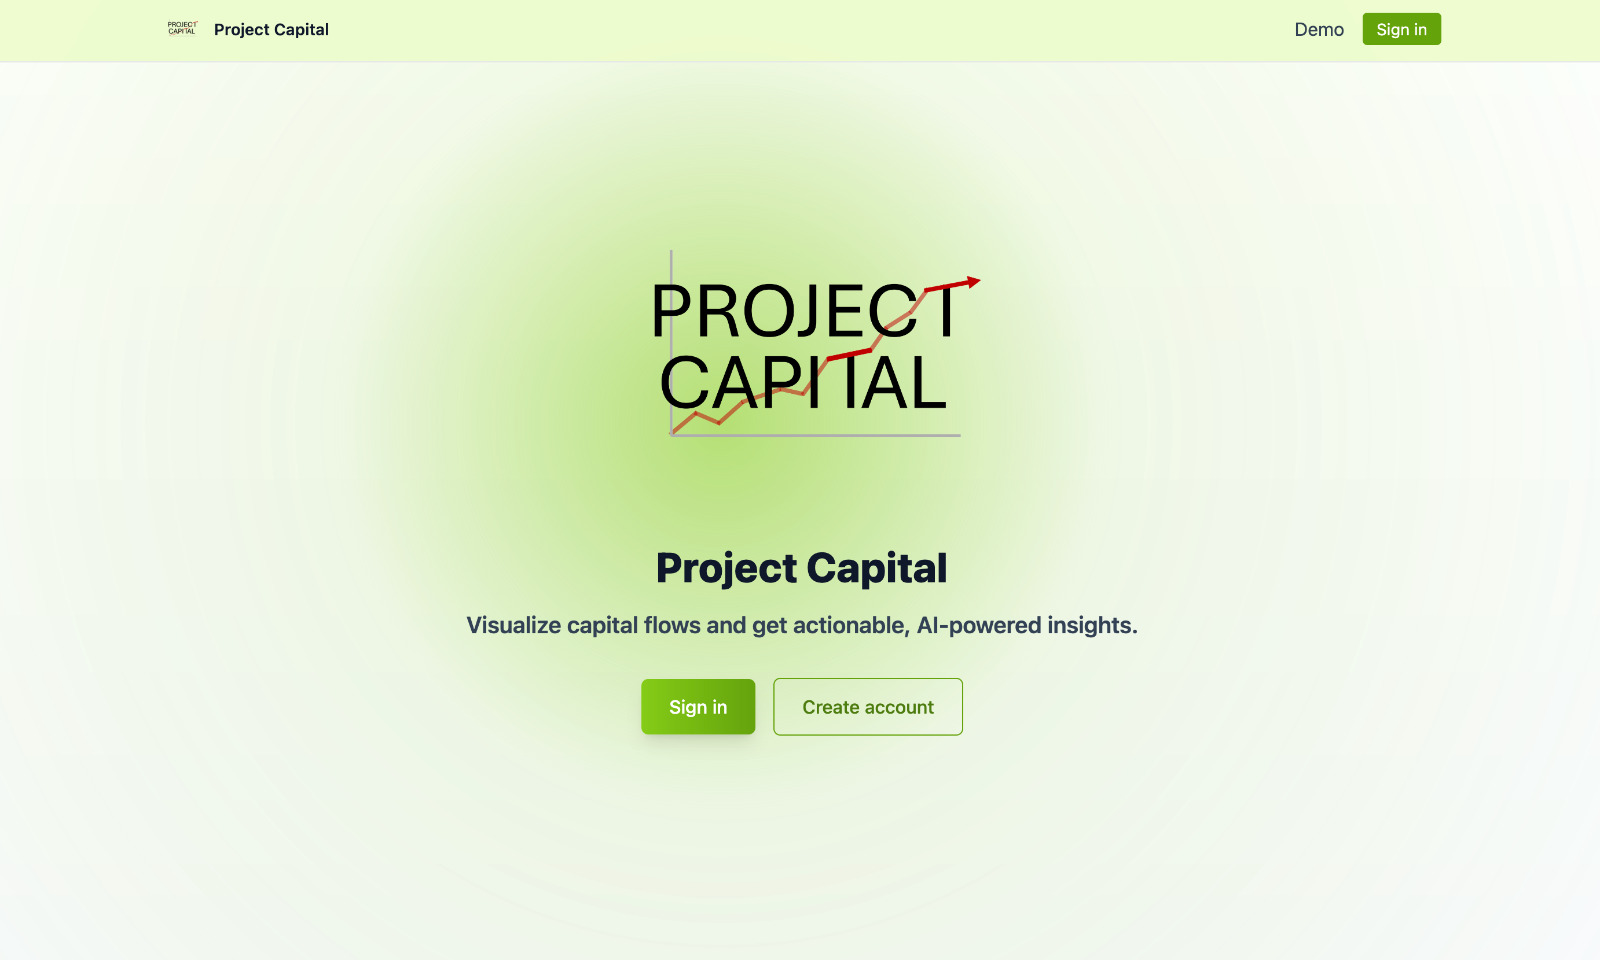
What it does
The application curates balance and expenditure data visualizations to help customers make better spending decisions.
How we built it
Project Capital uses MongoDB and FastAPI for our data management and backend. Much of the data was randomized mock data to protect people's privacy and to generalize our models. For the frontend, we utilized React and D3.js for our visualization. Google Gemini's large language model supports our prompt-aided visualizations.
Challenges we ran into
Our team faced lots of challenges early on while finalizing our idea. We wanted to incorporate Nessie into our project, and after a long time we realized that Nessie would not be helpful for our project. Trying to understand Nessie and make it work for Project Capital ended up being a small setback. One of the major challenges we faced was the process of organizing our data. We faced difficulty in finalizing the appropriate schema for storing the data in the database. Secondly, we faced difficulty with picking the best packages and frameworks. For example, we chose to use D3.js due to their advanced visualization tools and Fast API is very compatible with Python.
Accomplishments that we're proud of
We successfully integrated a reliable database with FastAPI and are able to generate visualizations of various parameters including categories and time range. Seamlessly integrating all these components to produce a working product is the biggest accomplishment of this project.
What we learned
Everyone on the team gained experience with full-stack development, especially with parts of the stack that we were unfamiliar with. Additionally, we learned more about fintech, and how banks use technology in their operations. We also expanded on prior knowledge about data visualization and natural language processing while building some of the key features of our product.
What's next for Project Capital
Project capital as of now supports visualizations of expenditures based on categories. However, in the future, we can expect more features such as time-series regression of high-expenditure or low-expenditure scenarios to determine overall cash flows. We can also expect to integrate salaries, loans, scheduled payments, credit risk index, fraudulent transaction detection, and other interesting features.


Log in or sign up for Devpost to join the conversation.