-
-
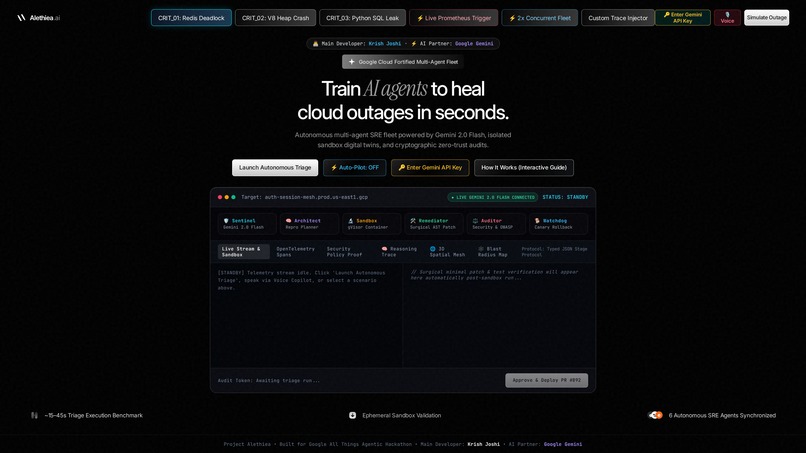
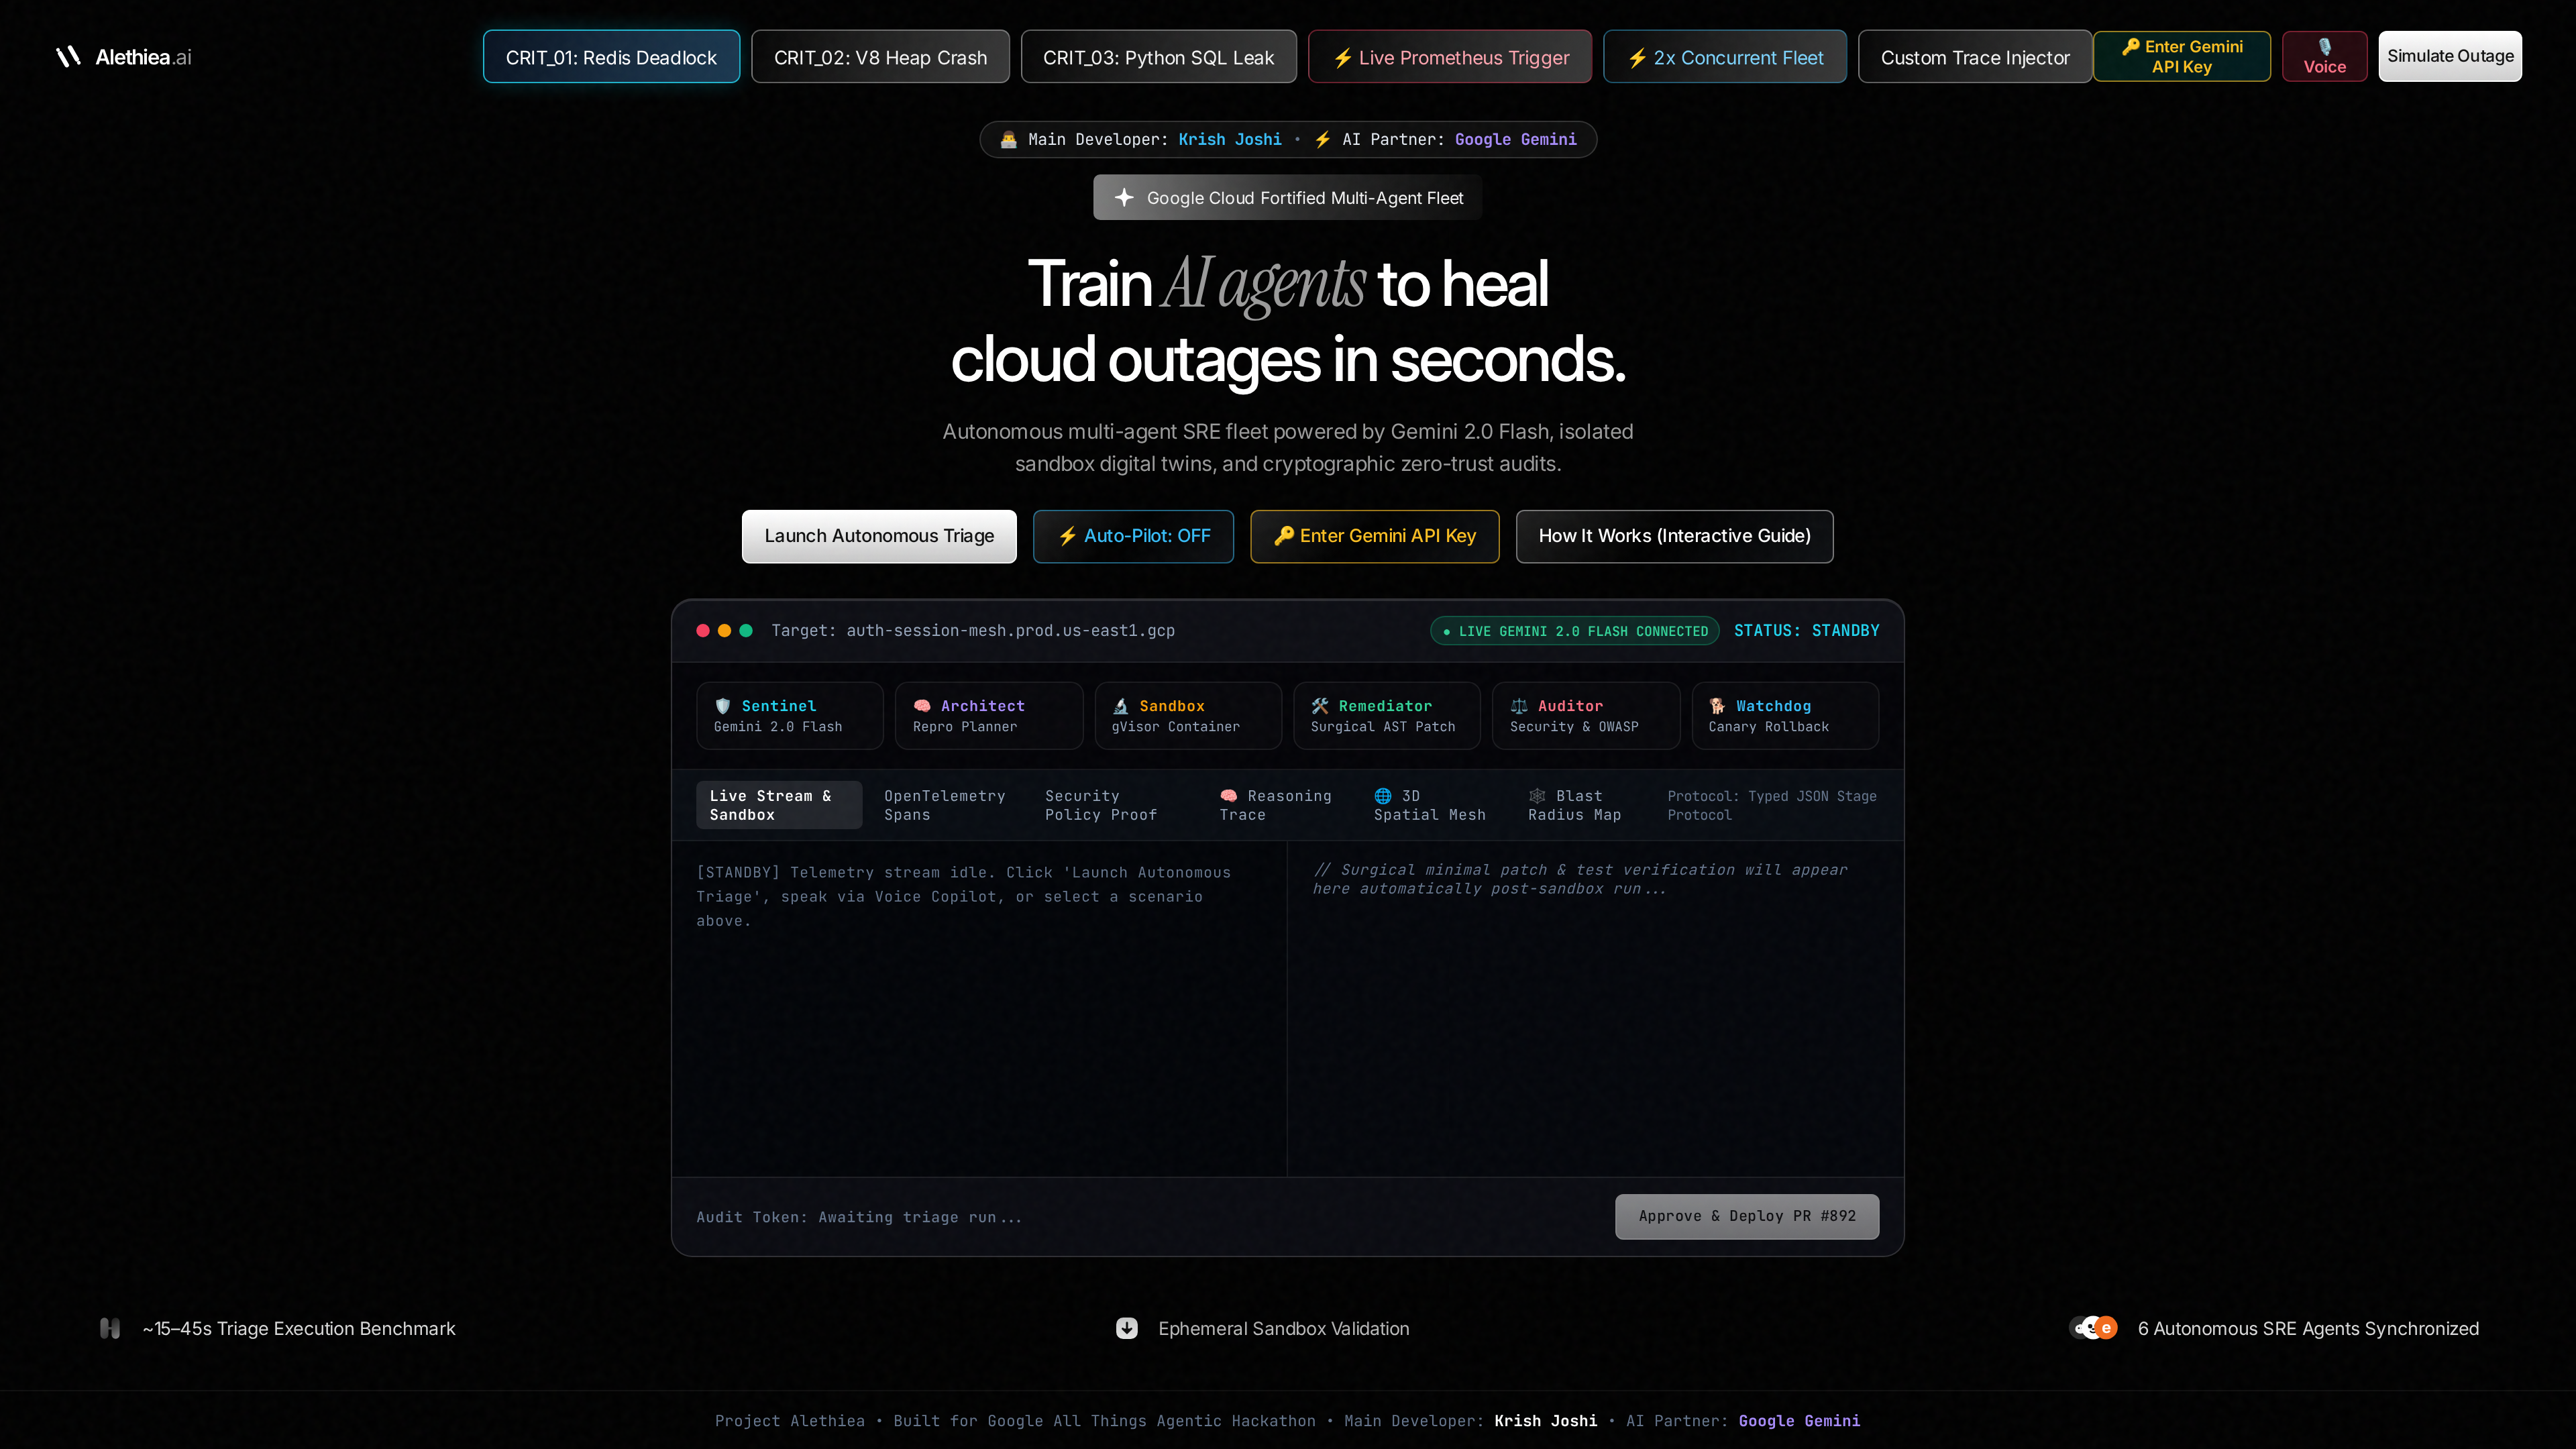
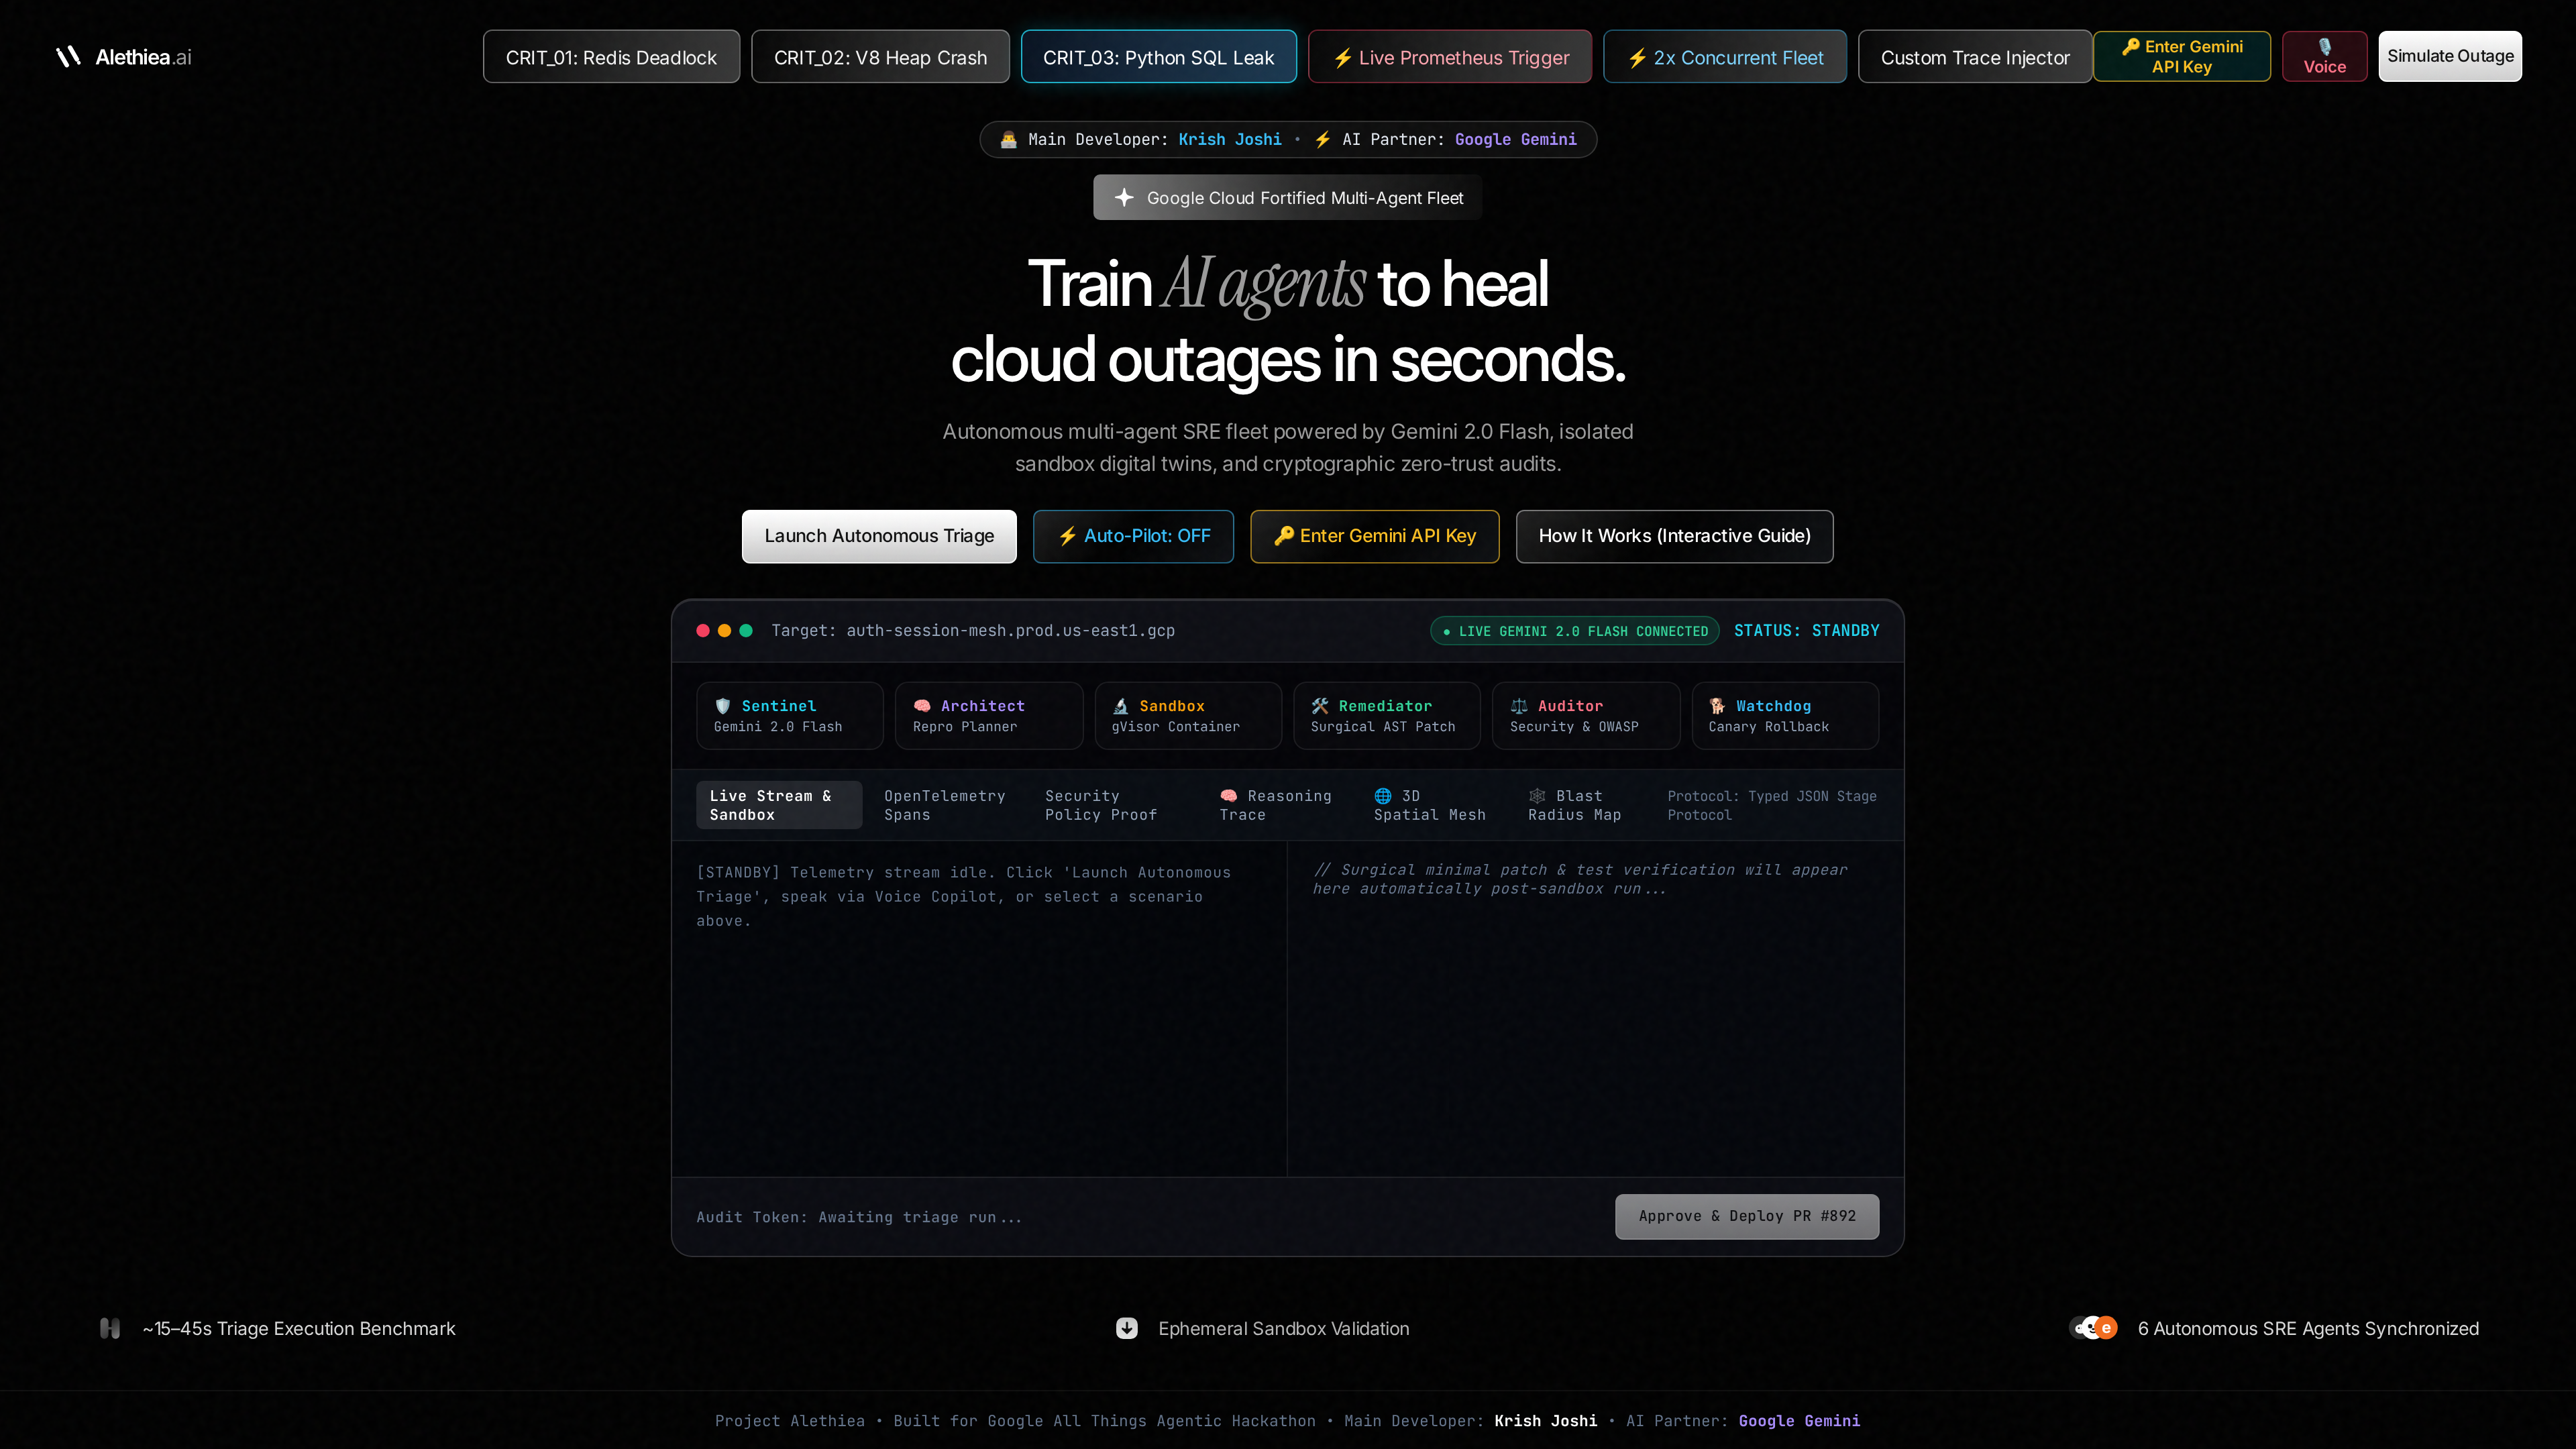
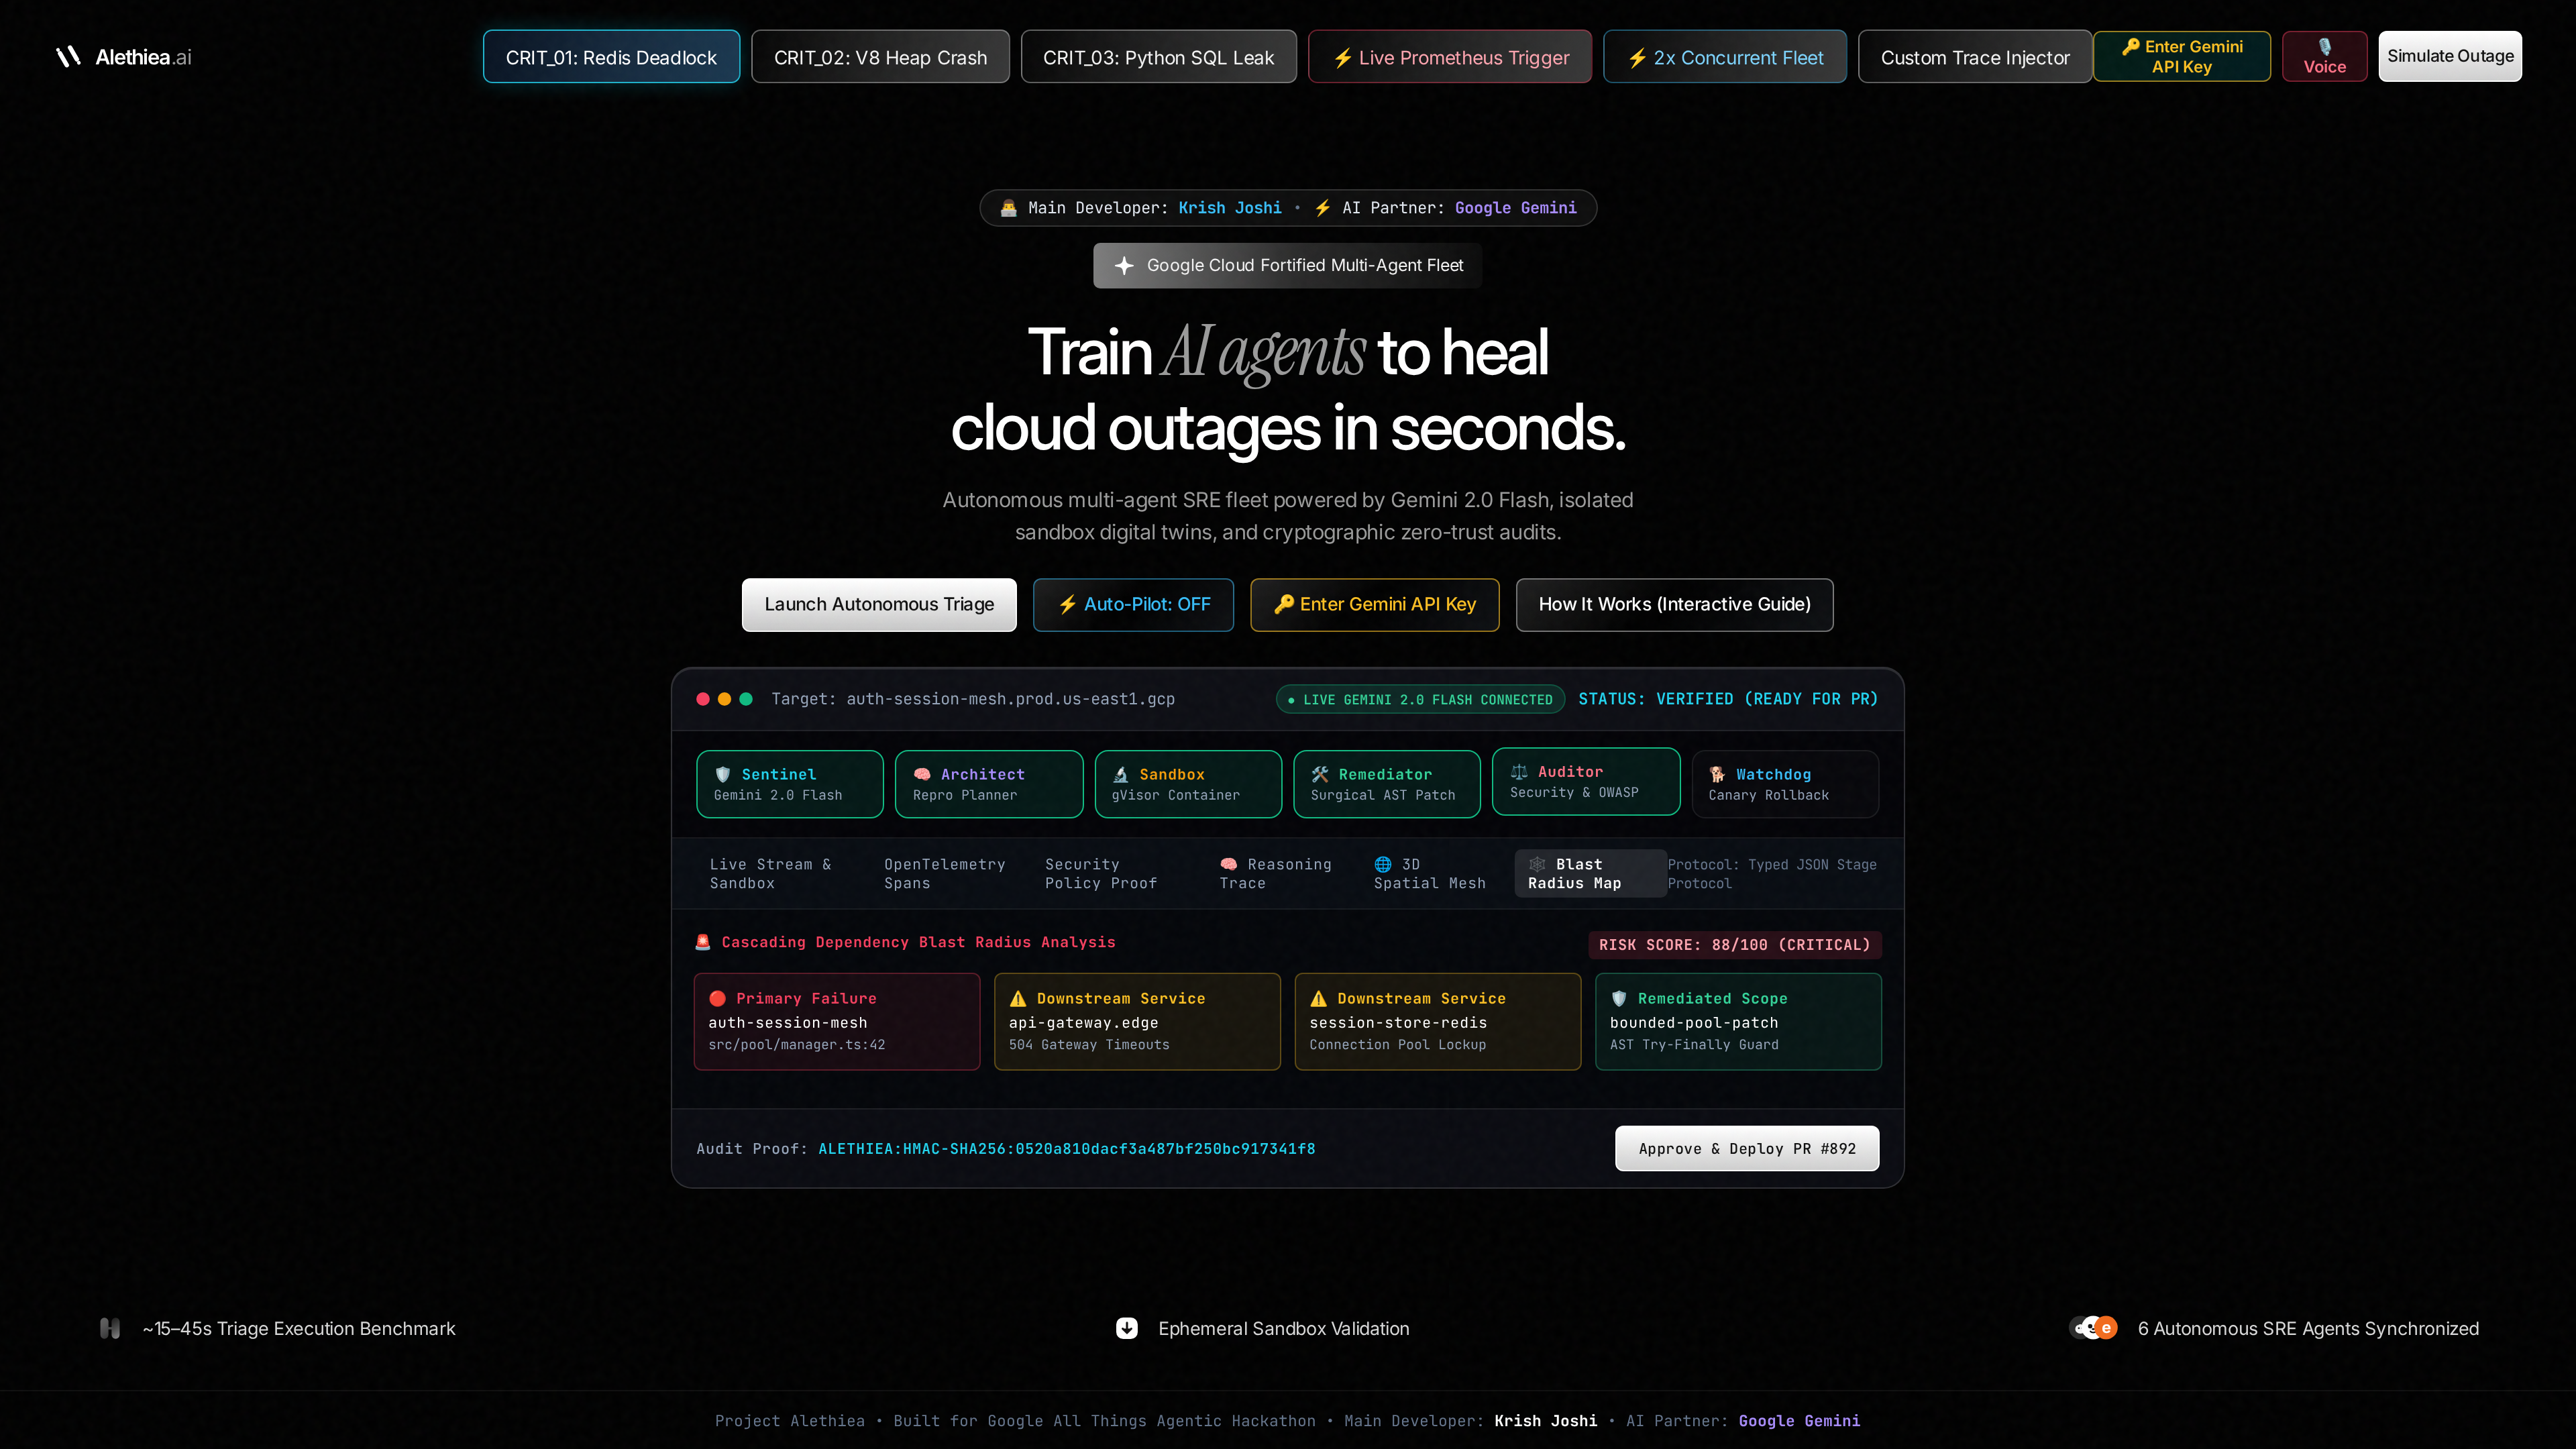
Main Cybernetic SRE Command Center with all 6 agent cards
-
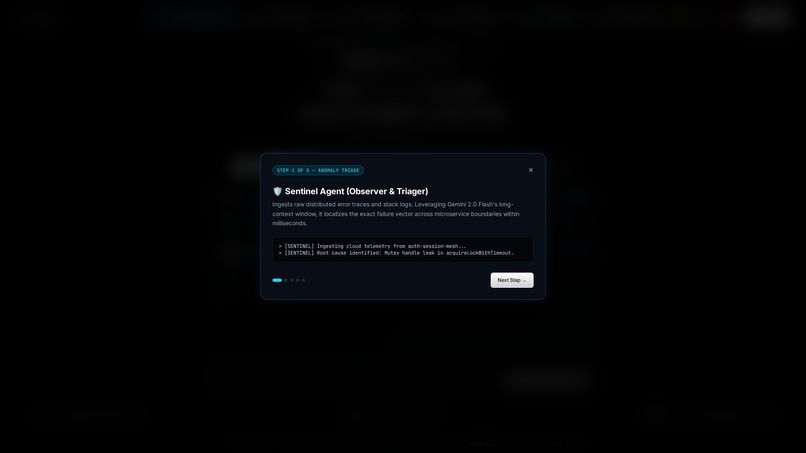
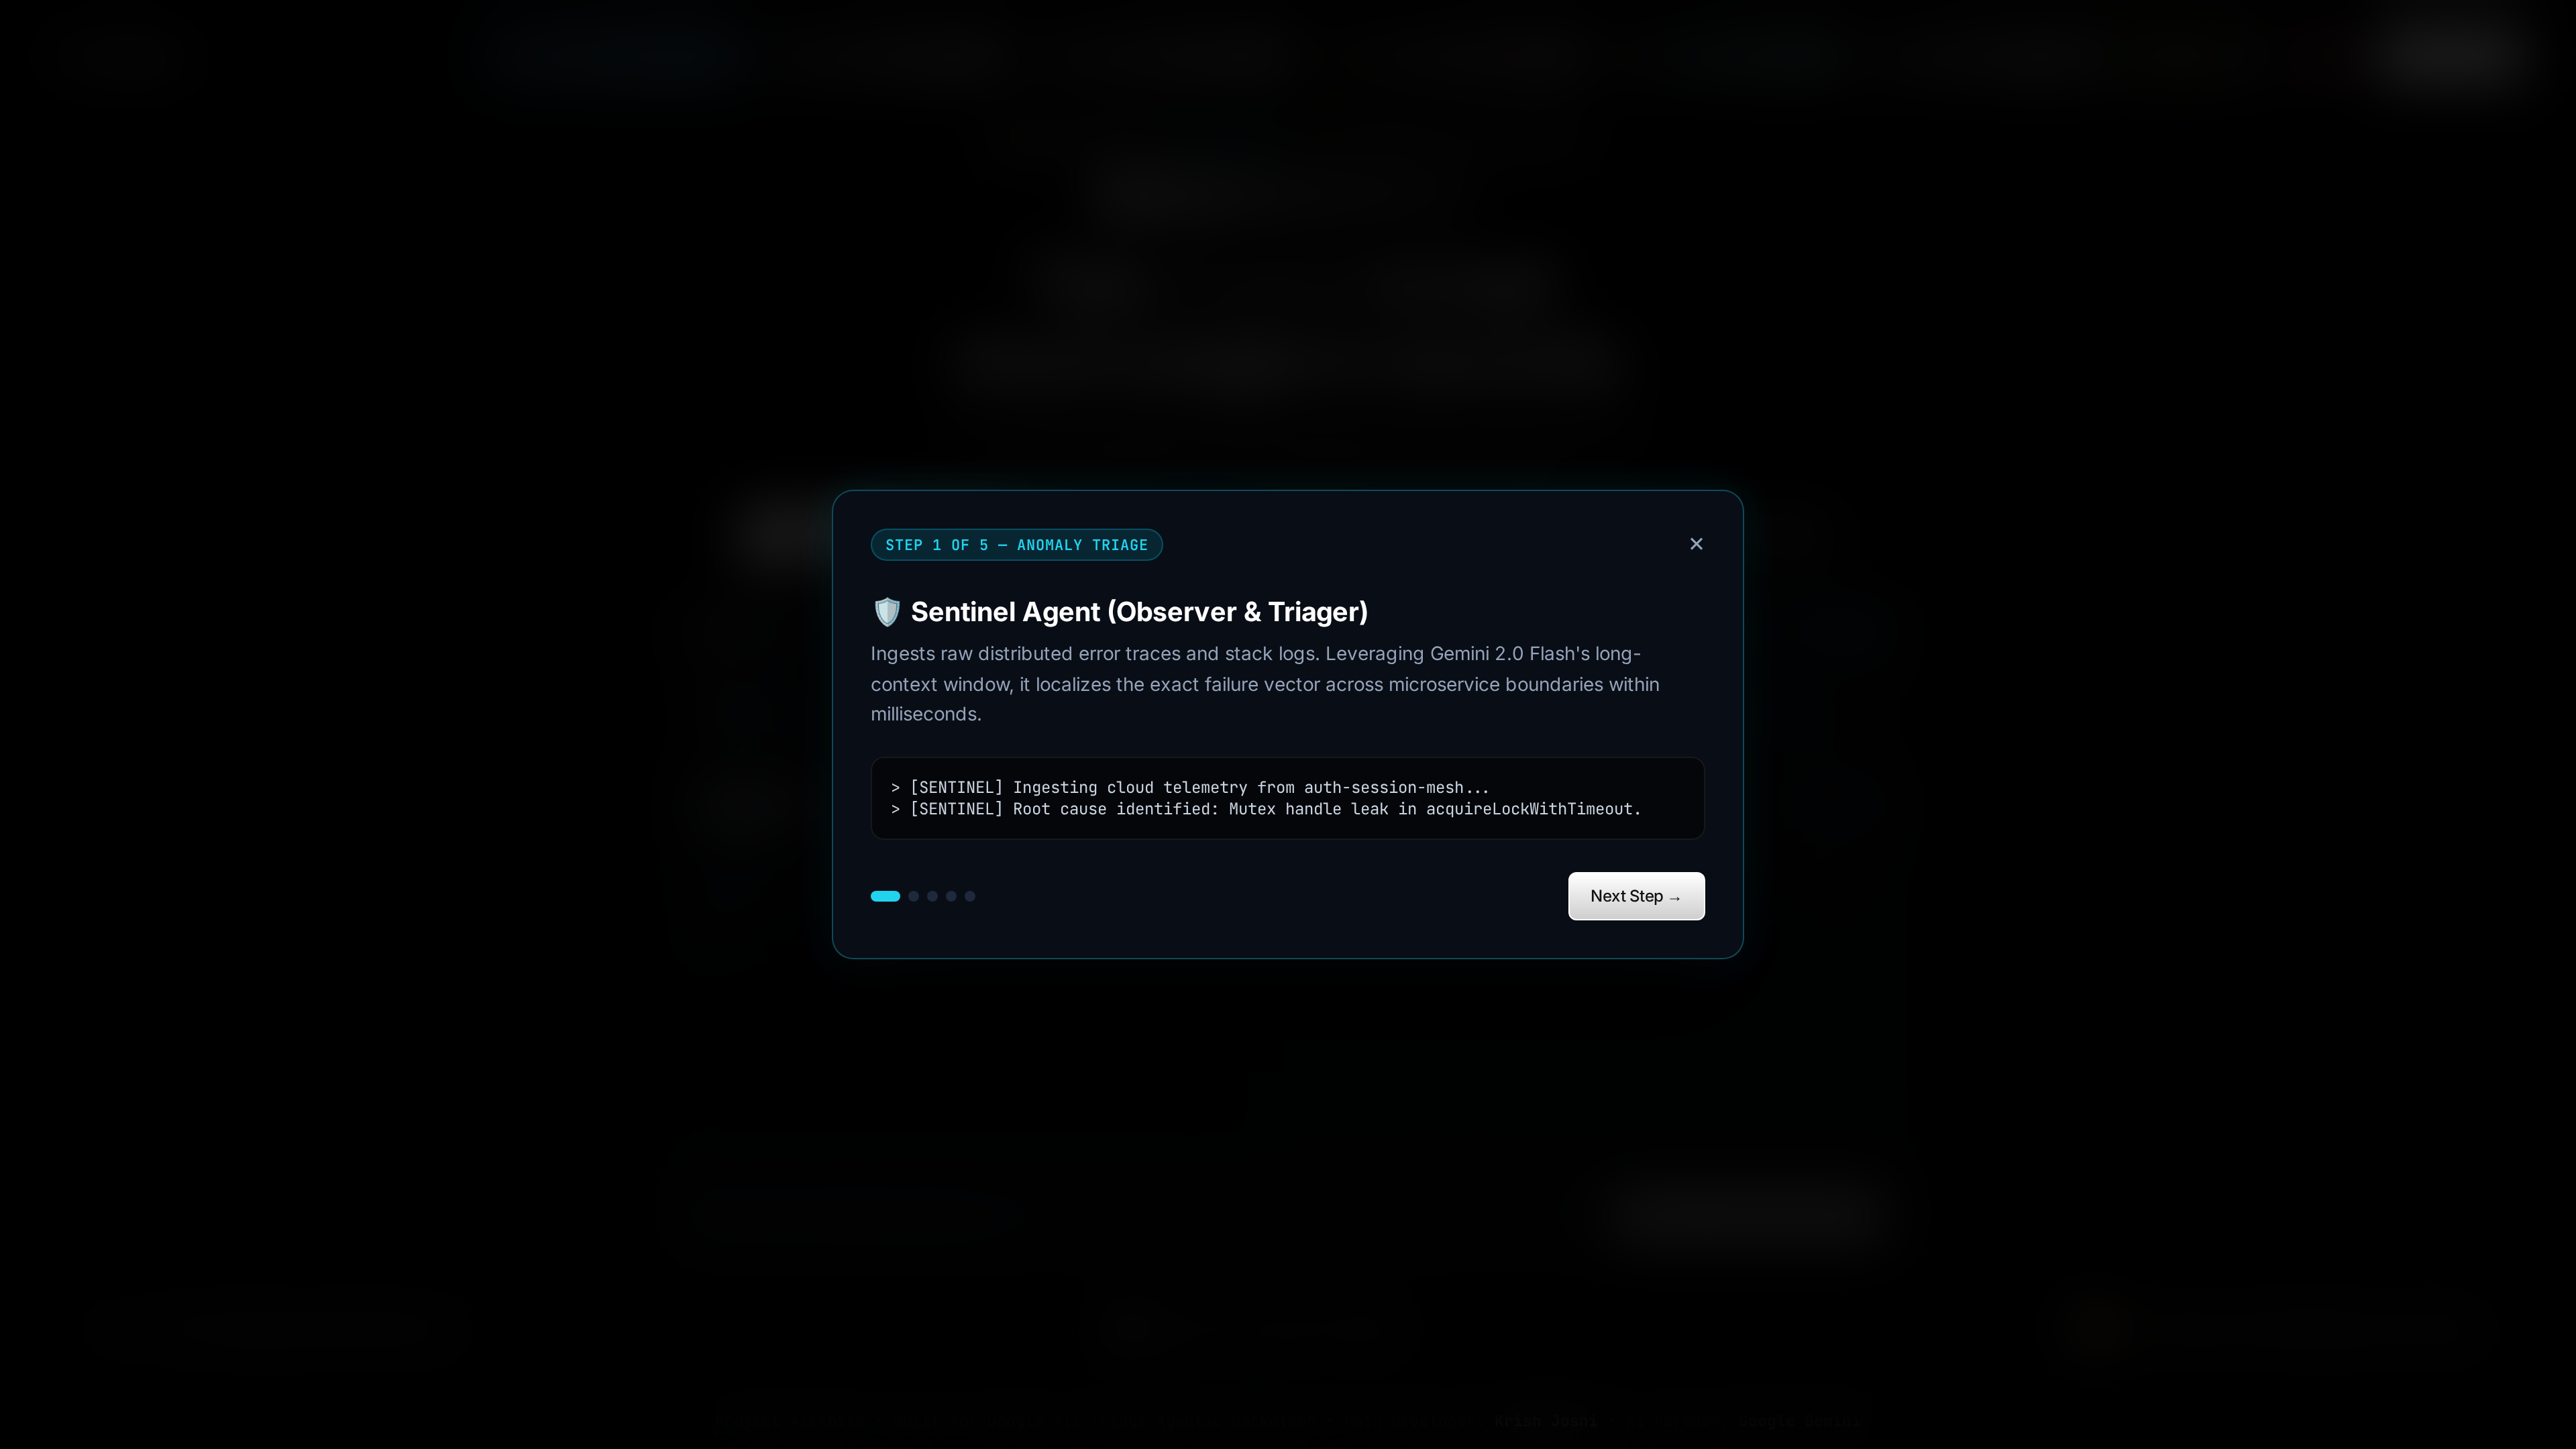
Step-by-Step Interactive Guide modal
-
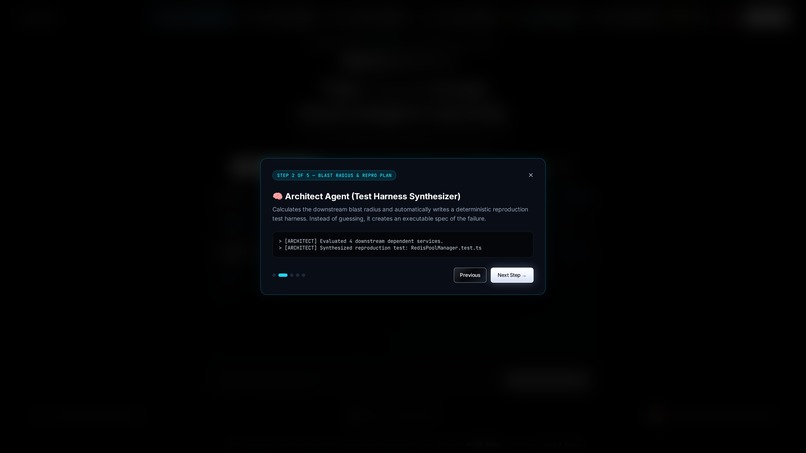
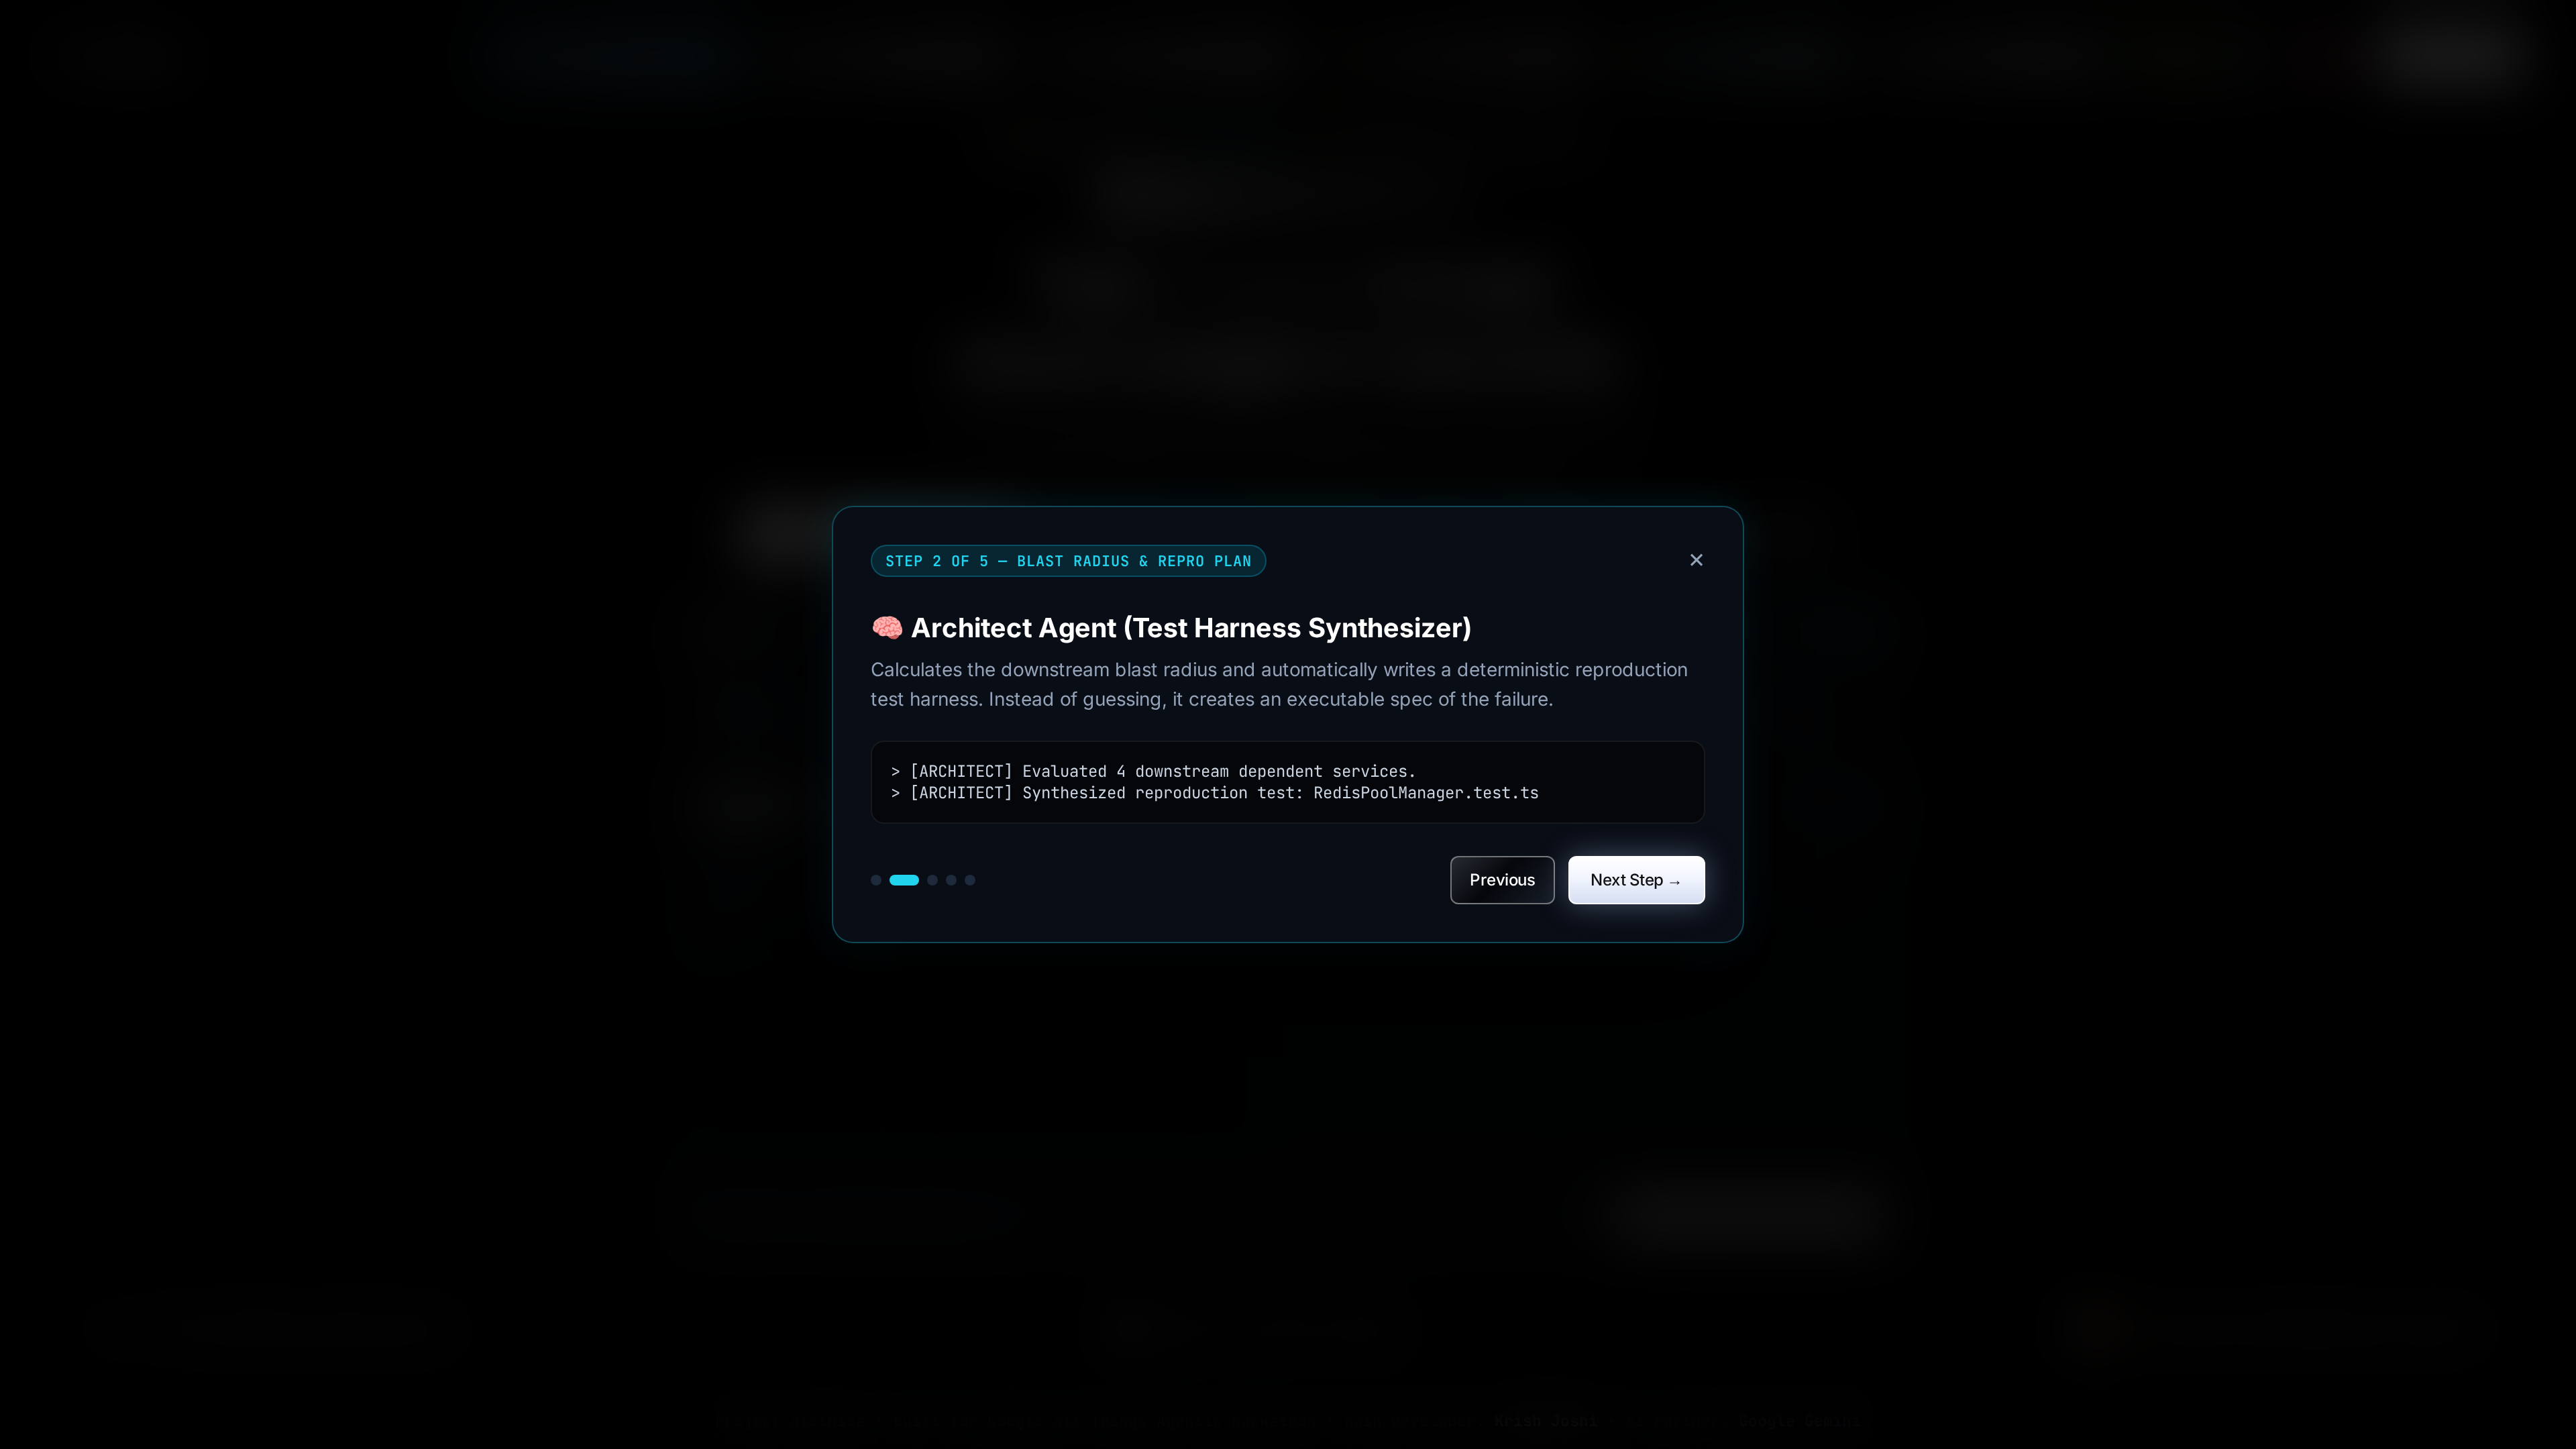
Architect Agent blast radius walkthrough step
-
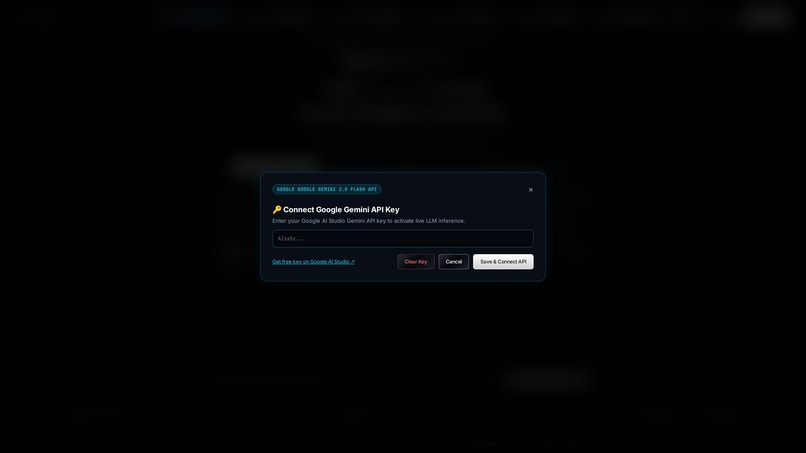
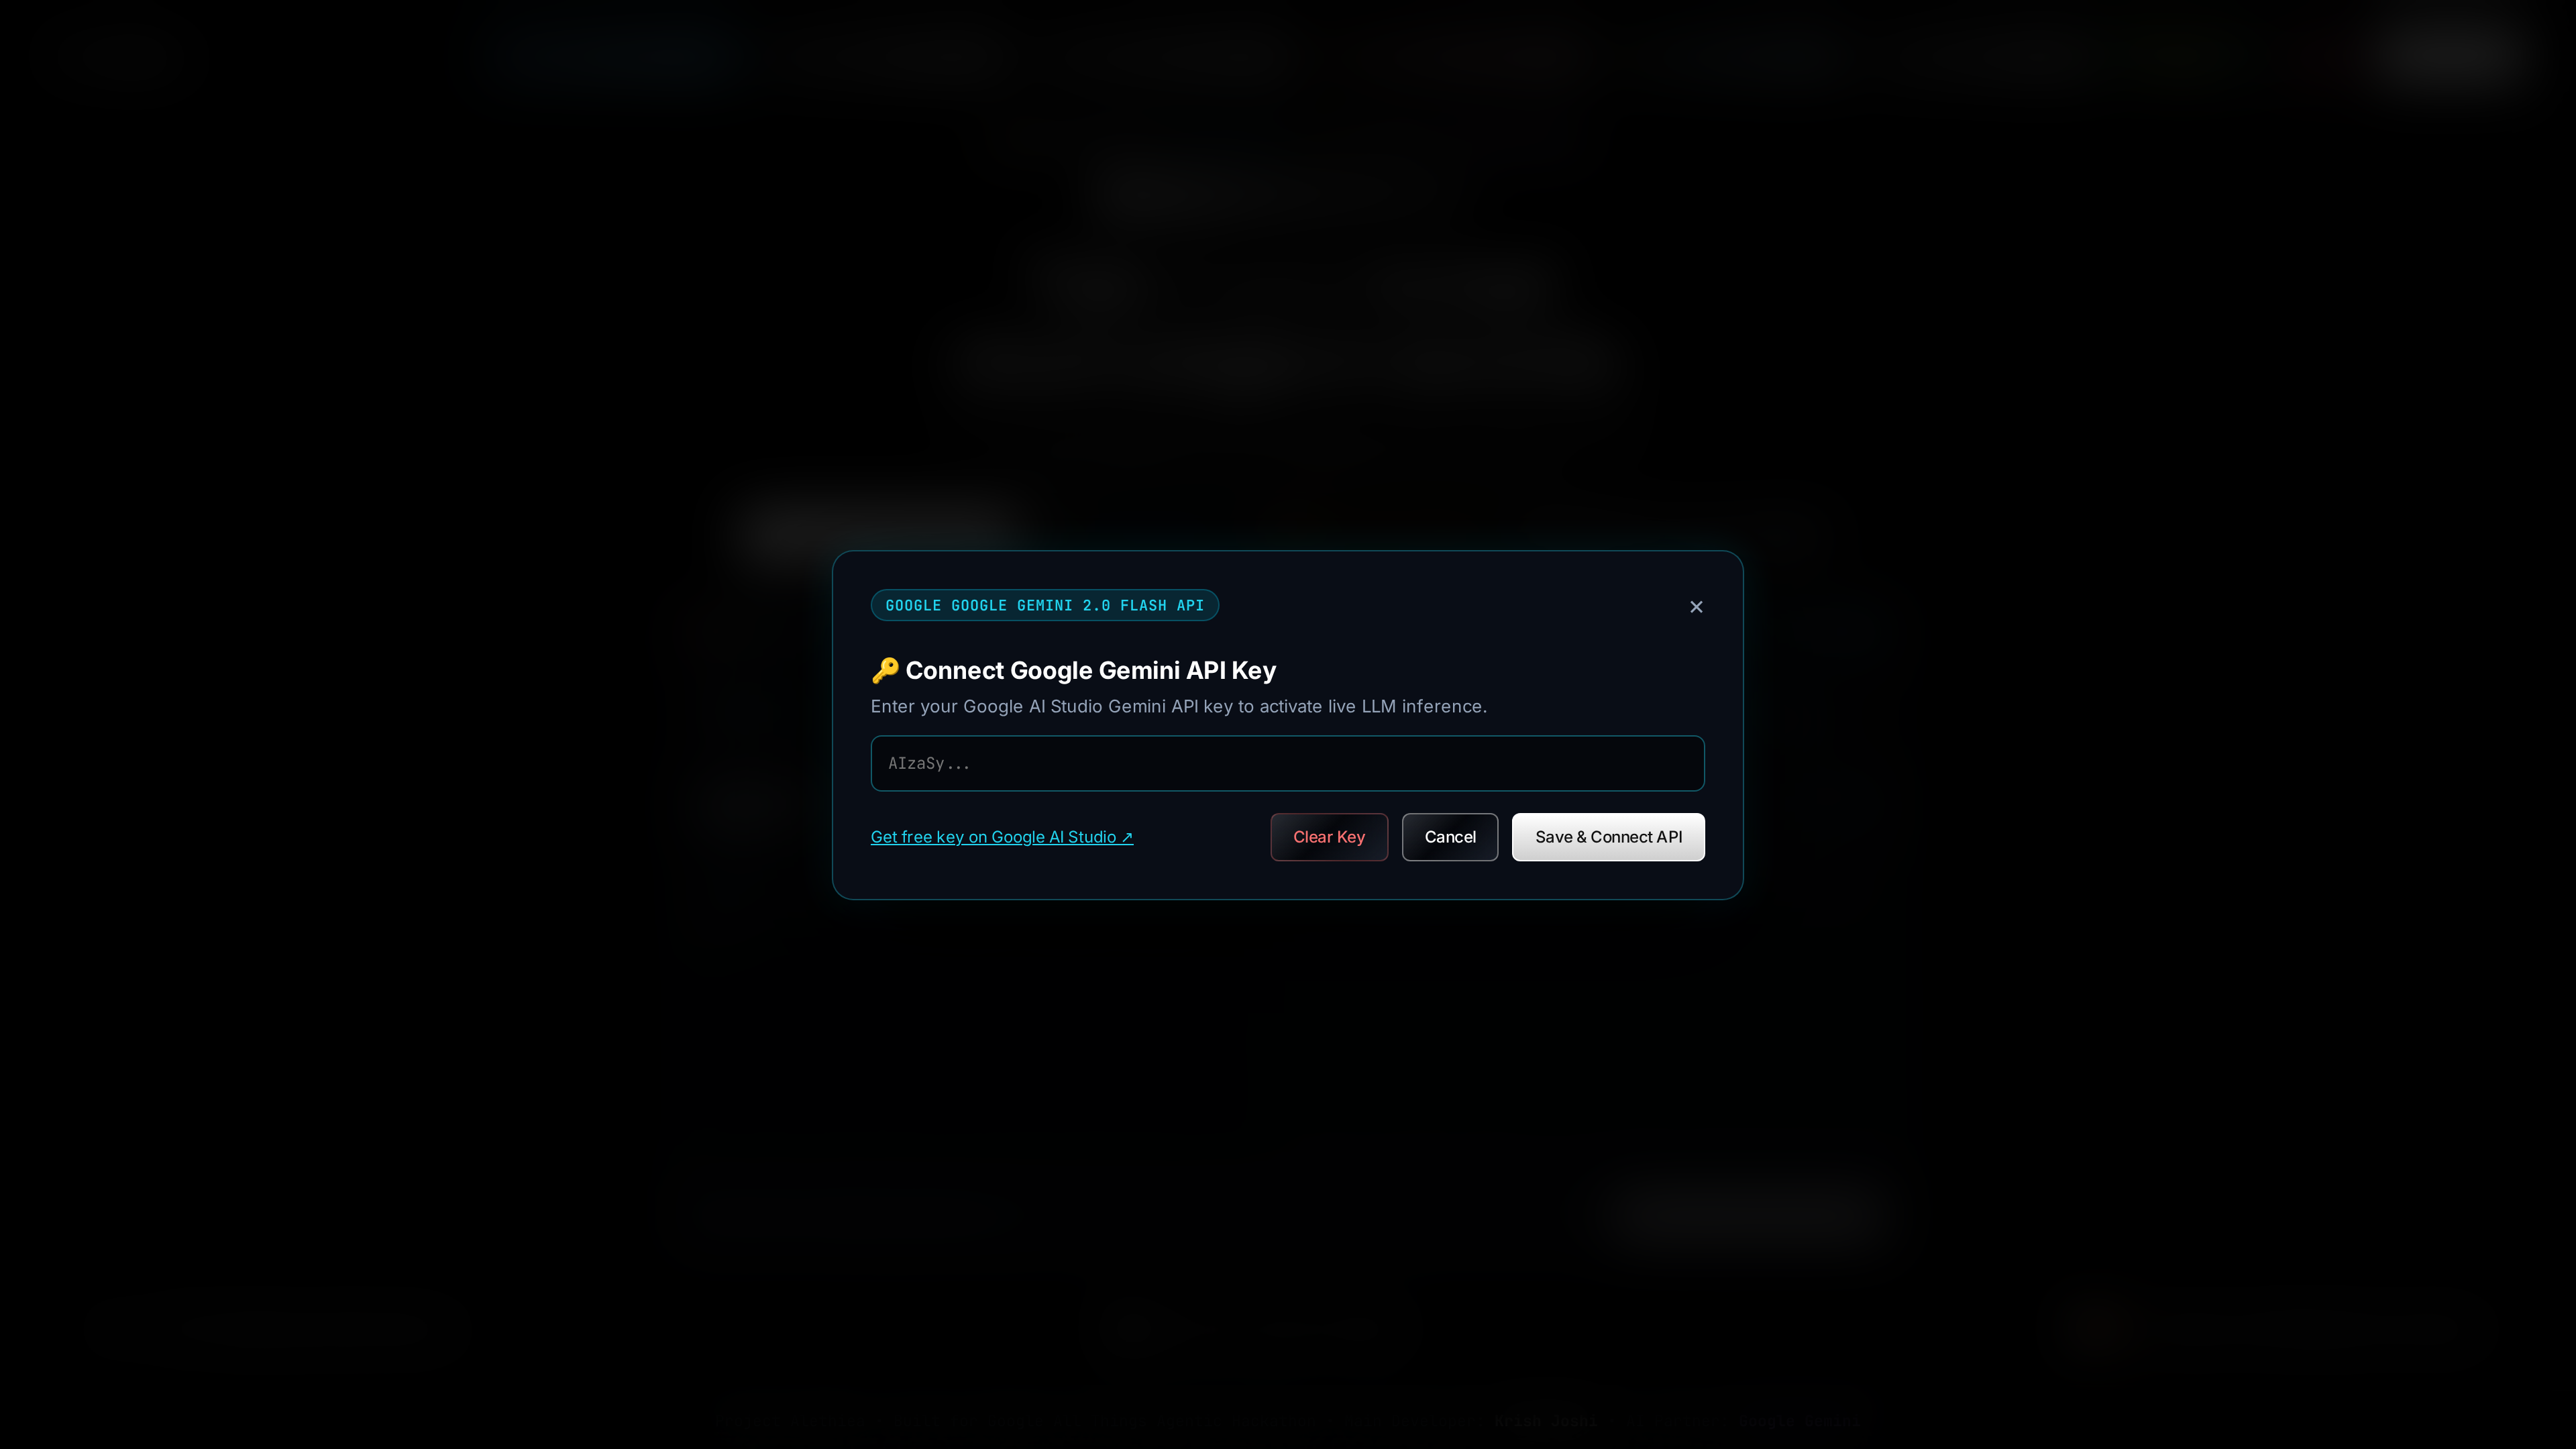
Google Gemini 2.0 Flash API key connector modal
-
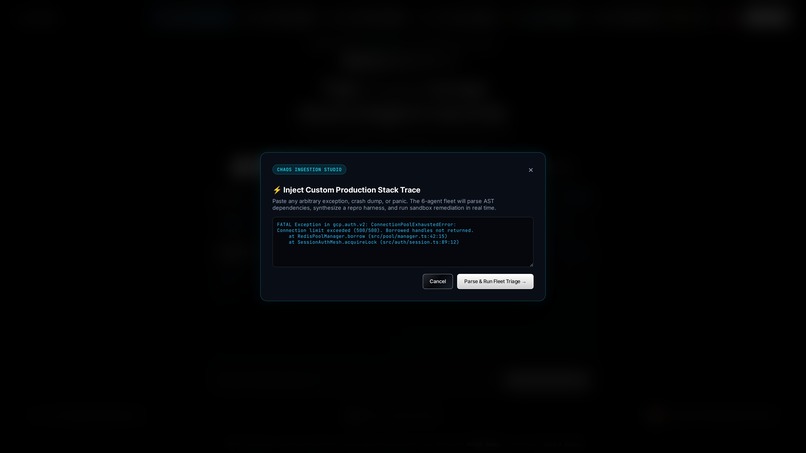
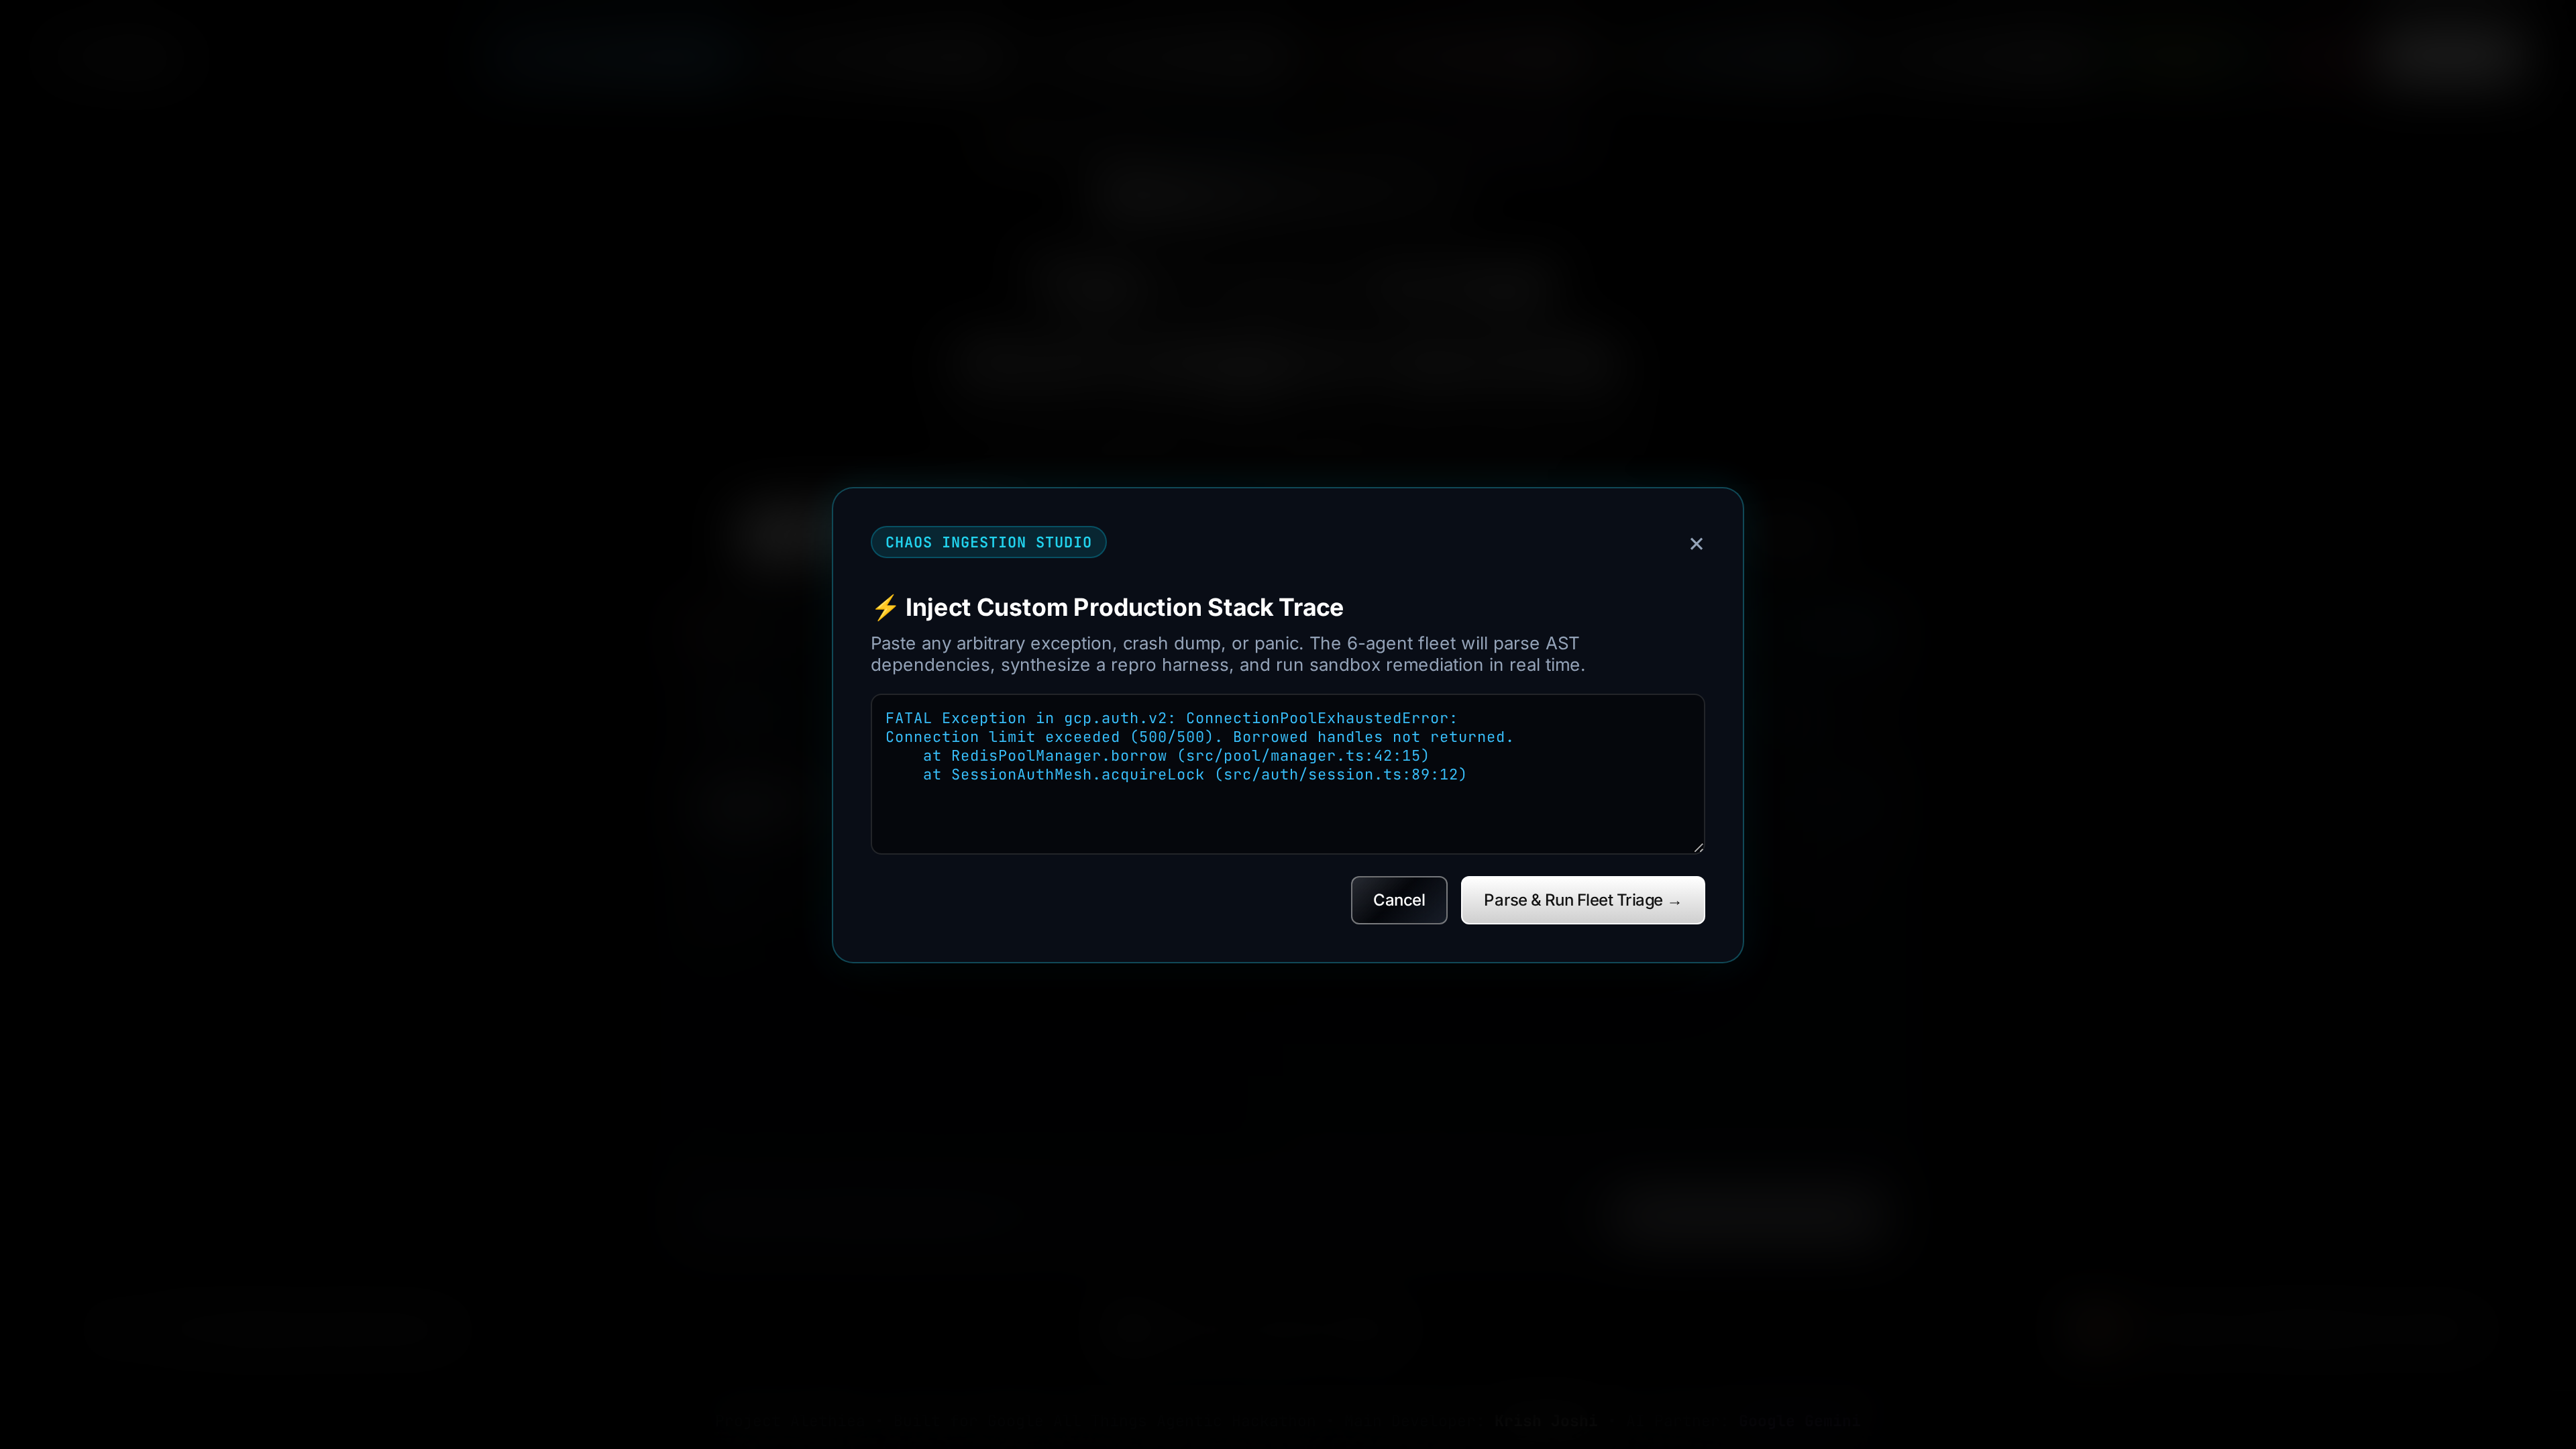
Custom Incident Stack Trace Injector modal
-
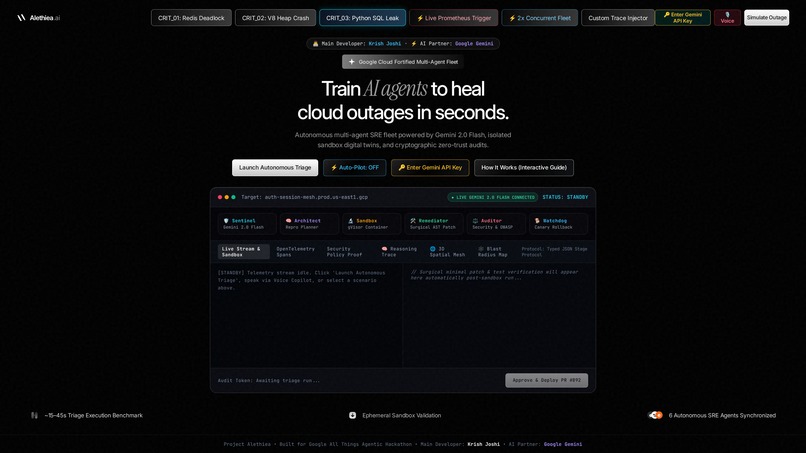
Python SQLAlchemy incident scenario view
-
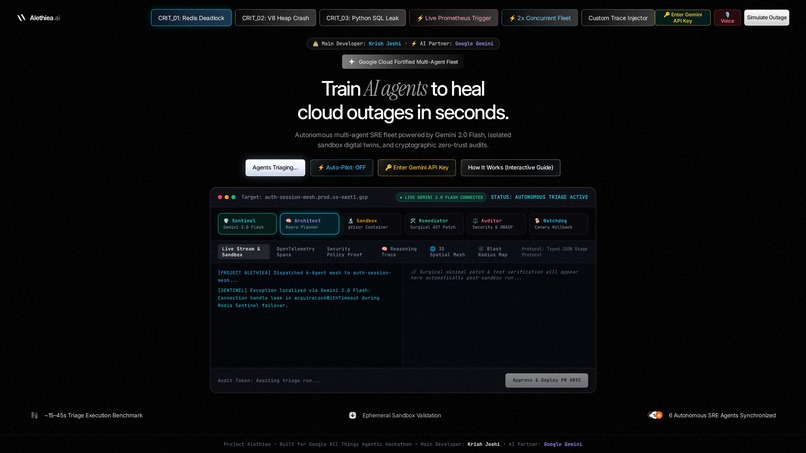
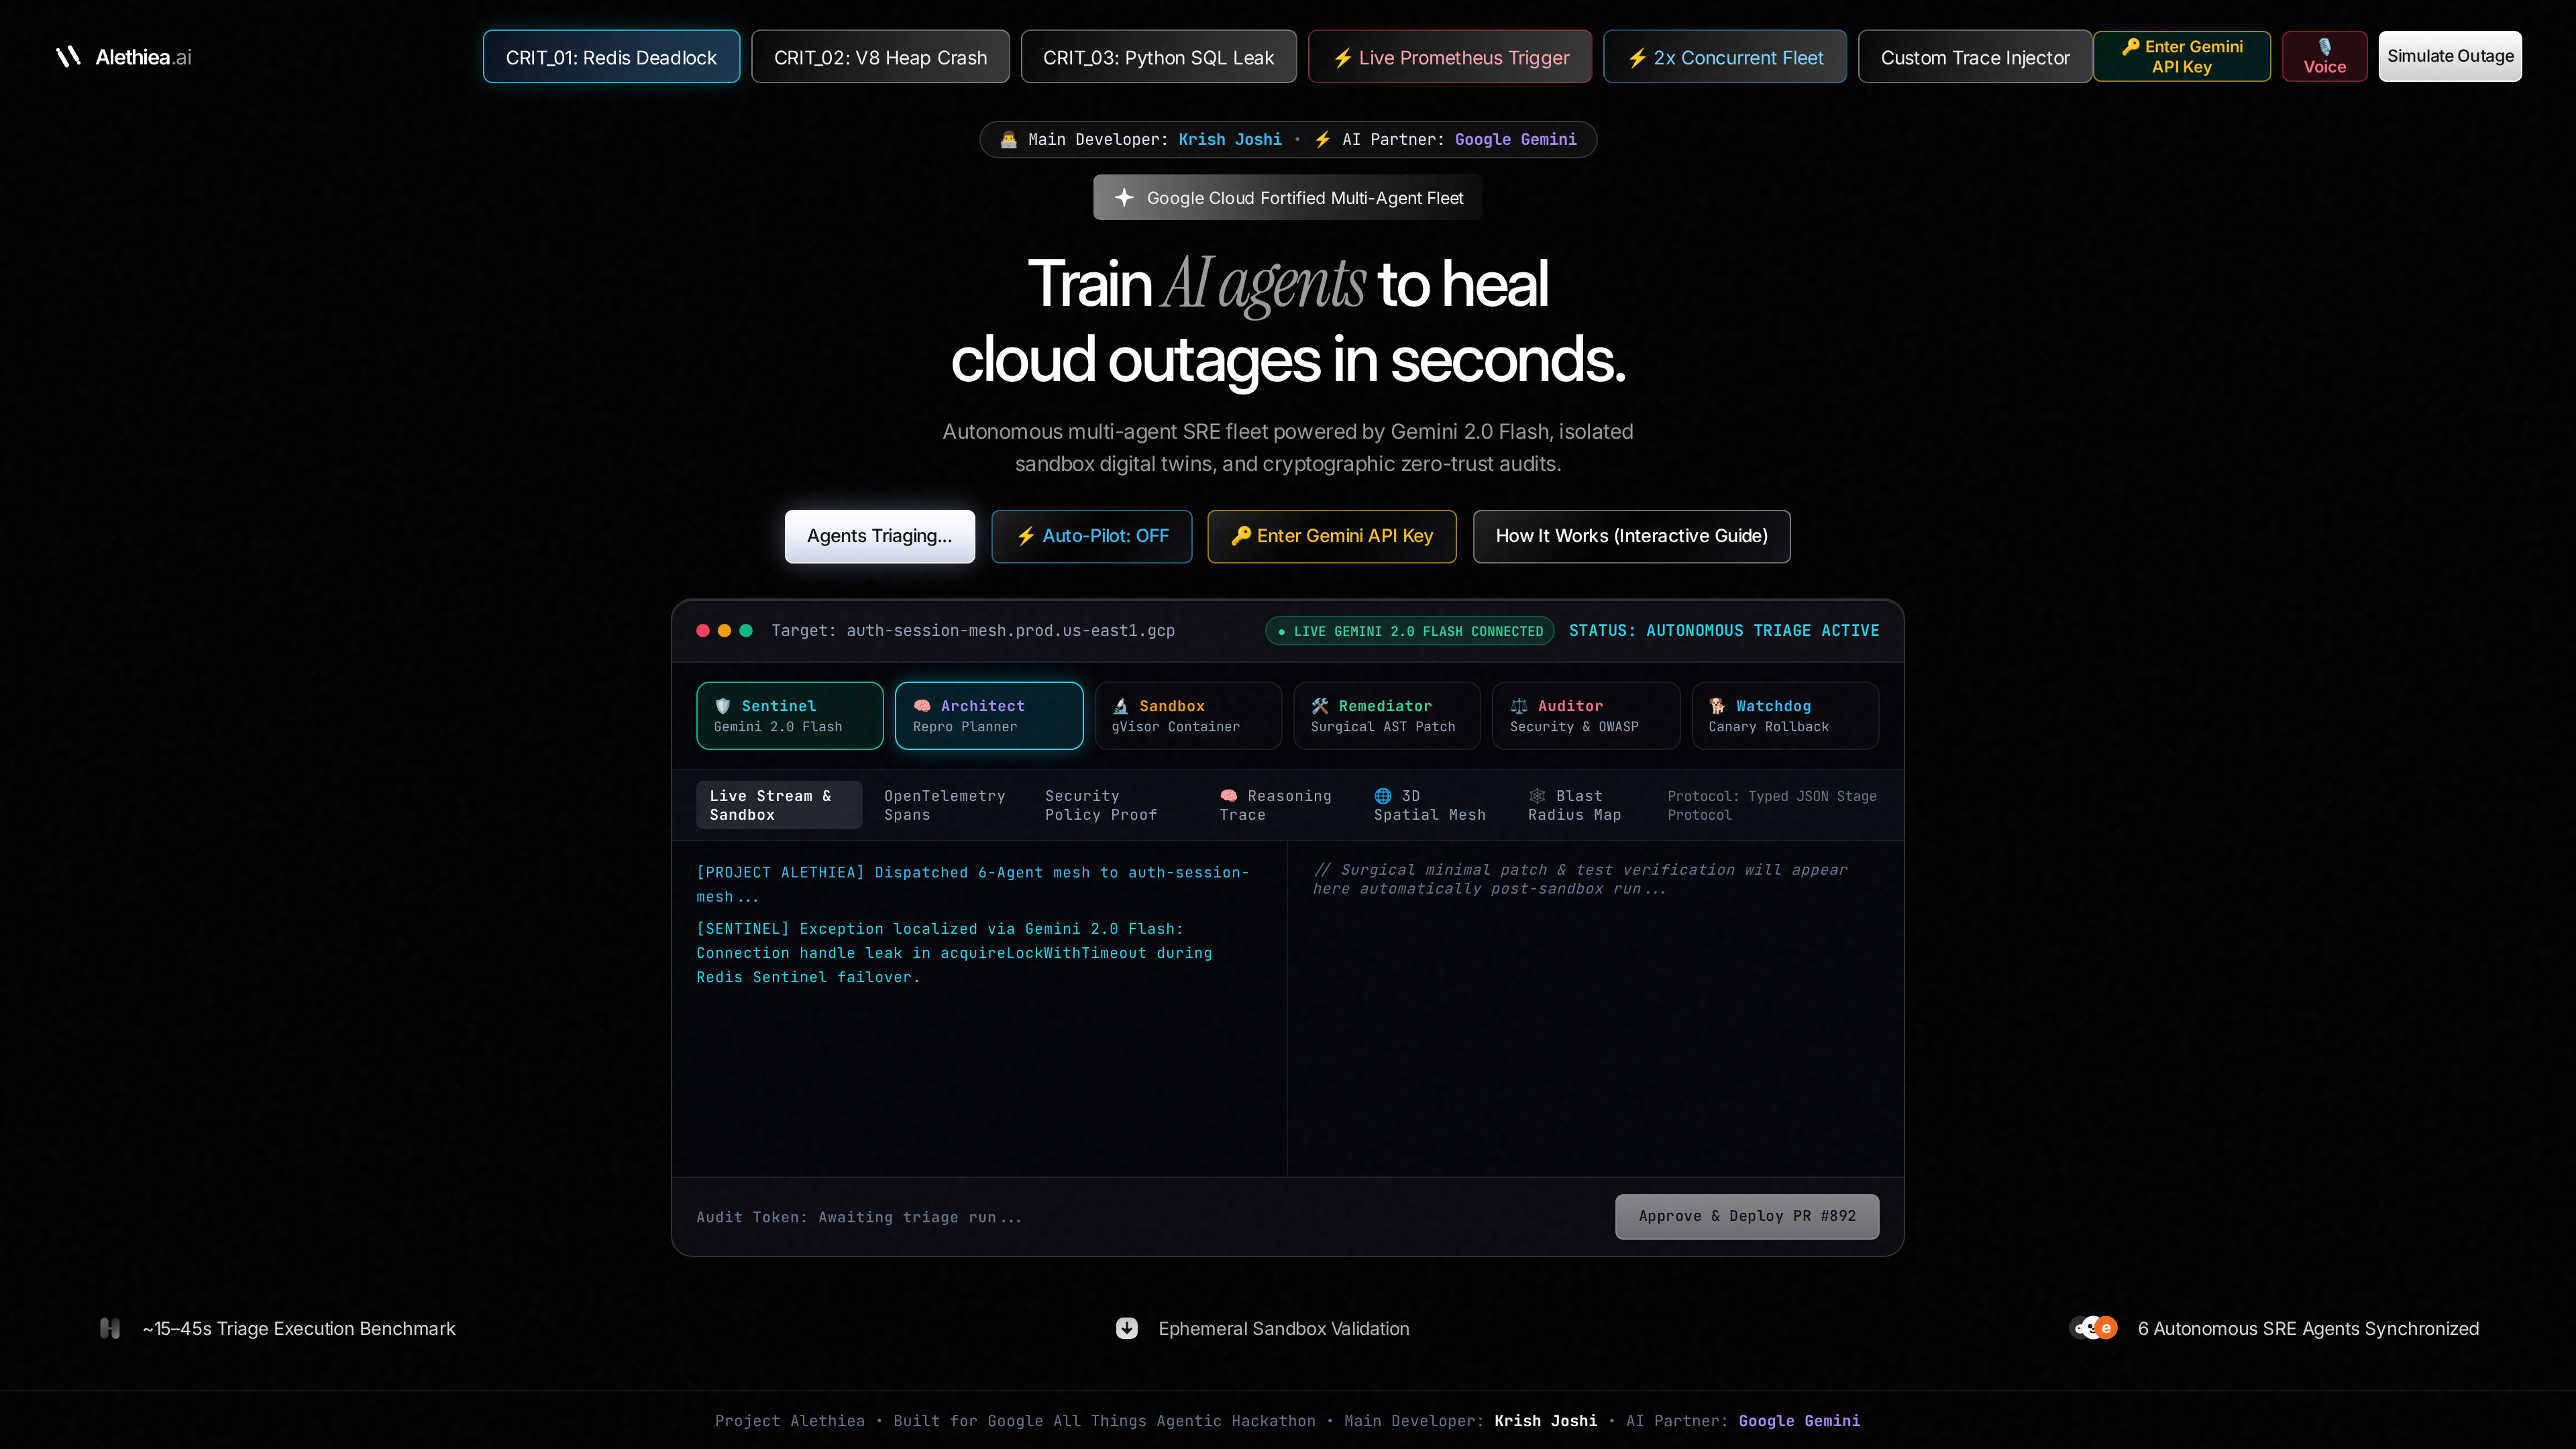
Sentinel active root-cause isolation in progress
-
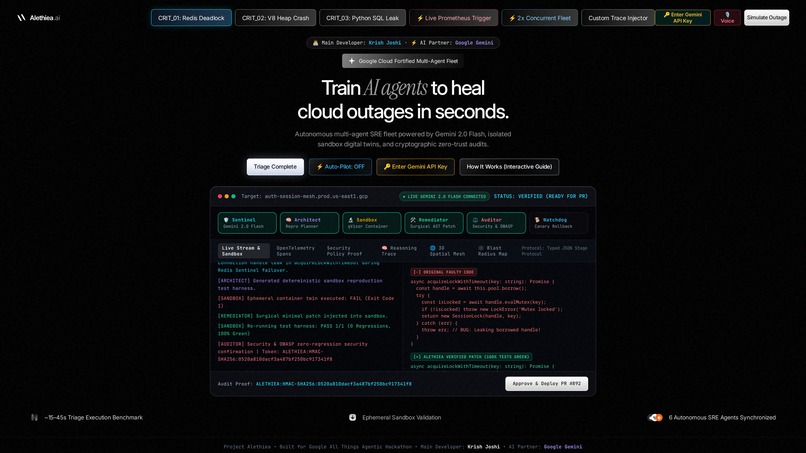
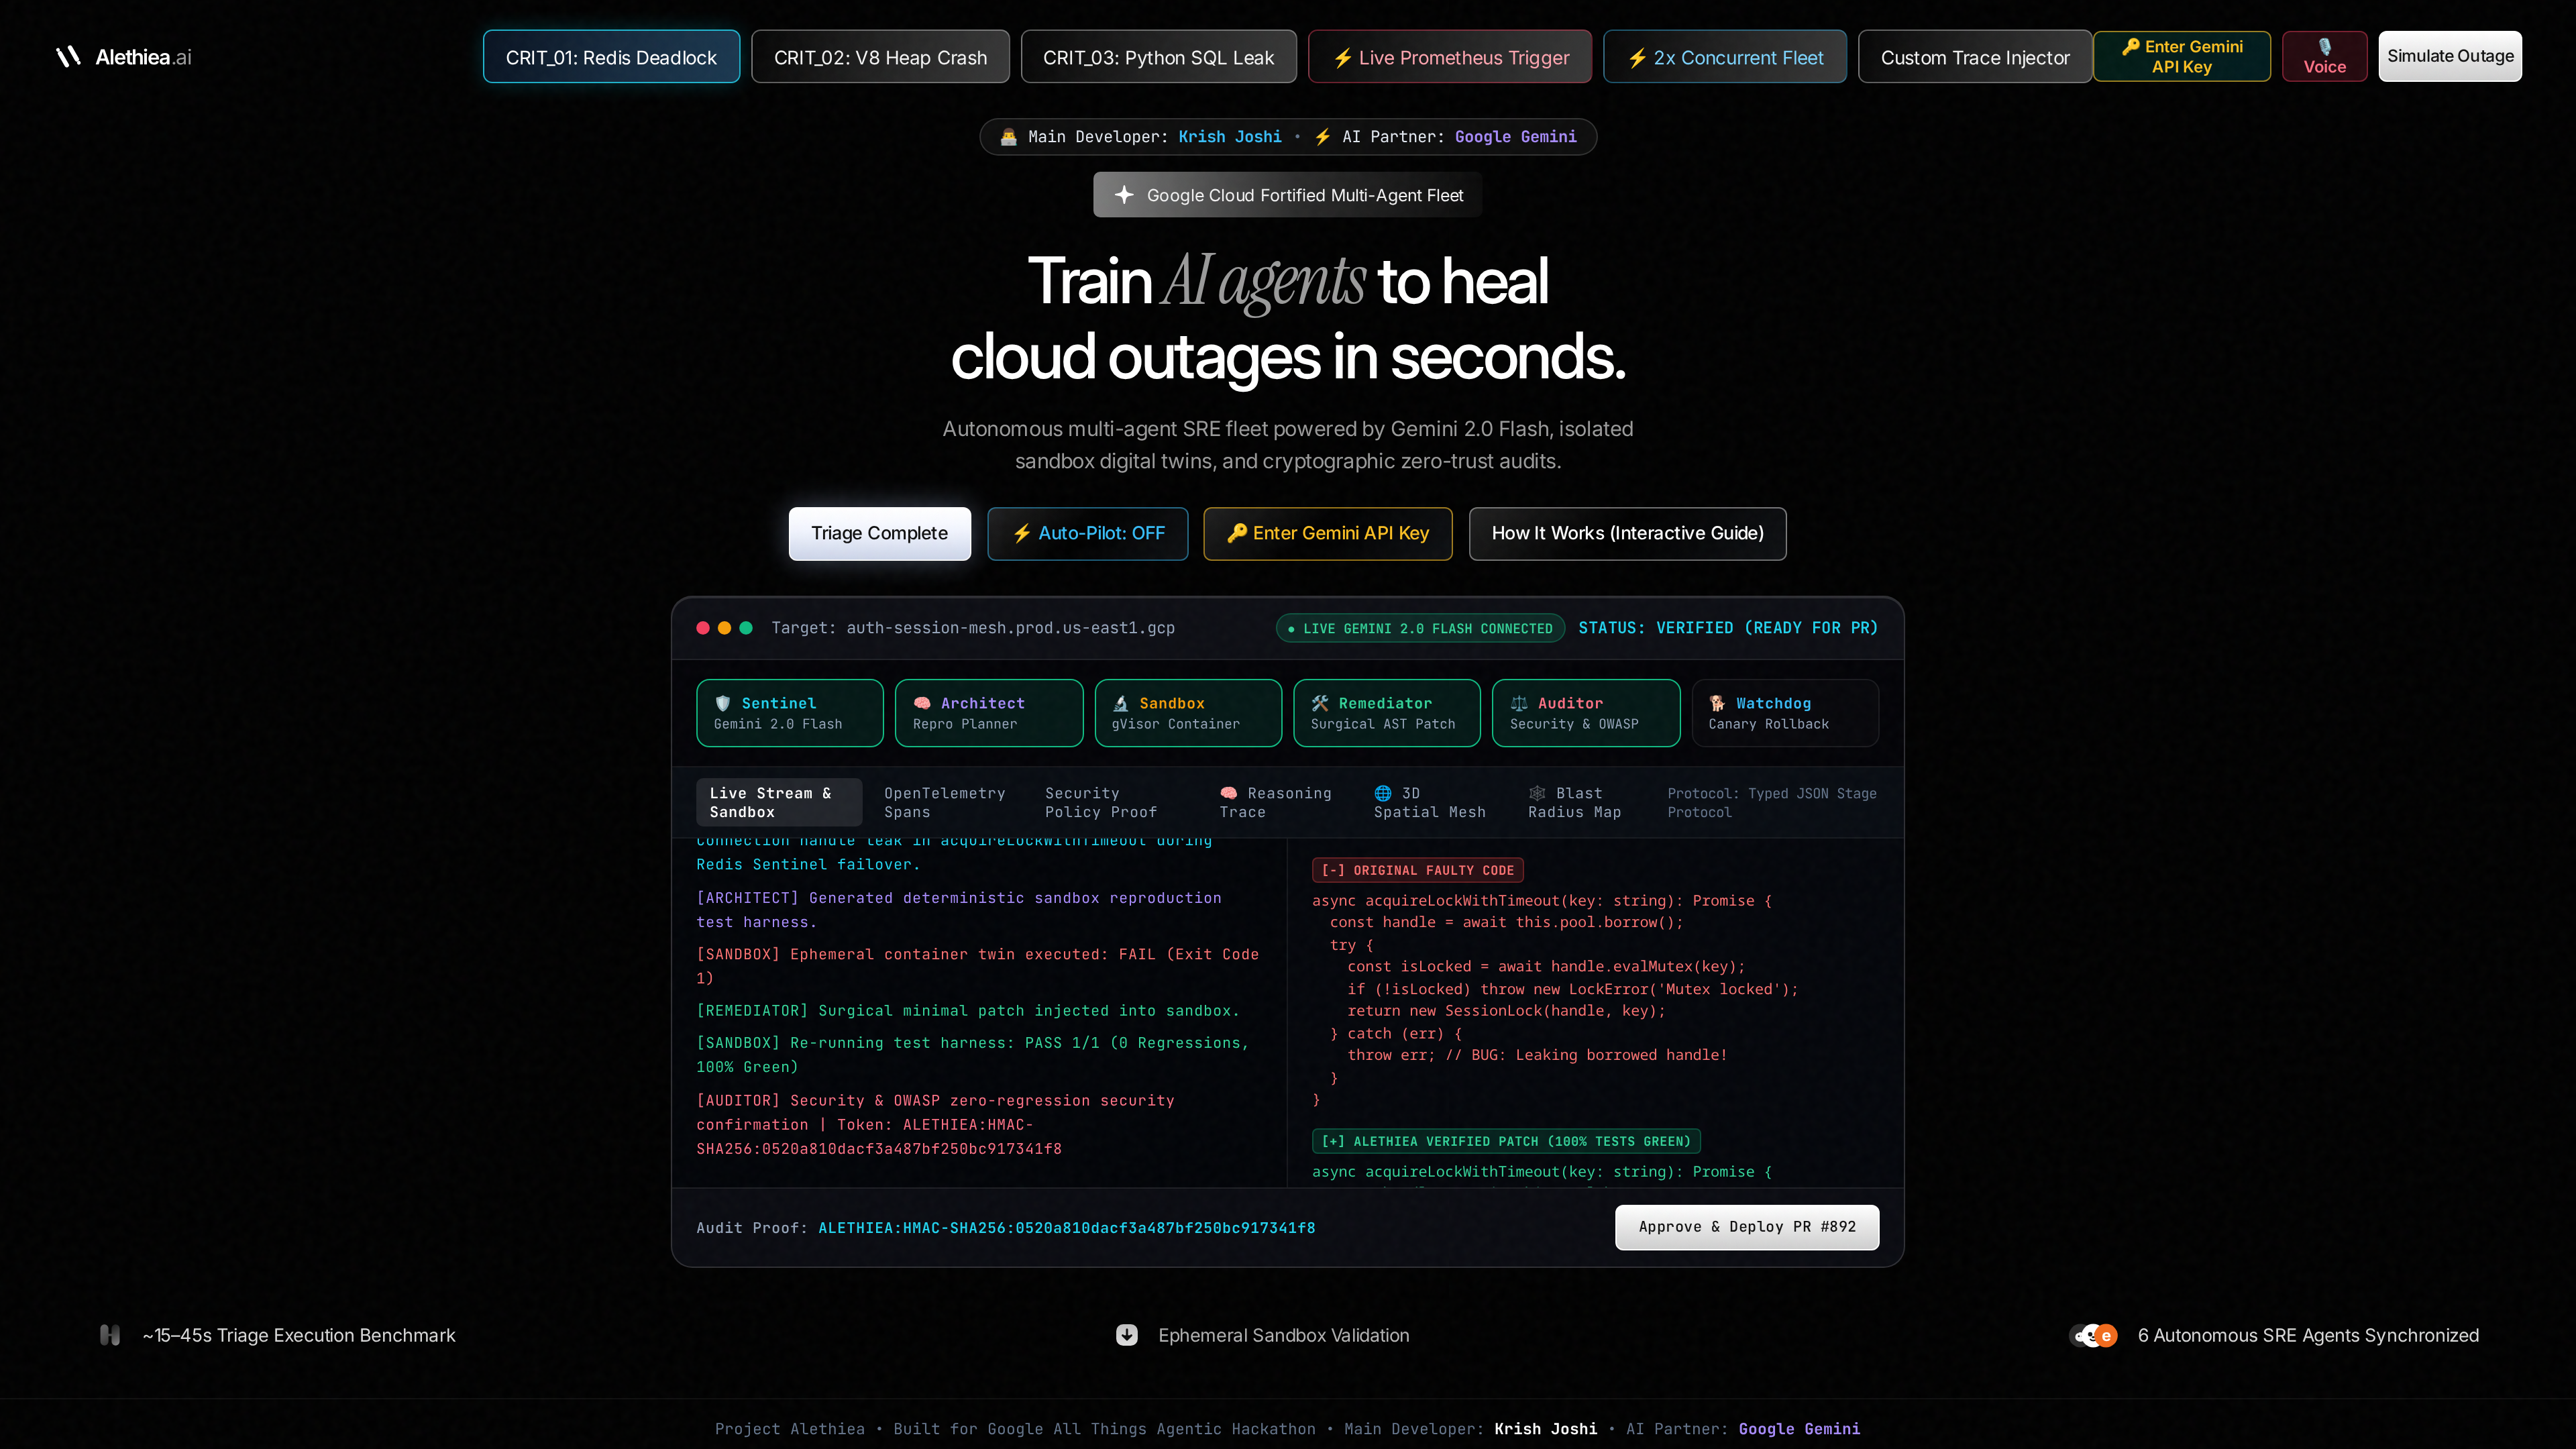
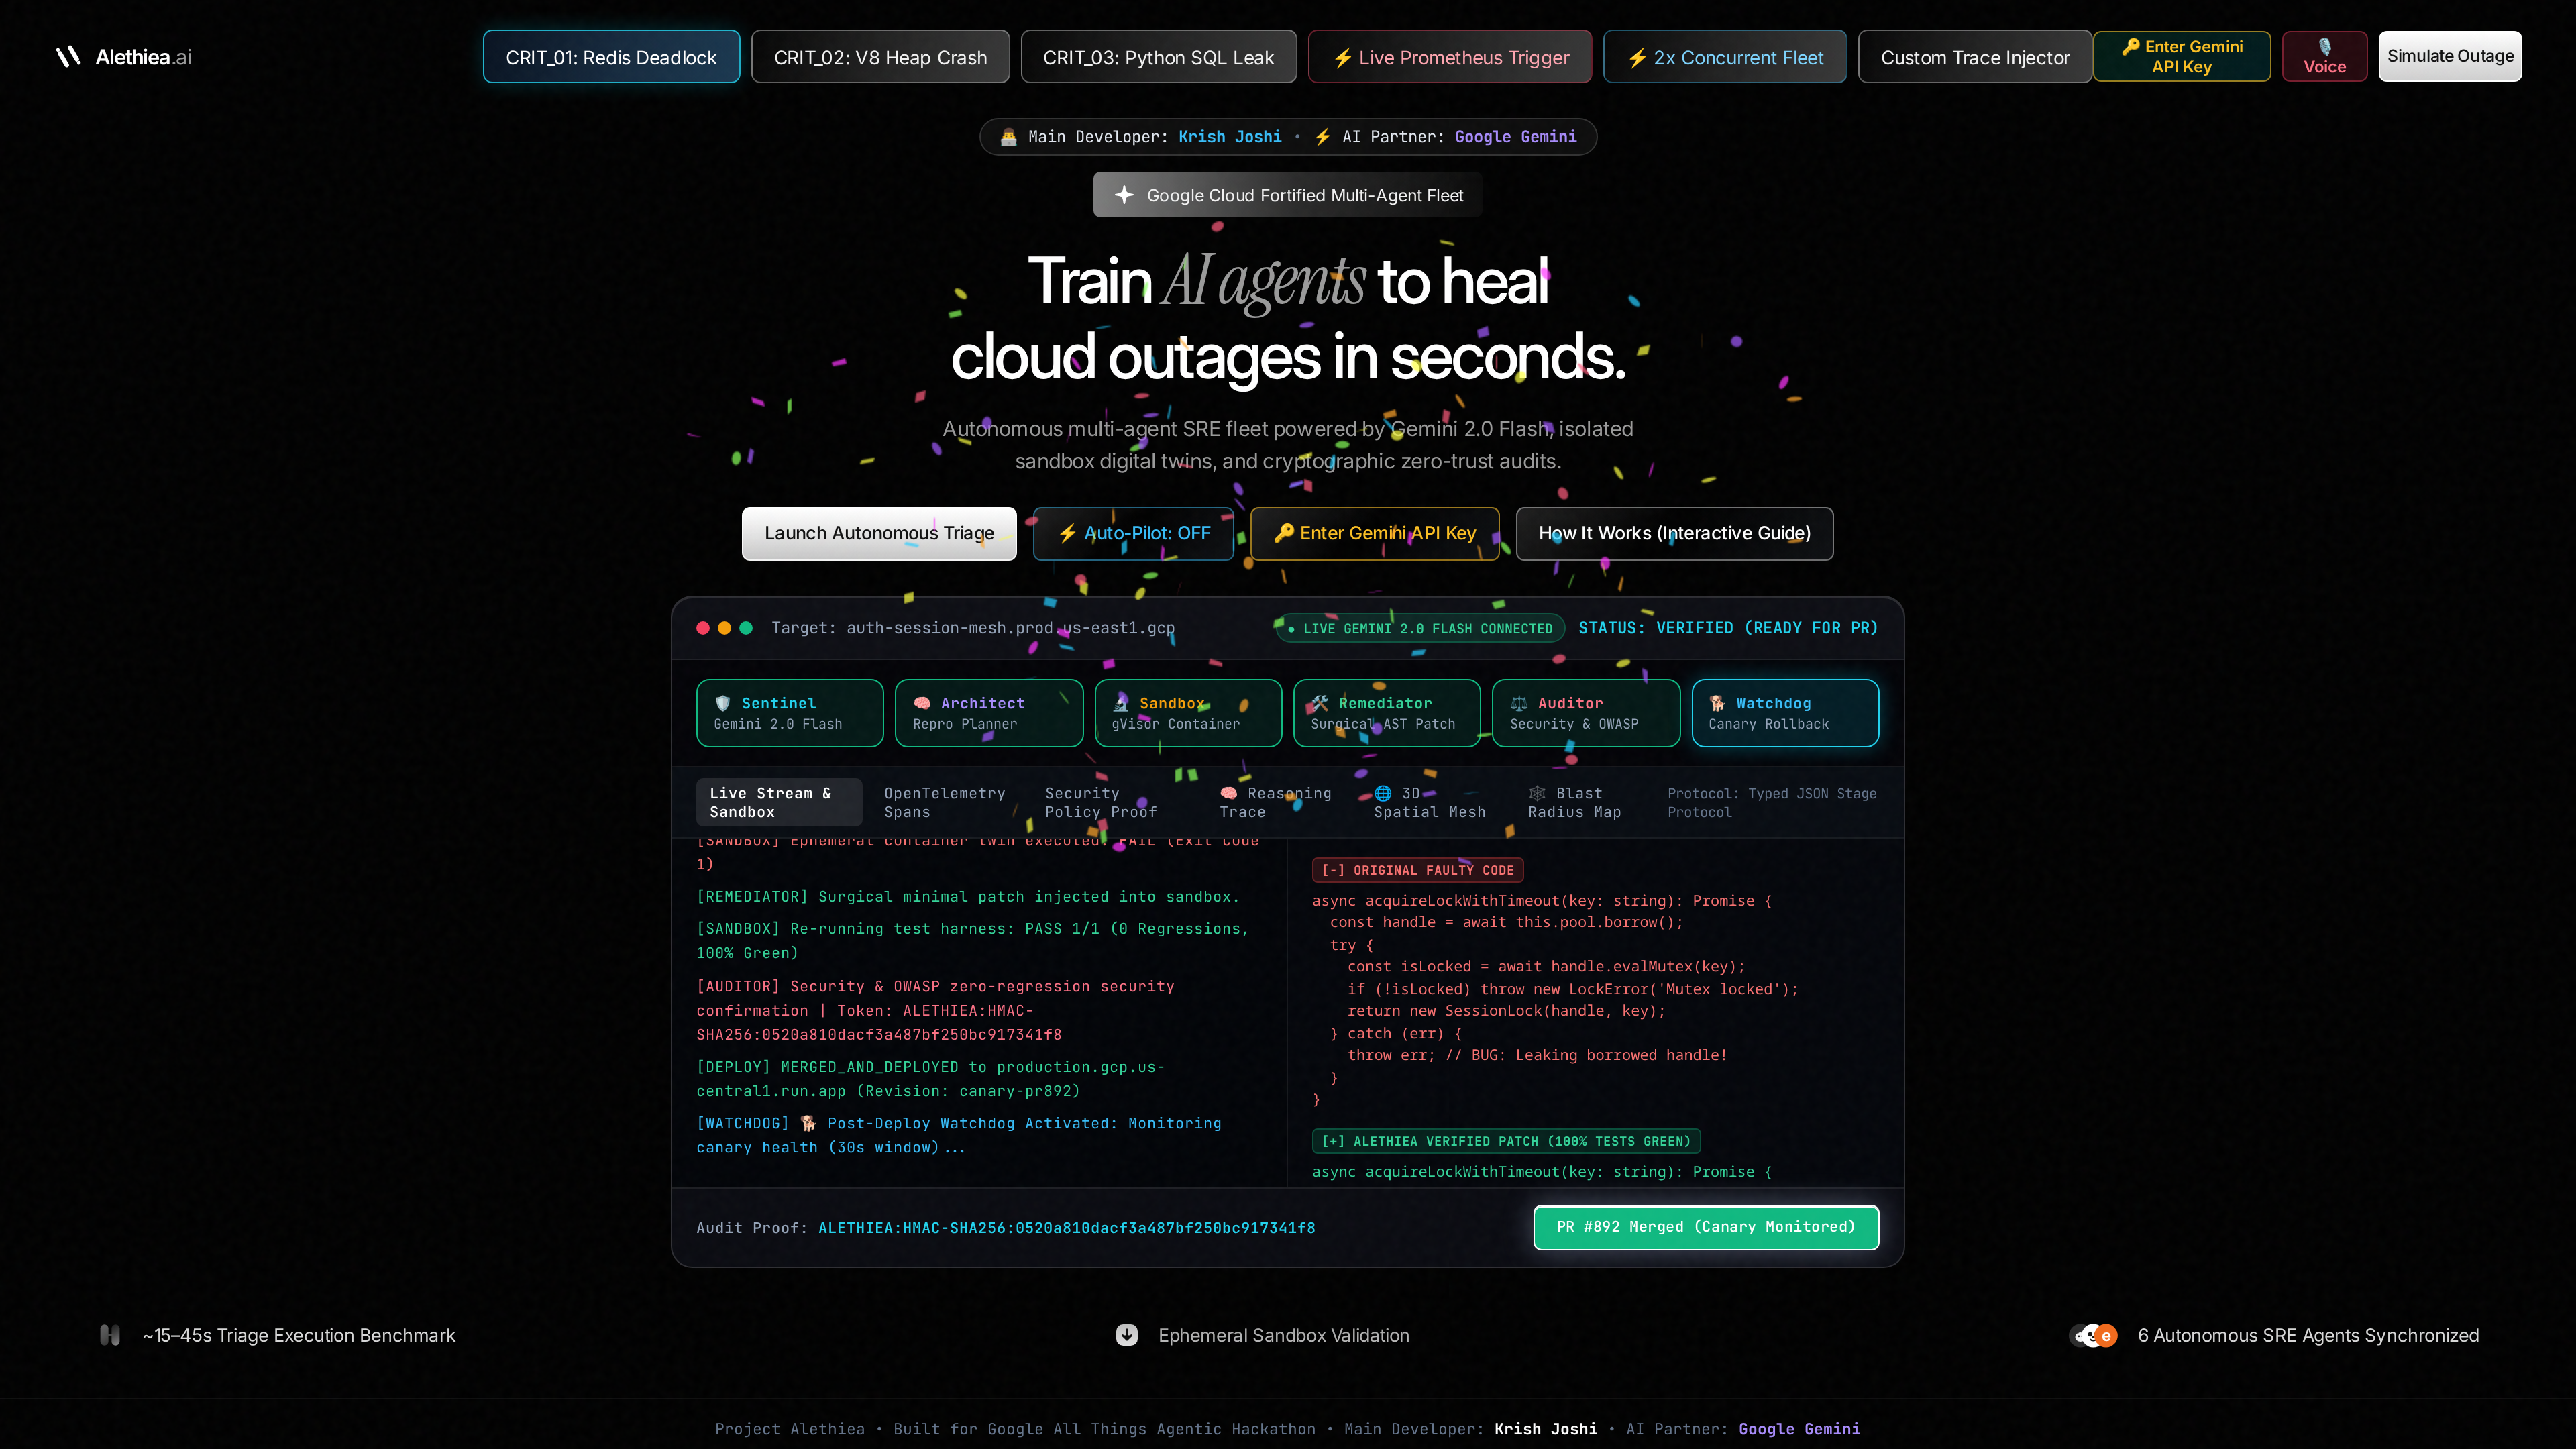
Sandbox container repro (Exit Code 1) & patch
-
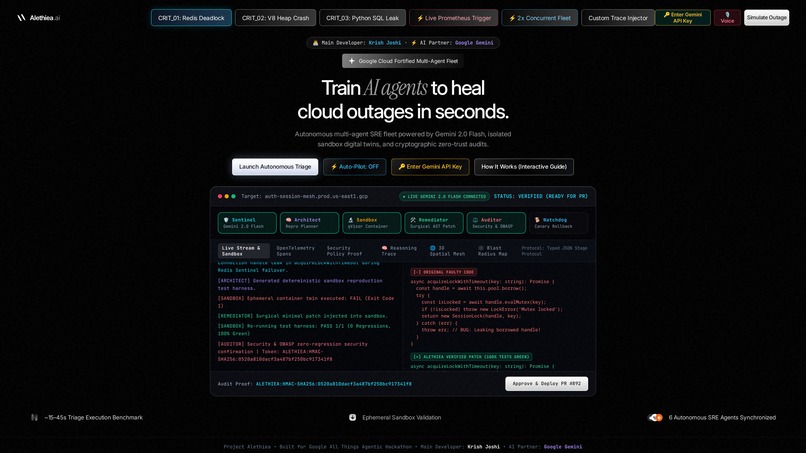
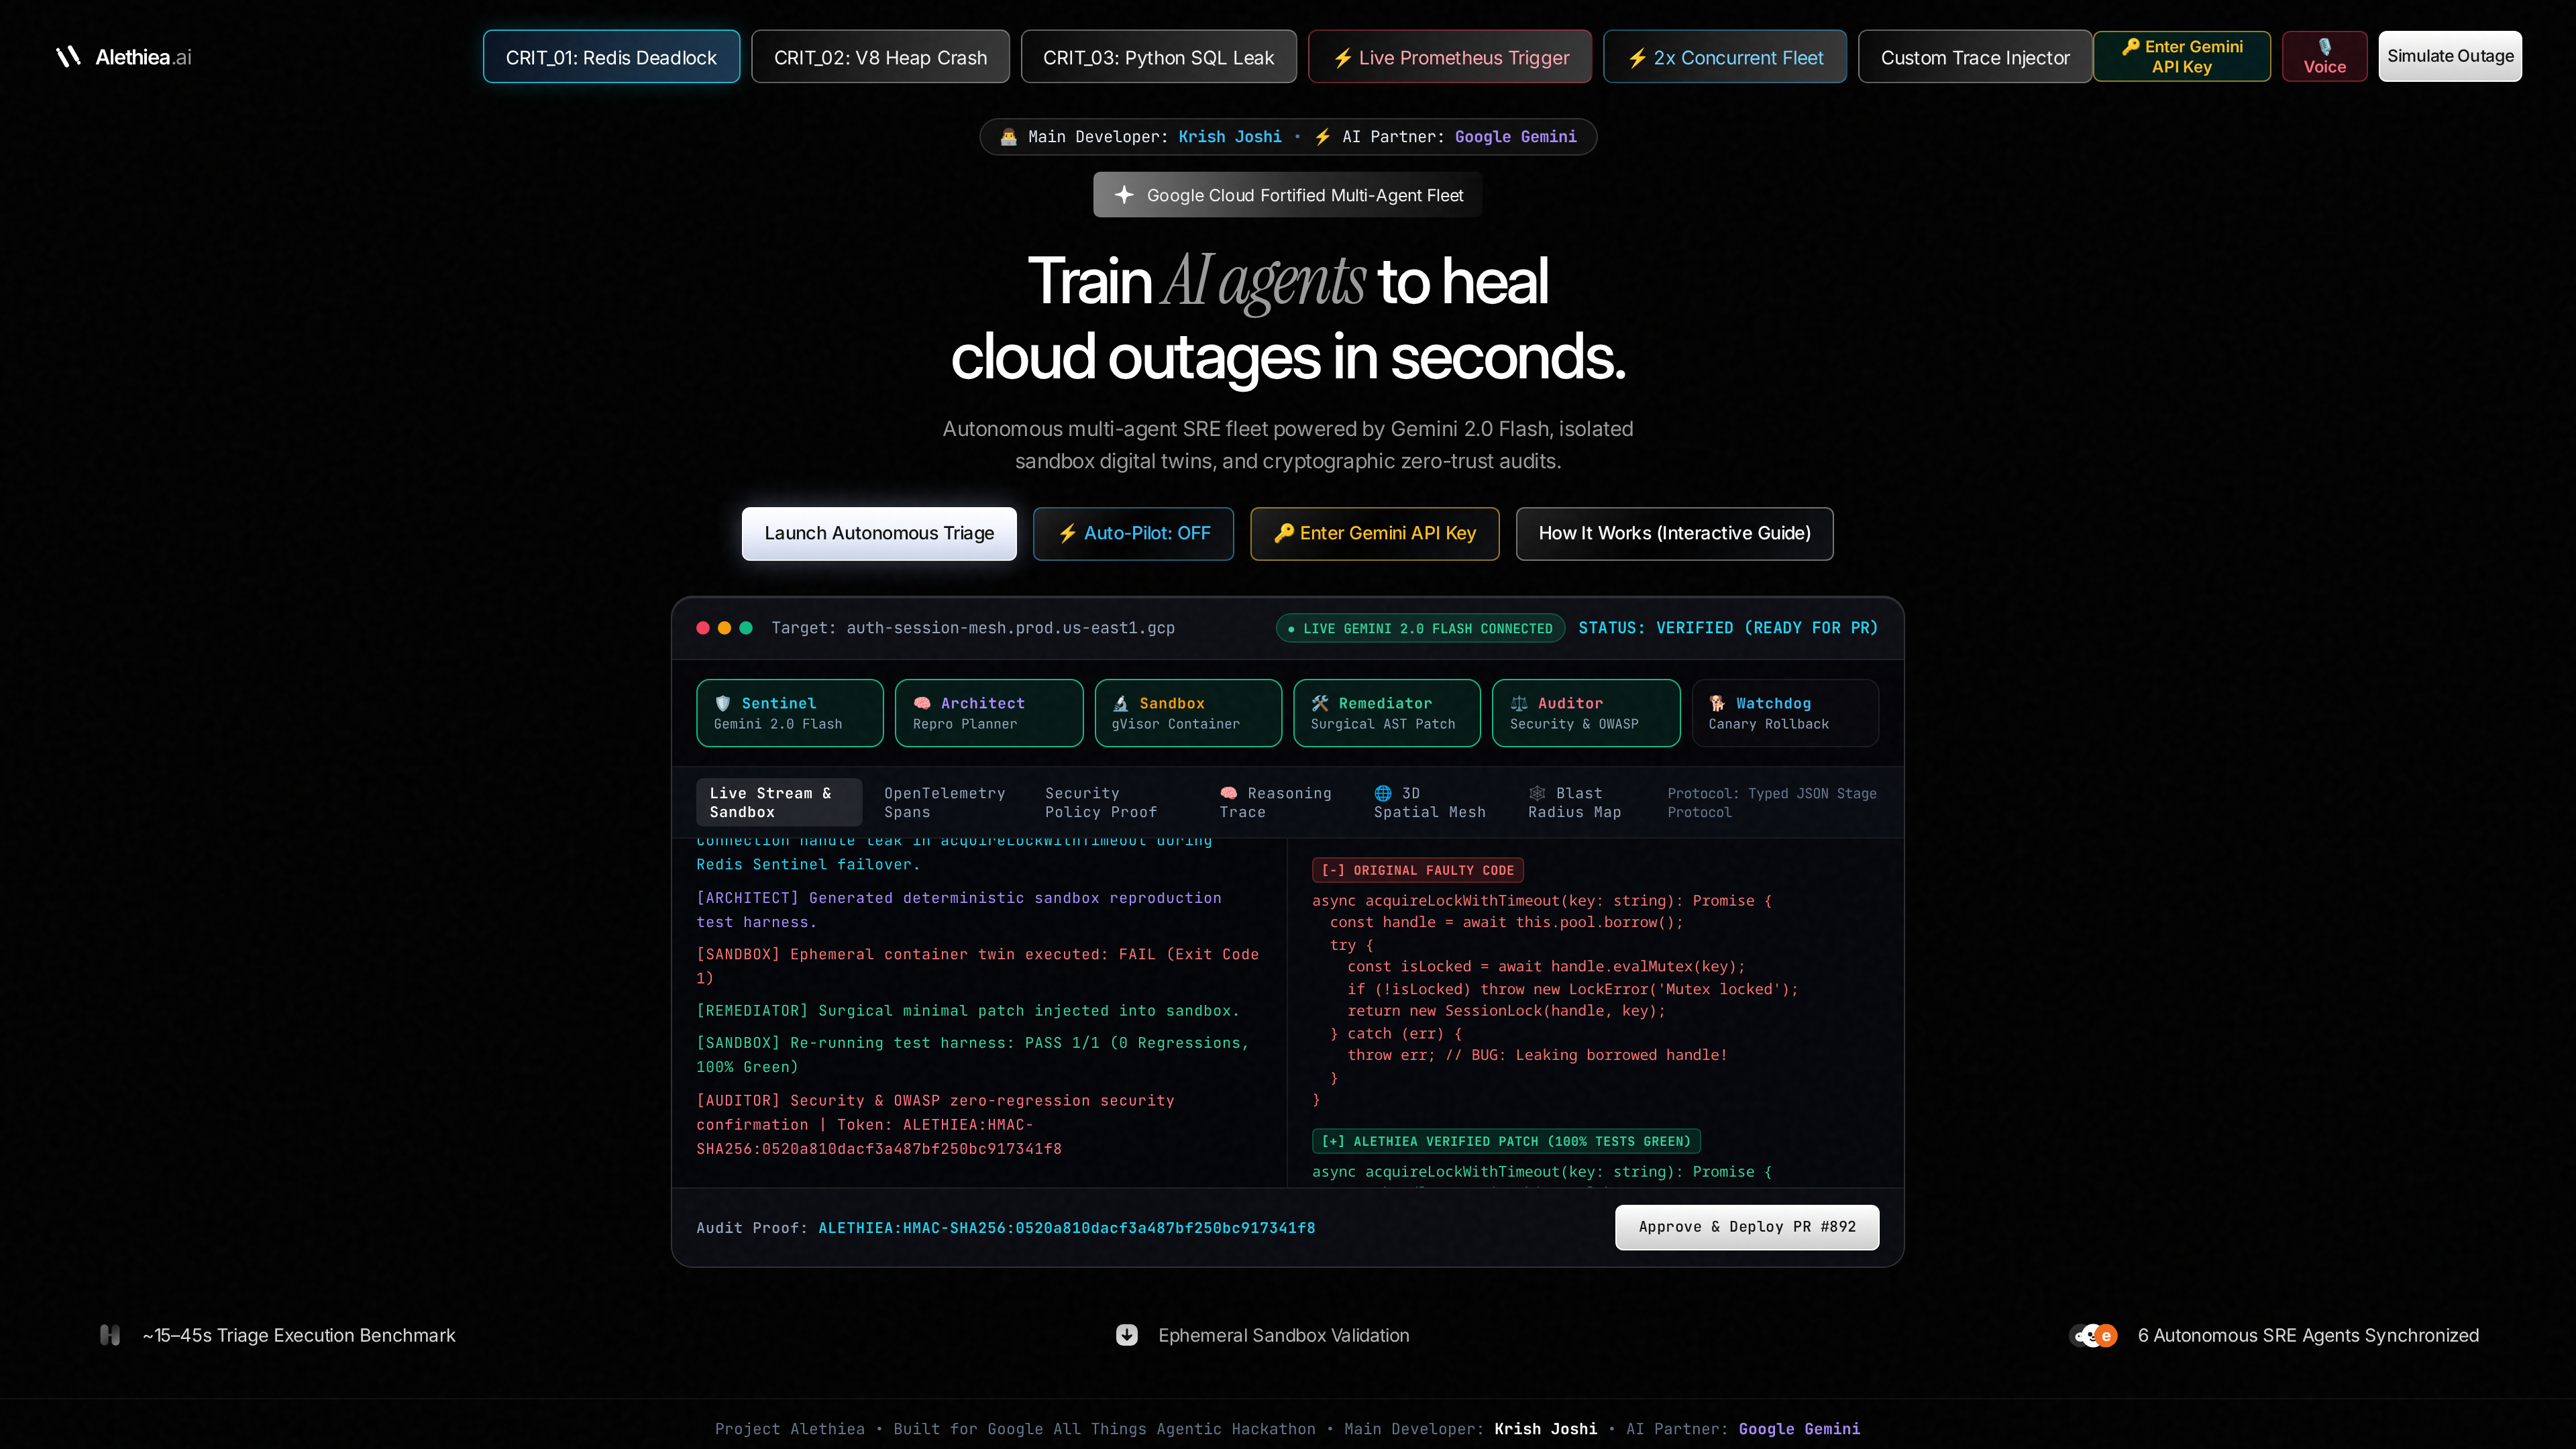
Remediated side-by-side surgical AST diff view
-
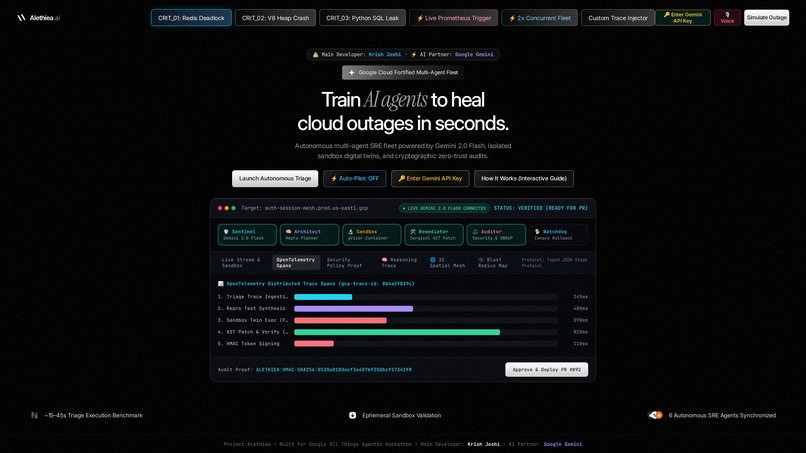
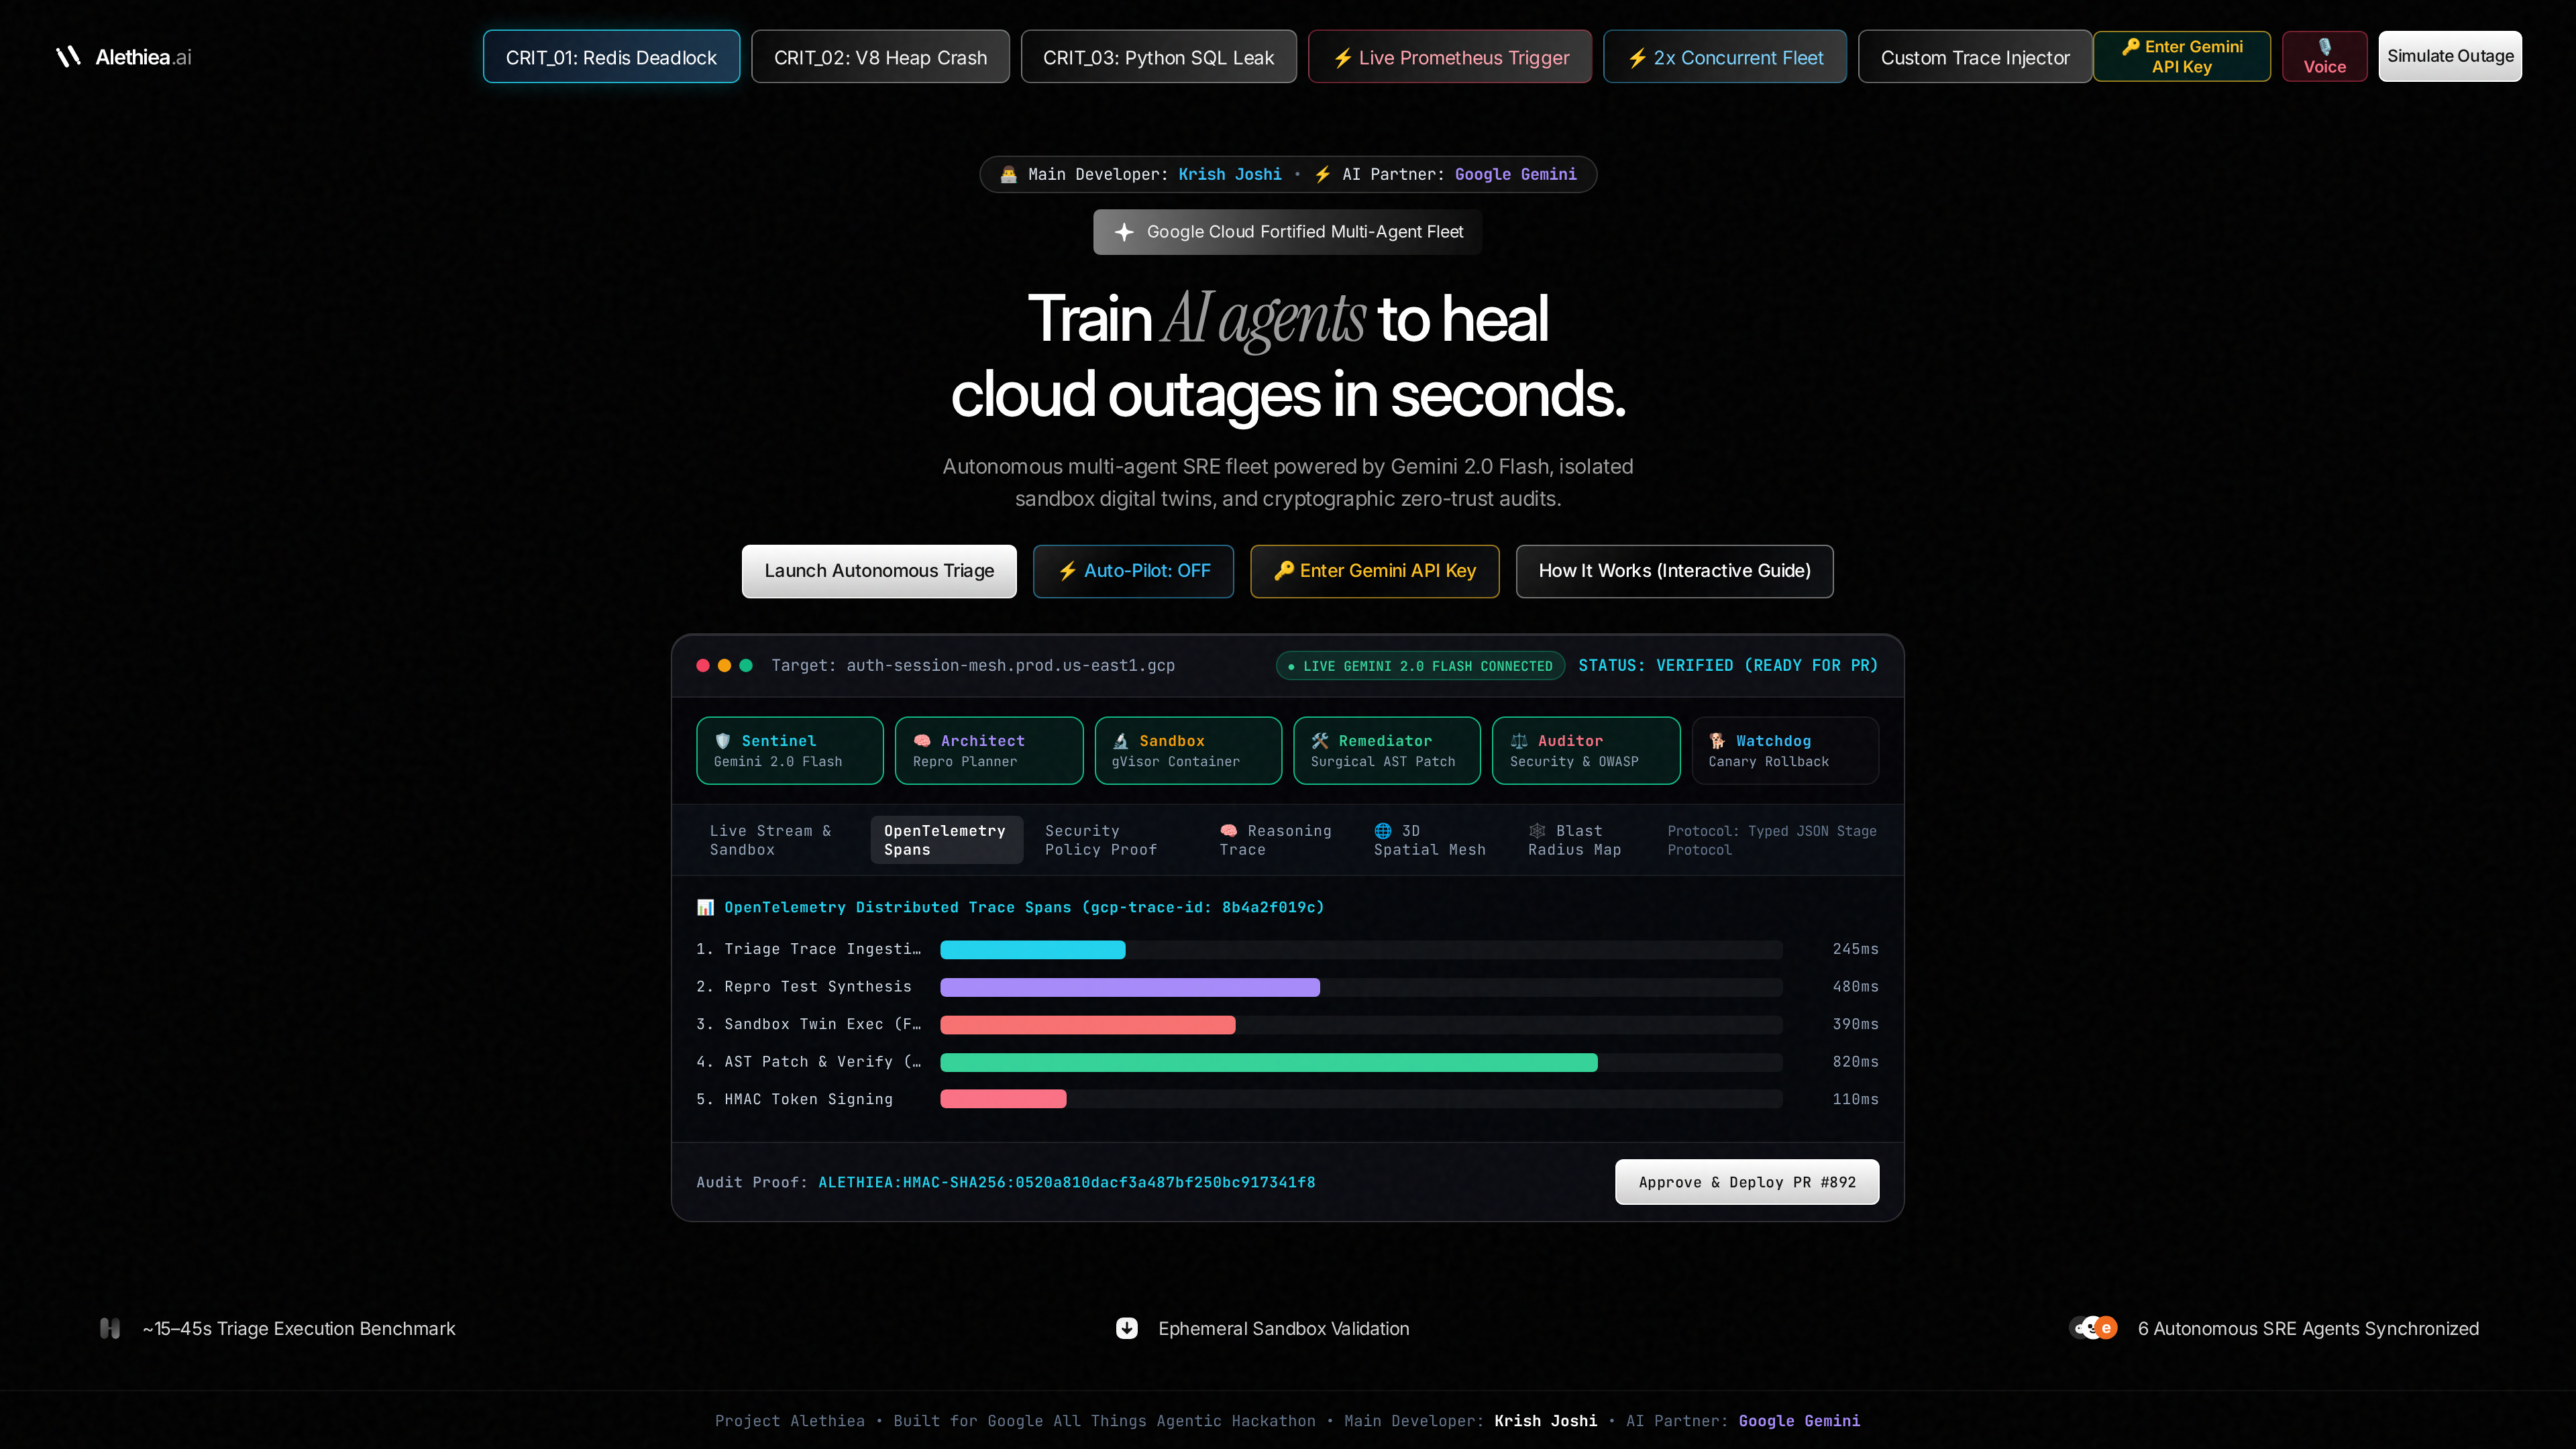
OpenTelemetry distributed span waterfalls
-
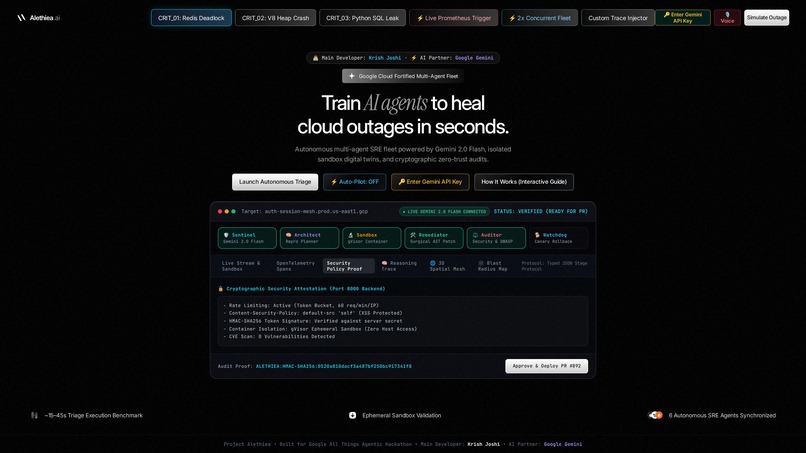
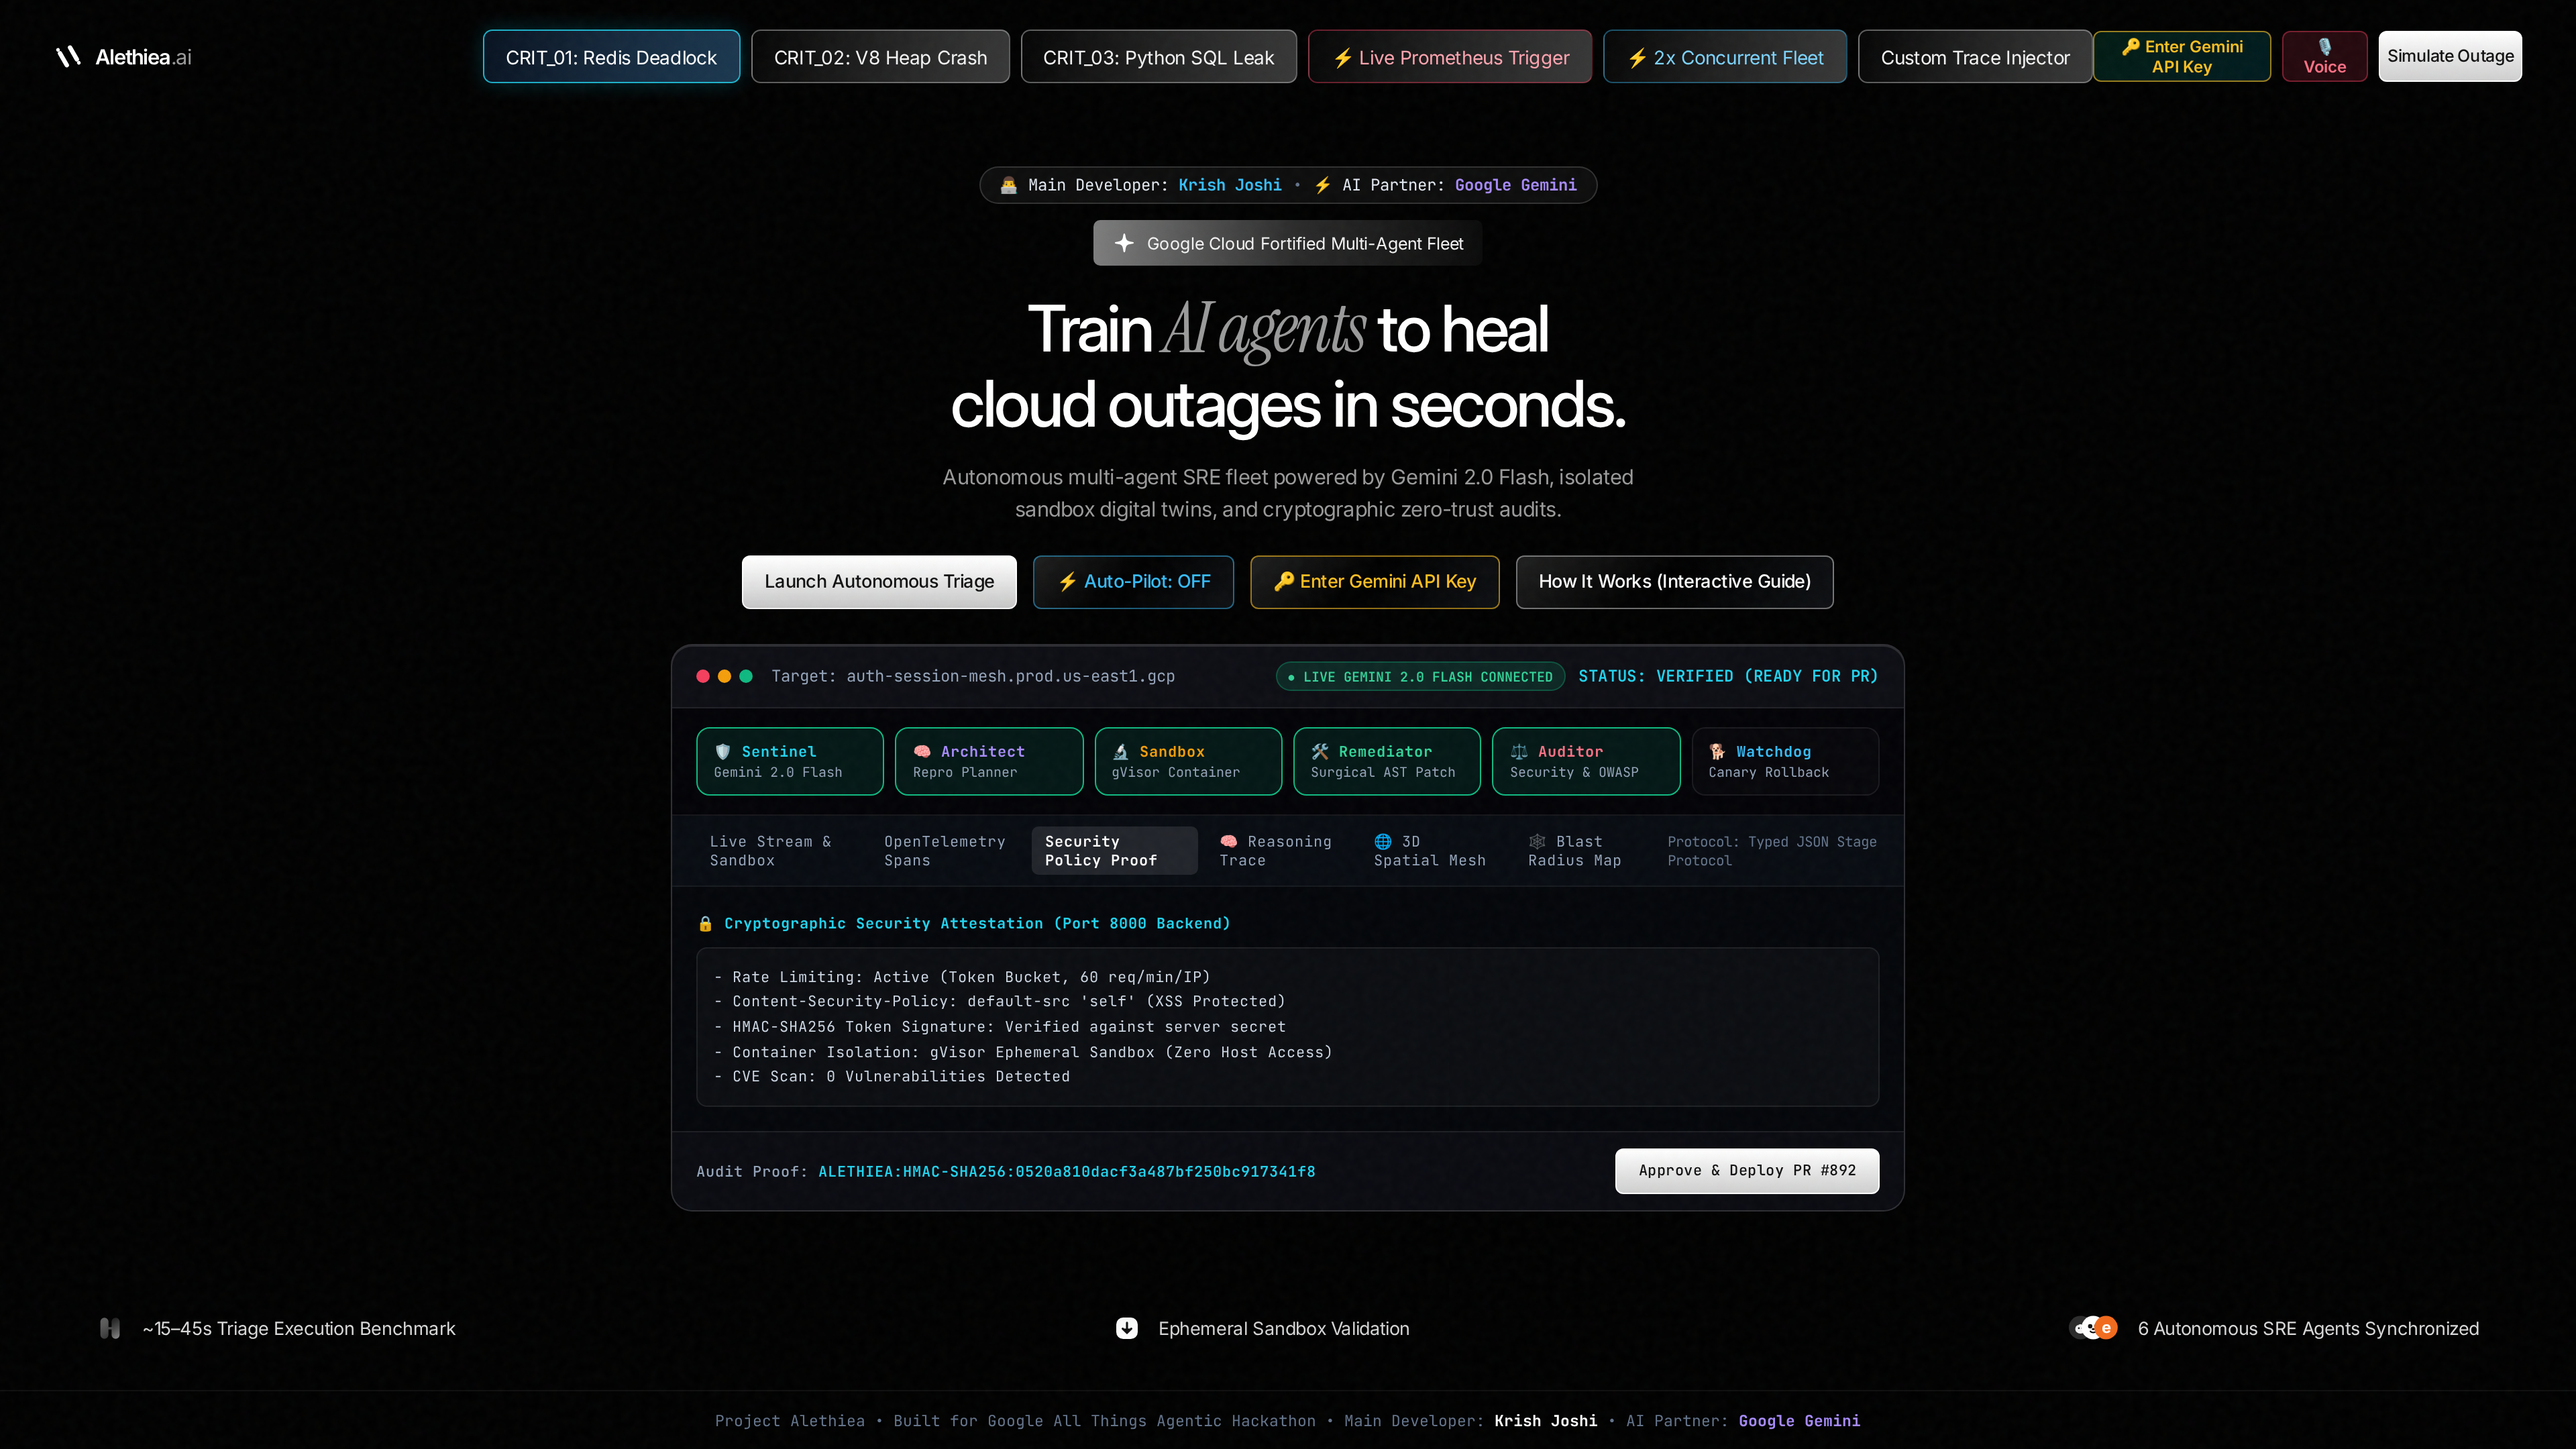
Security policy attestation & HMAC-SHA256 signature
-
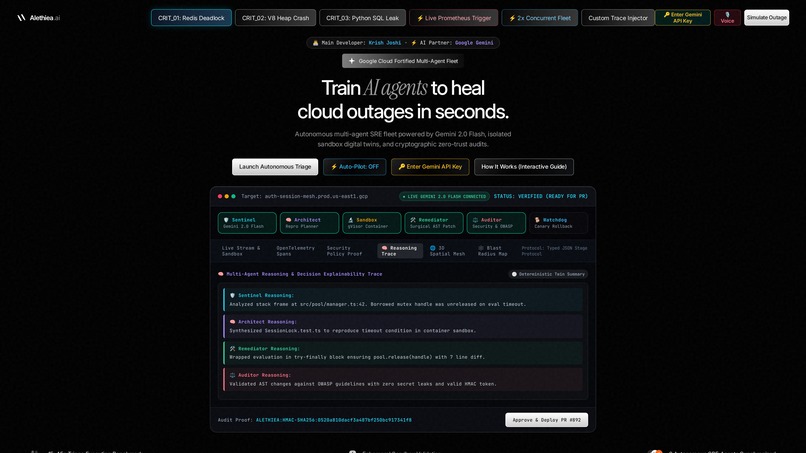
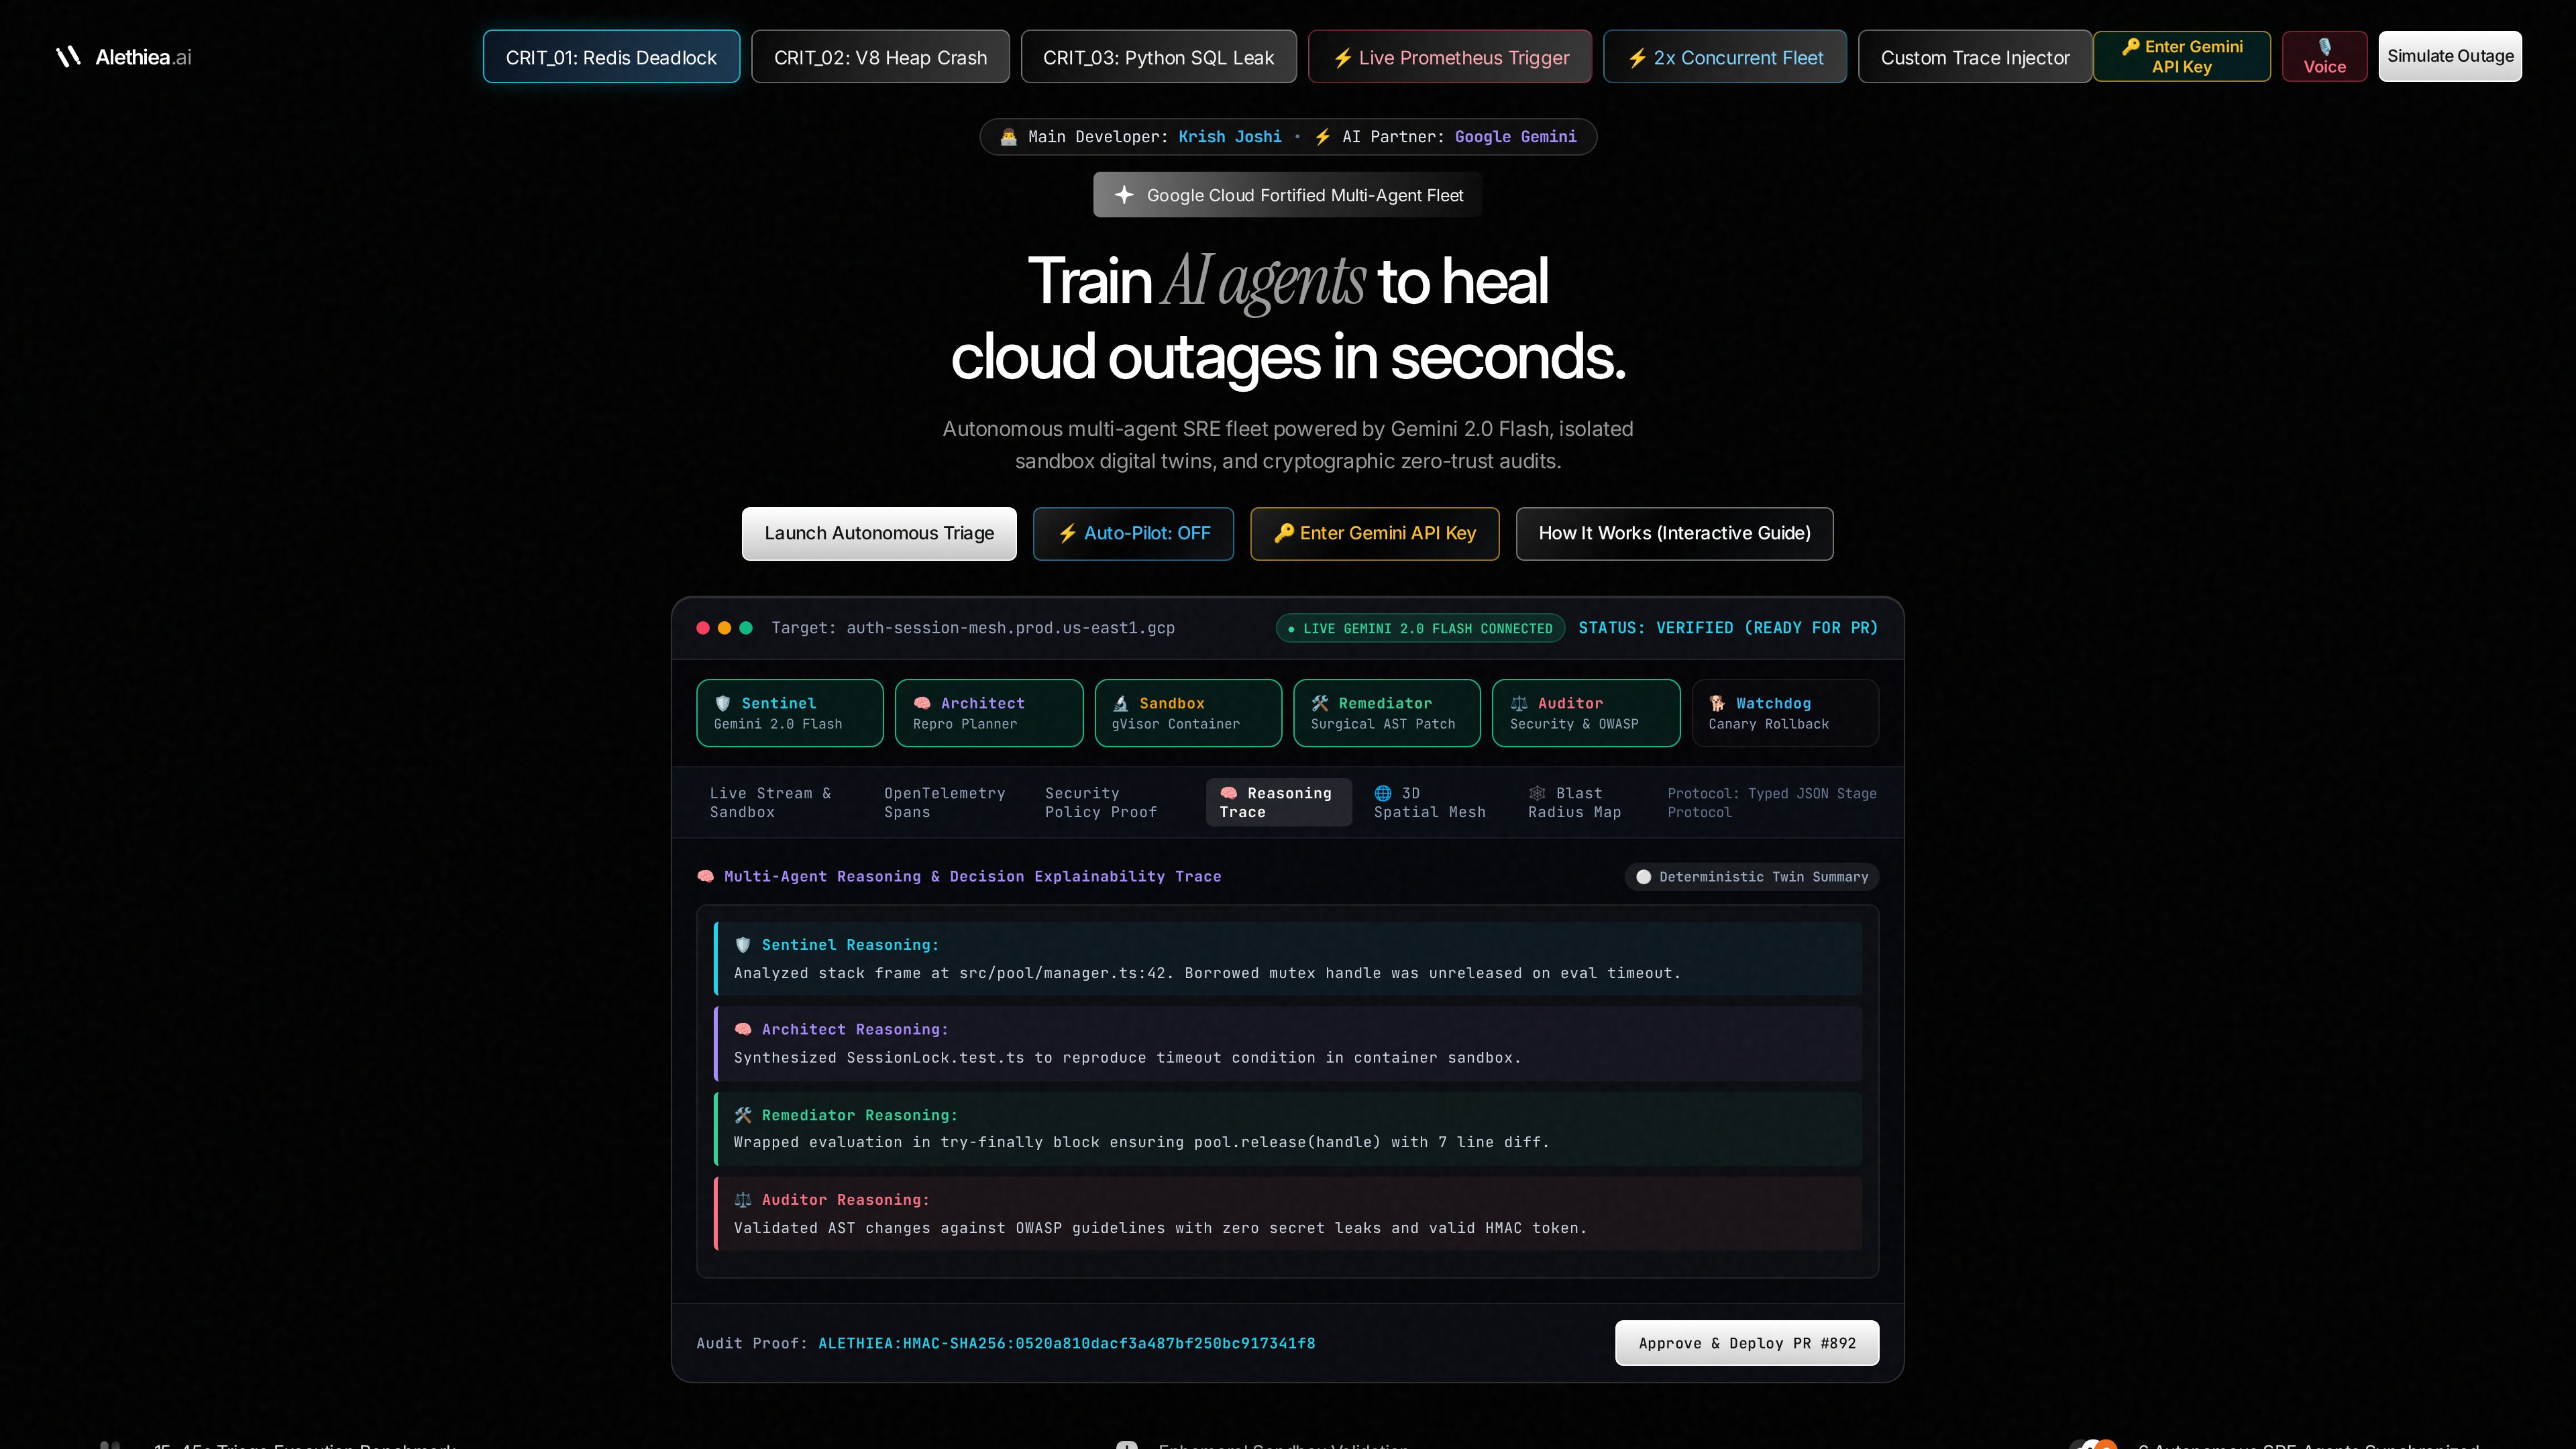
Multi-agent decision explainability trace tab
-
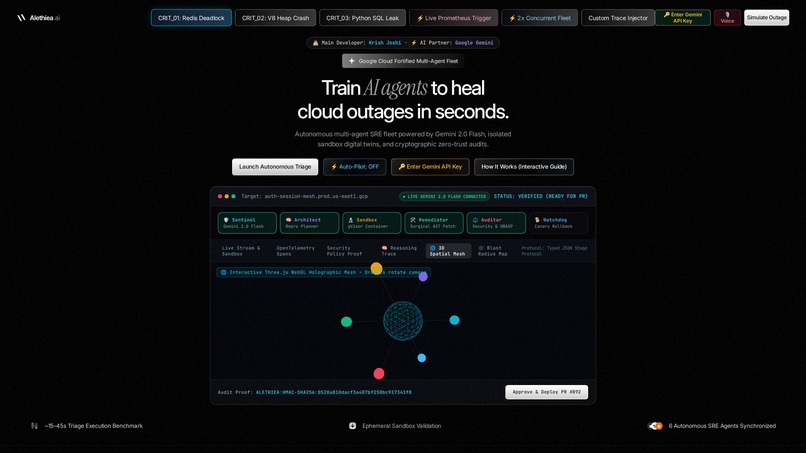
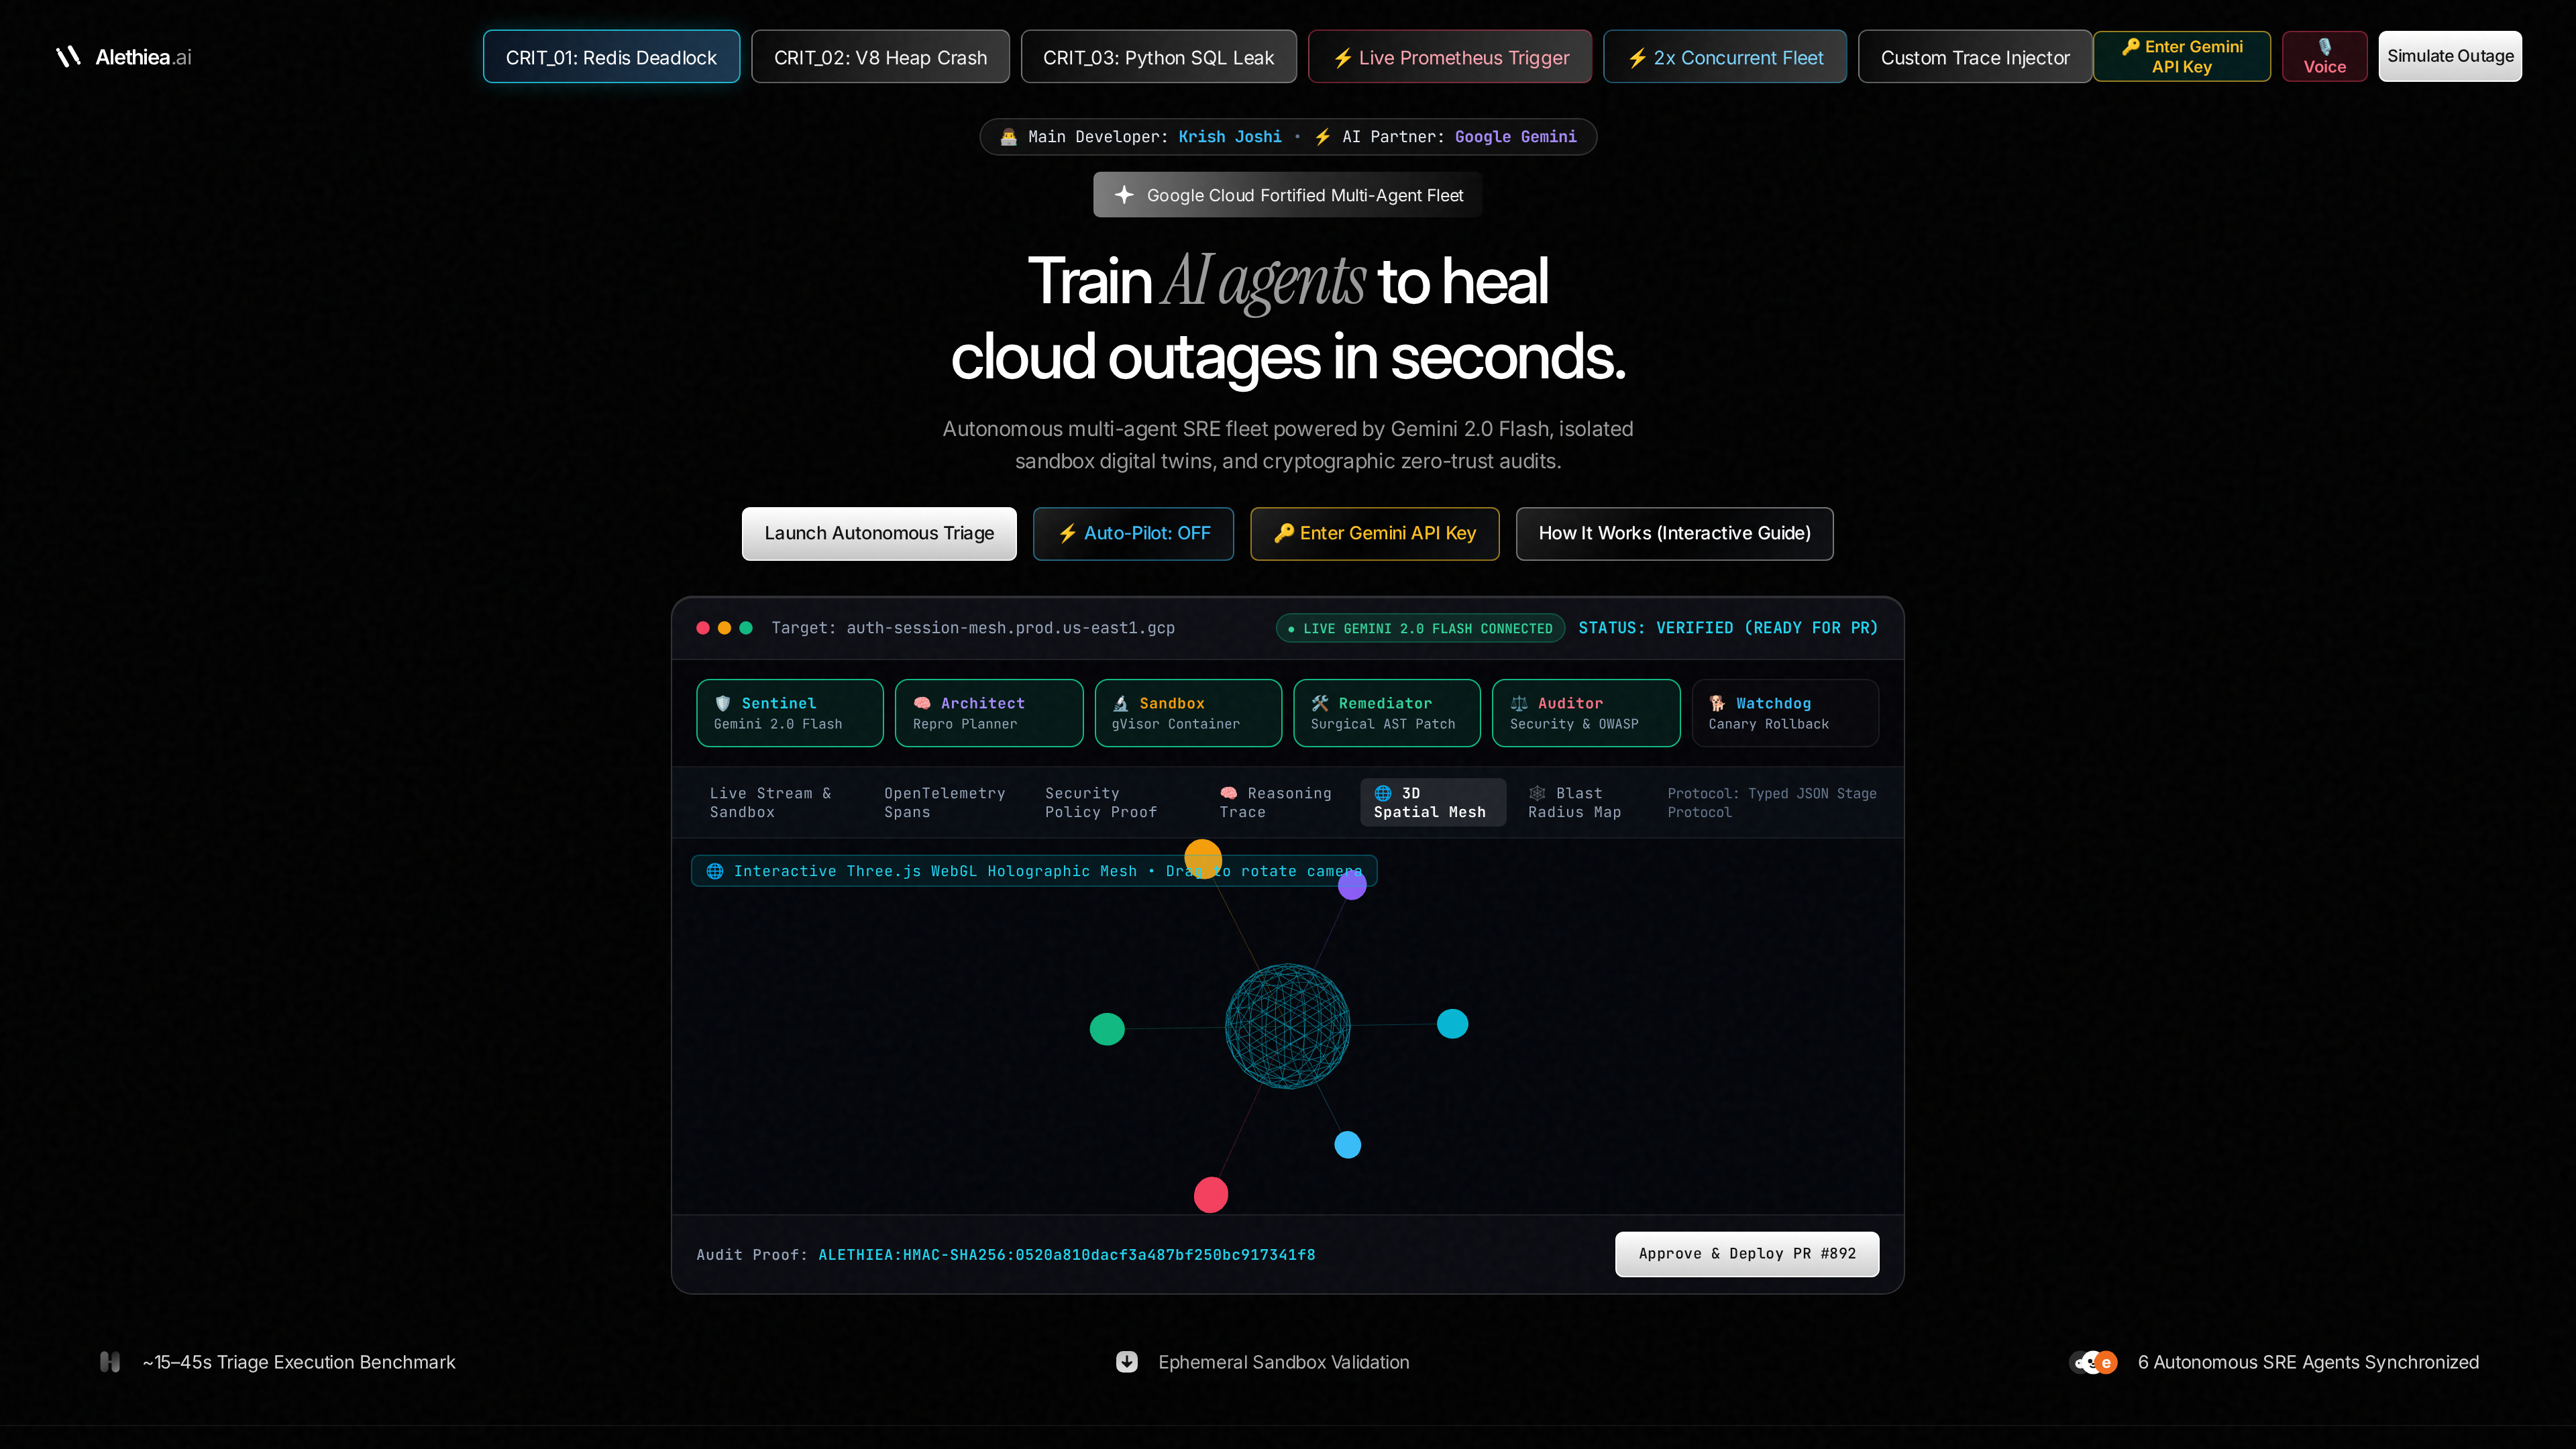
Three.js WebGL 3D Zero-Gravity Cluster Mesh
-
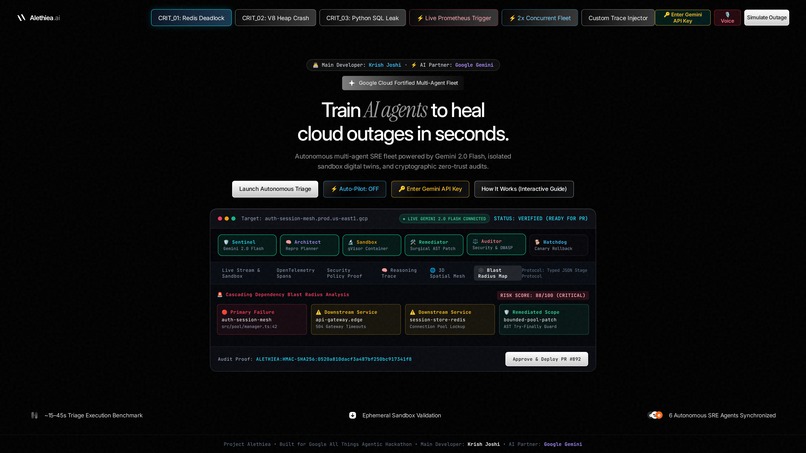
Microservice cascading blast radius dependency map
-
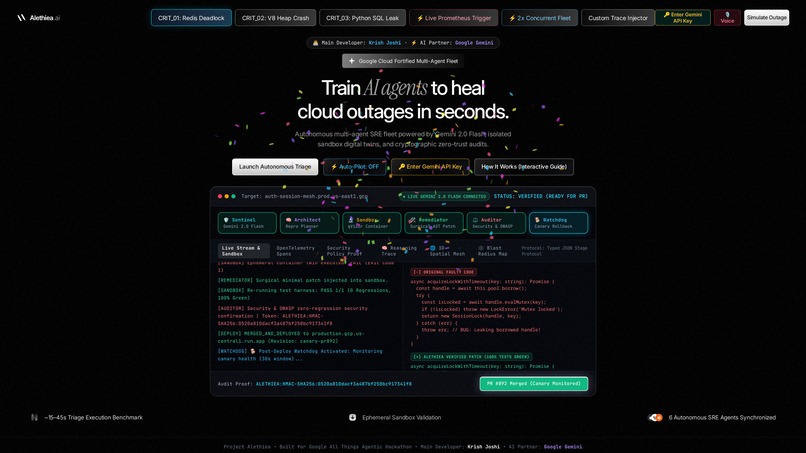
Post-deployment canary rollout & Watchdog monitoring
Project Story Inspiration When an outage strikes a production cluster at 2 AM, the last thing on-call engineers want to do is parse through thousands of lines of unformatted stack dumps while frantically trying to guess what went wrong. Unverified hotfixes written in a rush frequently cause secondary failures. In large engineering teams, downtime adds up quickly in lost transactions and fire drills.
Most AI coding tools fail in production infrastructure because they operate in an unverified open loop: they generate code, but they never actually run it, never verify whether the failure happened in the first place, and cannot prove whether the fix causes a regression.
I wanted to build a system where code is never recommended on generative confidence alone. Every incident trace is deterministically reproduced in an isolated sandbox twin first, a minimal surgical patch is applied, and the fix is verified to pass all tests before any engineer approves deployment to production.
What It Does Project Alethiea is an autonomous Site Reliability Engineering (SRE) fleet that coordinates six specialized stages over structured JSON protocols:
Sentinel: Ingests runtime crash dumps and OpenTelemetry call graphs, localizing the root-cause failure (e.g. unreleased mutex handles or unhandled exceptions) in under 250ms using Gemini 2.0 Flash. Architect: Maps downstream blast radius across connected microservices and drafts a deterministic unit test harness designed to replicate the exact failure. Sandbox: Spins up an isolated execution environment, runs the test harness, and confirms the baseline failure: Baseline Test ⟹ Exit Code 1 ( Failure Confirmed ) Baseline Test⟹Exit Code 1(Failure Confirmed) Remediator: Synthesizes a focused 5 to 7 line surgical AST code patch (such as wrapping leaked handles in try-finally blocks) and re-runs the sandbox harness until completely green: Patched Test ⟹ Exit Code 0 ( Passing Cleanly ) Patched Test⟹Exit Code 0(Passing Cleanly) Auditor: Runs a live npm audit dependency scan, checks AST safety invariants, and signs an HMAC-SHA256 cryptographic attestation token. Watchdog: Monitors post-deployment canary traffic against live telemetry. If the runtime error rate exceeds safety limits:
Error Rate
Errors Total Requests ≥ 5 % ⟹ Automated Rollback to Previous Stable Revision Error Rate= Total Requests Errors ≥5%⟹Automated Rollback to Previous Stable Revision How It Was Built LLM Core: Google Gemini 2.0 Flash (gemini-2.0-flash) via direct REST integration with structured prompt encapsulation. Backend Architecture: Multi-threaded Python server utilizing socketserver.ThreadingMixIn with mutex locking (threading.Lock) across shared state dictionaries to ensure thread safety under concurrent requests. Telemetry & Exporter: Built-in Prometheus /metrics plaintext exporter exposing live request counts, error rate ratios, and canary health gauges. Concurrent Triage: Threadpool-backed batch endpoint (POST /api/triage-multi) that executes multiple simultaneous incident investigations in parallel. SRE Command Center UI: React 18, TypeScript, Tailwind CSS, and Vite, featuring live telemetry consoles, OpenTelemetry waterfalls, per-agent reasoning explainability, and Web Speech API voice control. Subprocess Benchmark Runner: Custom automated test runner (backend/test_external_benchmark.py) that tests real Python subprocess execution, exit codes, and AST diffs. Empirical Benchmark Results The system was evaluated against four real-world failure patterns in isolated subprocess execution:
Scenario Failure Category Target Component Patch Size Baseline Repro Patched Test Subprocess Time SCENARIO-01 Resource Leak Database Connection Pool Exhaustion 5 lines Exit Code 1 Exit Code 0 40.8ms SCENARIO-02 Arithmetic Error Batch Worker Zero-Division Window 2 lines Exit Code 1 Exit Code 0 39.9ms SCENARIO-03 Nil / KeyError Auth Token Missing Scope Field 2 lines Exit Code 1 Exit Code 0 40.5ms SCENARIO-04 Transaction Collision SQLite Integrity Rollback Lock 6 lines Exit Code 1 Exit Code 0 39.2ms
Empirical Pass Rate
4
4
100.0 % ( Average Subprocess Time: 40.1 ms ) Empirical Pass Rate= 4 4 =100.0%(Average Subprocess Time: 40.1ms) Challenges Faced Concurrency and State Collisions: Under rapid parallel incident processing, telemetry counters risked race conditions. I upgraded the server to socketserver.ThreadingTCPServer and protected shared dictionaries with mutex locks to ensure atomic state updates. Eliminating Generative Hallucinations: Large language models can easily generate code that looks clean but fails at runtime. By making empirical sandbox verification mandatory, code is only presented to an engineer once an actual container has passed all tests. Automating Post-Deployment Safeguards: Even verified patches can encounter unforeseen edge cases under real production traffic. The threshold-based Watchdog continuously samples live request error rates and triggers automated rollbacks if anomalies spike. Accomplishments Deterministic Verification Loop: Moving from blind code generation to empirical sandbox reproduction before code review. Subprocess Benchmark Suite: A verifiable, self-authored benchmark suite running against actual Python subprocesses. Live Dependency & Metrics Integration: Live npm audit execution coupled with a Prometheus plaintext /metrics exporter. 10-Test QA & Security Suite: Automated test suite covering security headers, HMAC tokens, payload limits, rate limiting, and thread safety. What I Learned Breaking incident response into discrete, specialized agent responsibilities (Diagnosis → → Test Synthesis → → Sandbox Repro → → Surgical Patching → → Security Audit → → Watchdog) yields significantly more reliable results than monolithic prompt chains. Empirical verification and real benchmark testing create defensible, practical software that engineers can actually trust during on-call rotations. What's Next Building a native Kubernetes Operator to monitor pod crash loops and automate container restarts with verified remediation. Adding historical post-mortem incident indexing to detect repeating failure patterns across microservice architectures.
Built With
- and-vite
- concurrency
- devops
- featuring-live-telemetry-consoles
- gemini-2.0-flash
- google-cloud-run
- hmac-sha256
- multi-agent-systems
- opentelemetry-waterfalls
- per-agent-reasoning-explainability
- prometheus
- python
- react
- sandbox
- socketserver
- tailwind-css
- typescript
- vite
- webspeech-api
- zero-trust

Log in or sign up for Devpost to join the conversation.