-
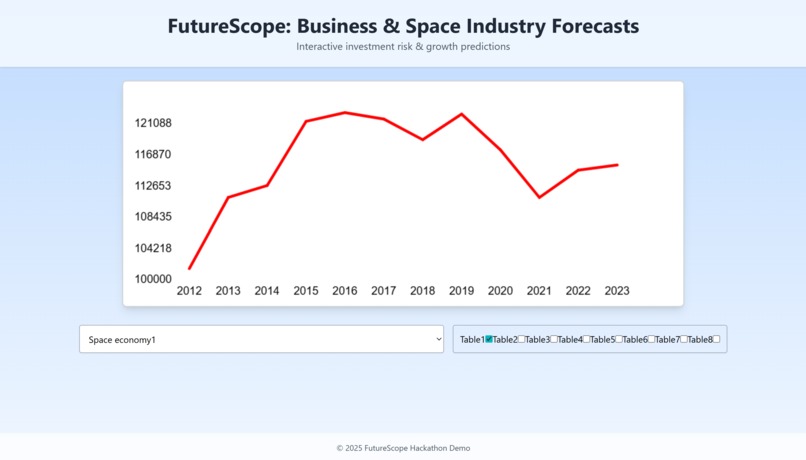
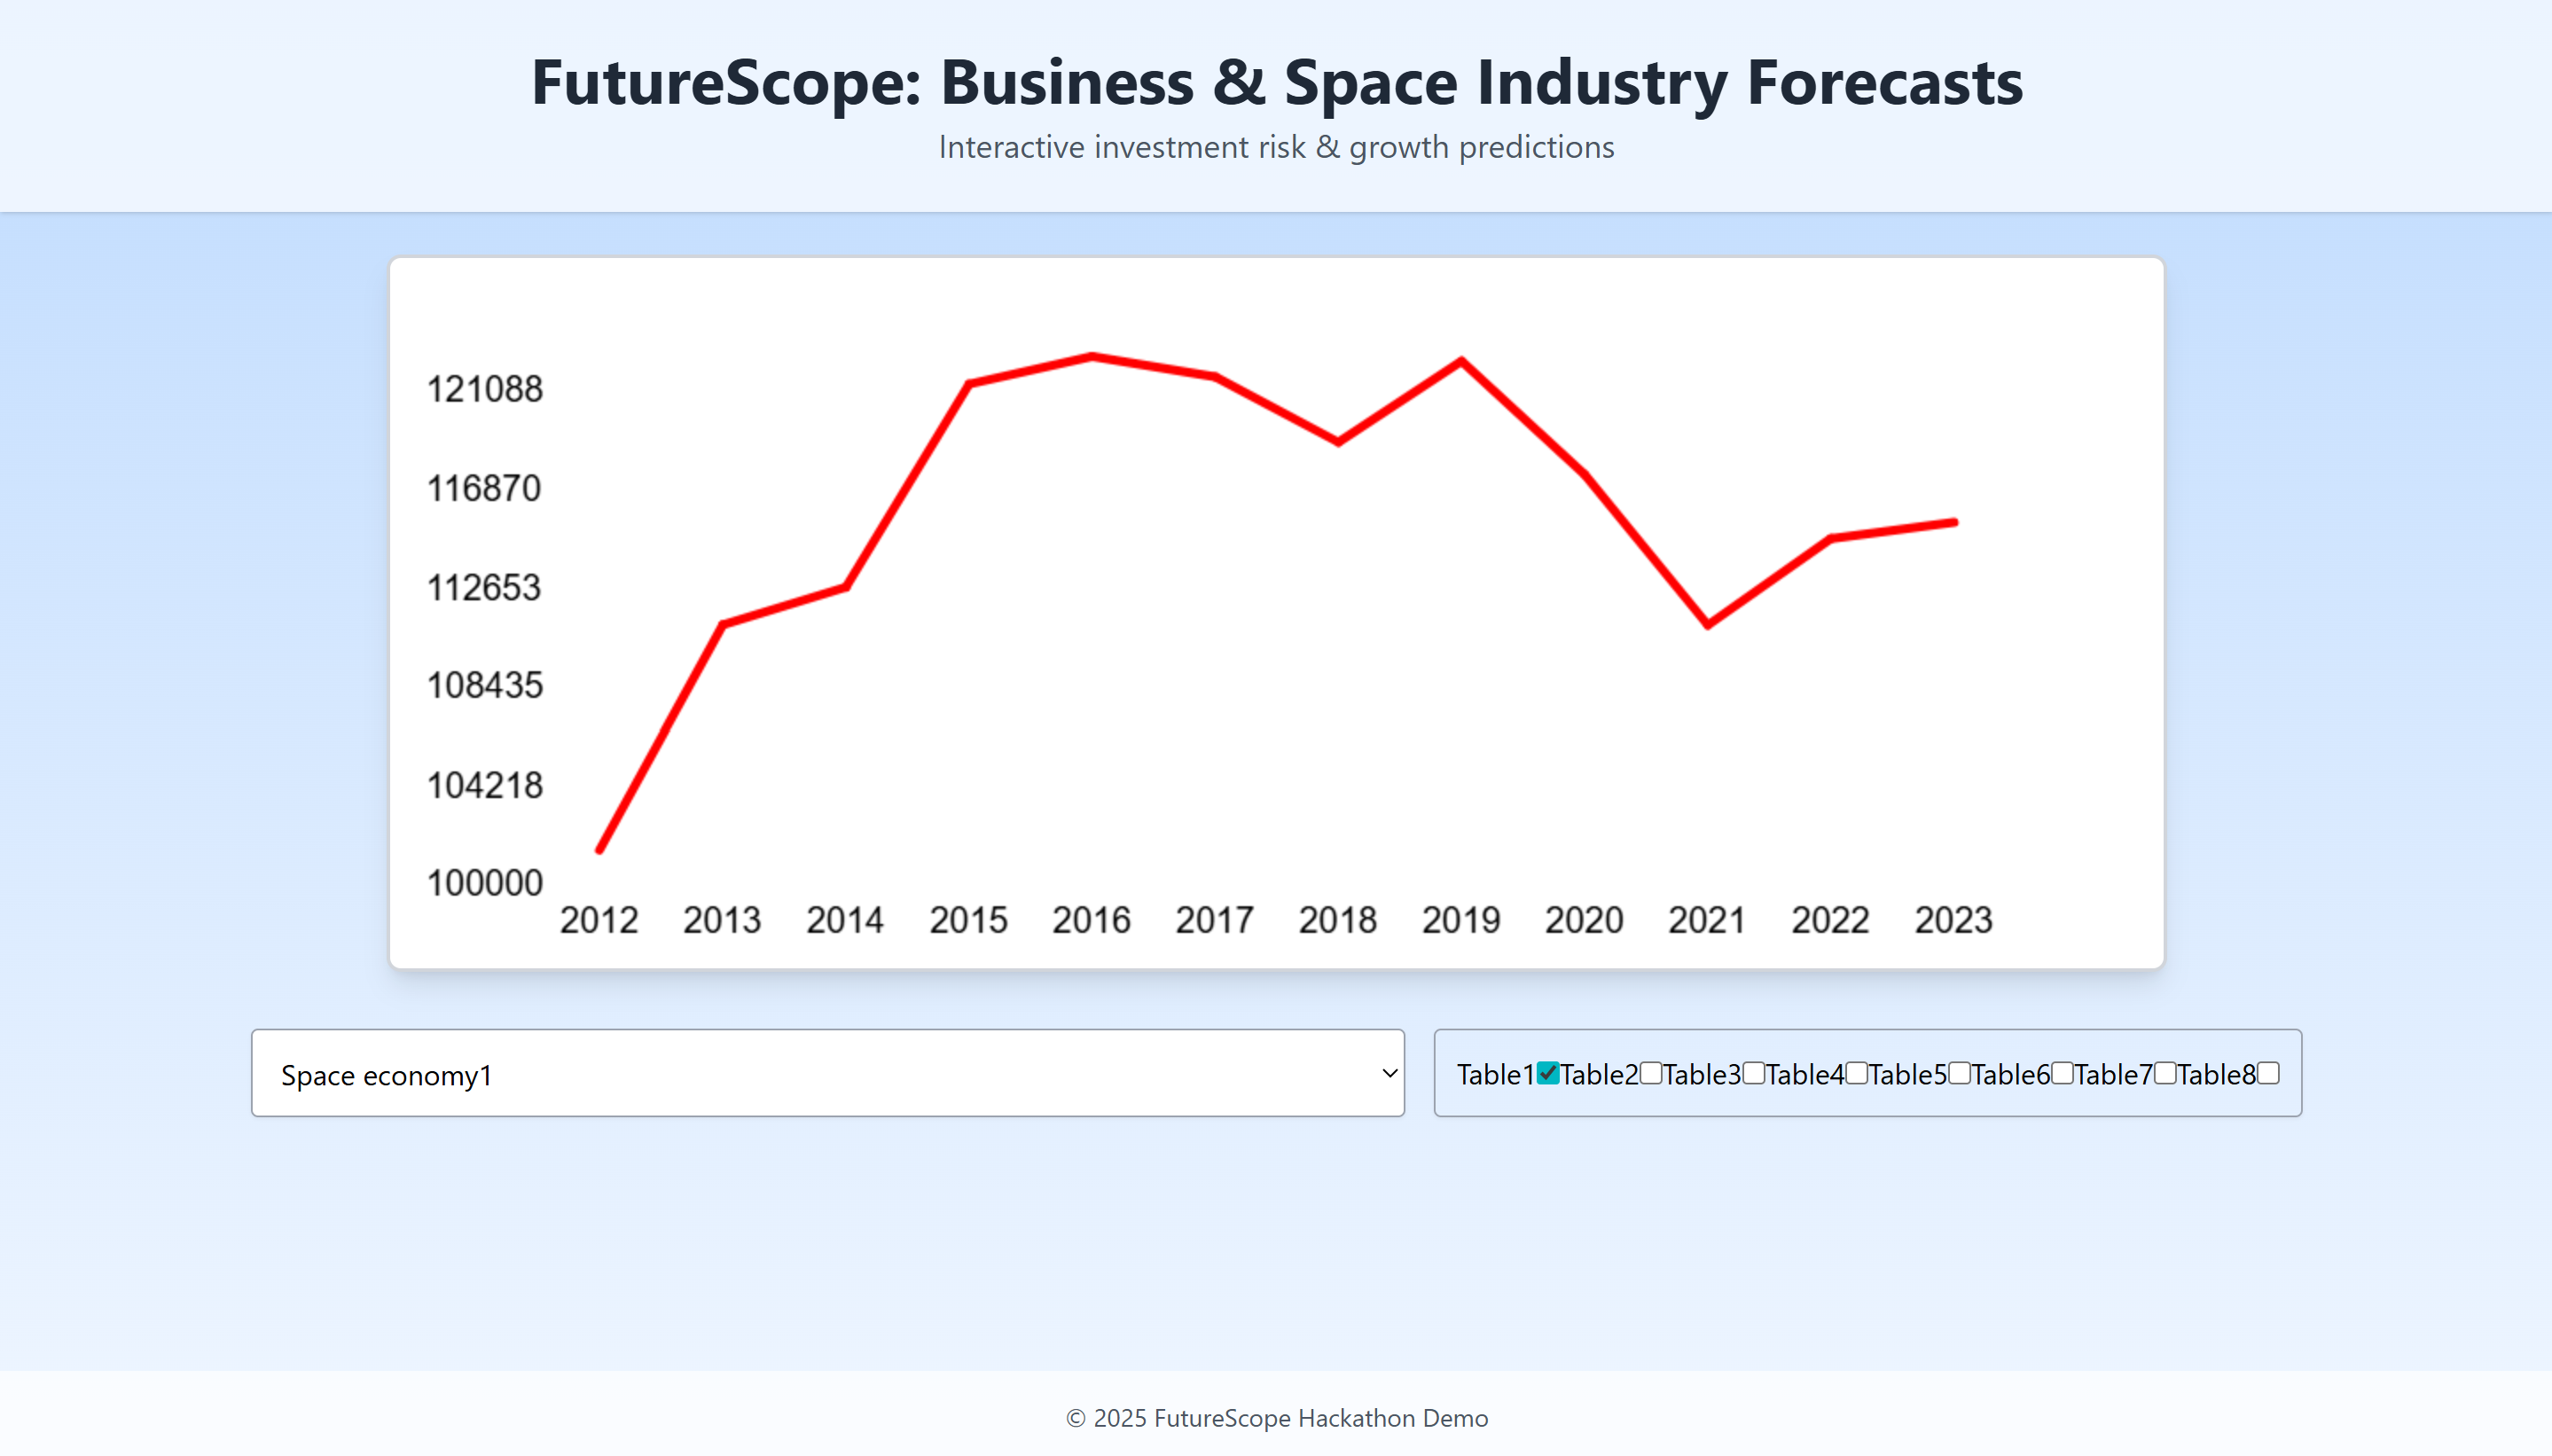
Example Graph on Website
-
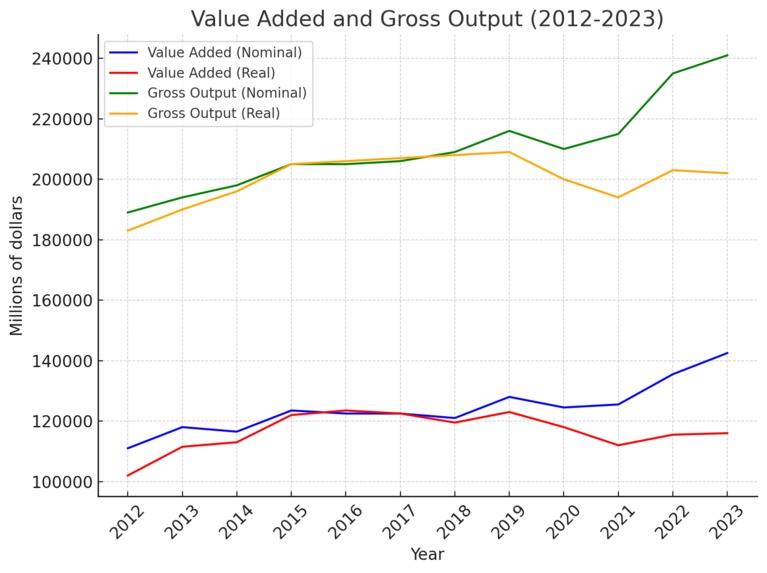
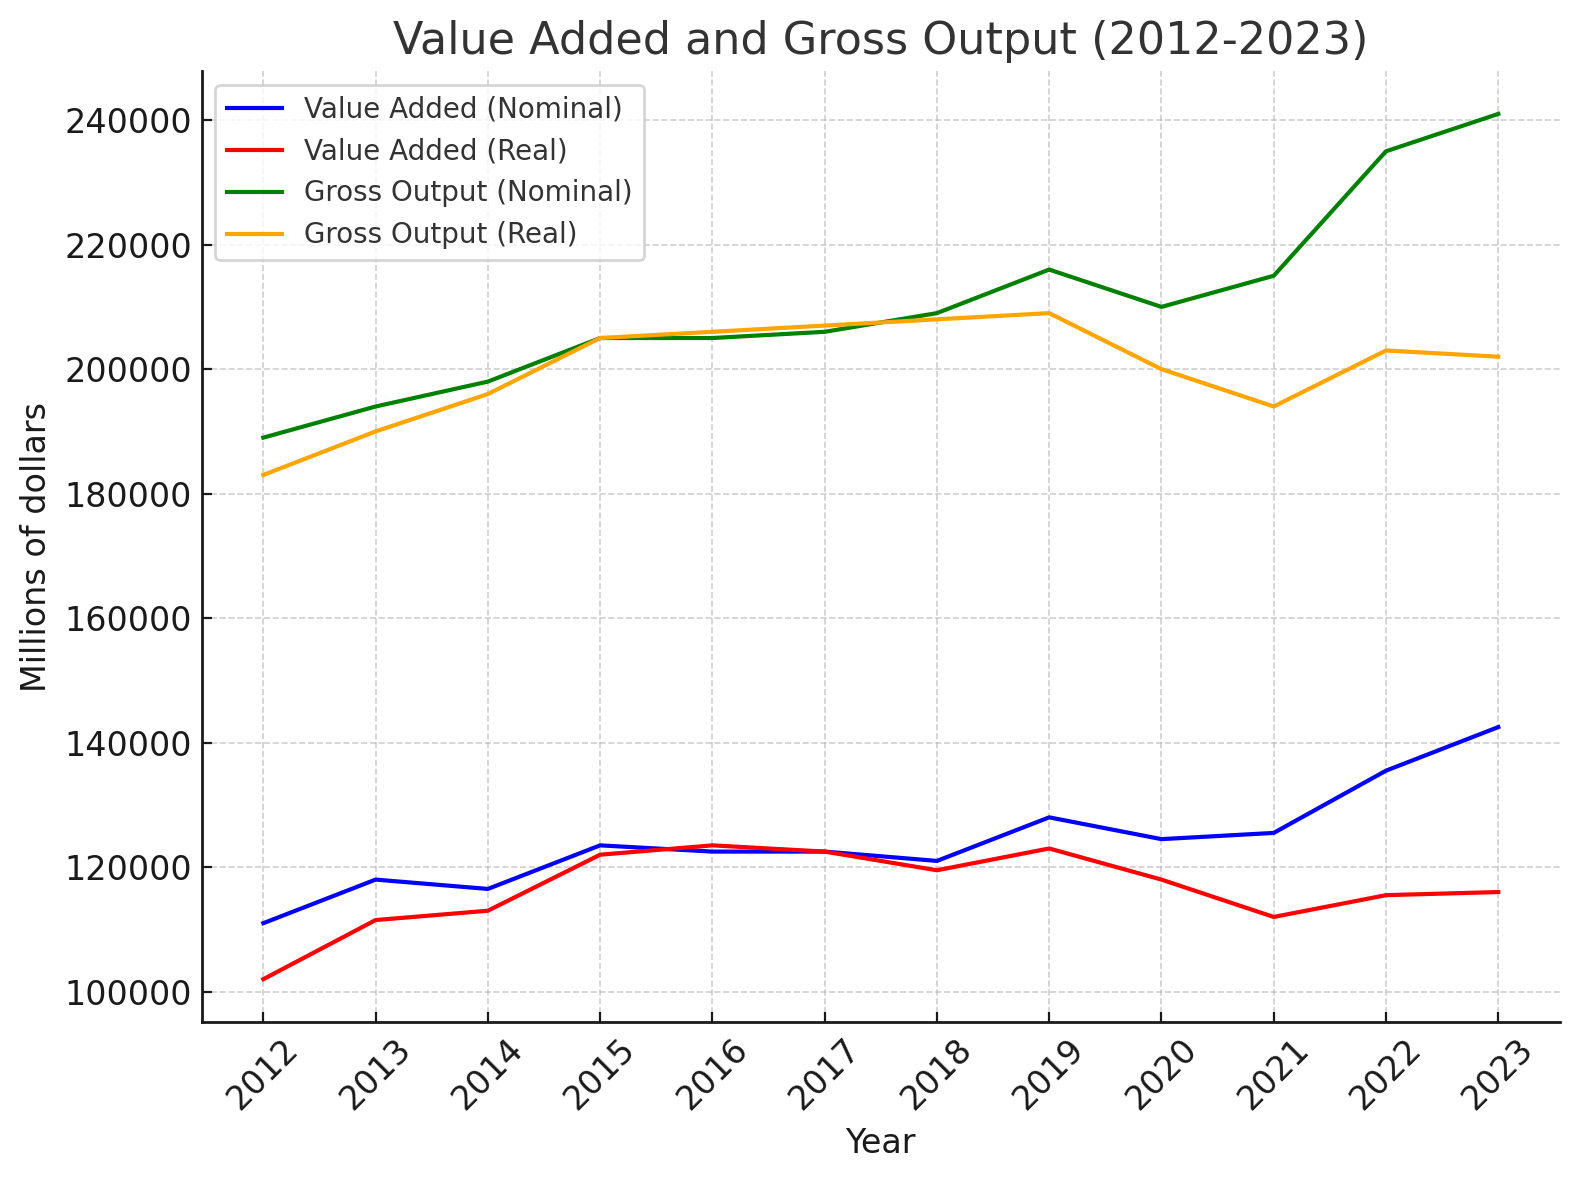
Space Economy value added & gross output line graph
-
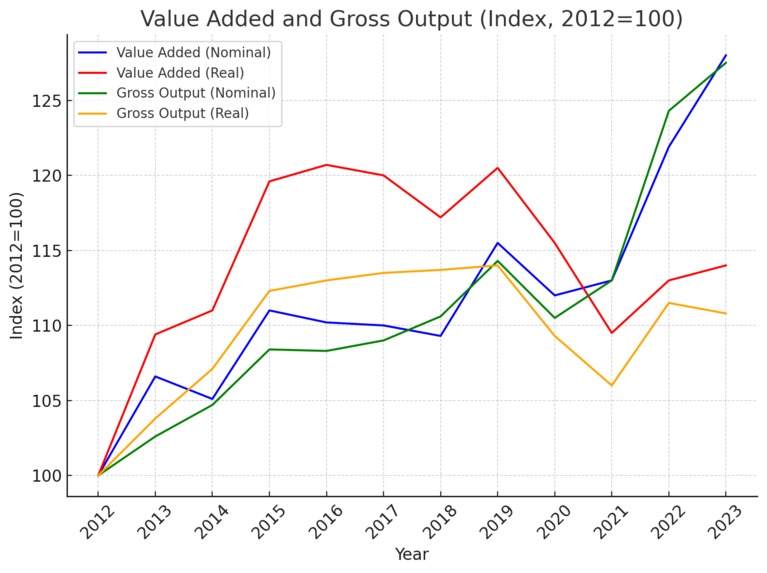
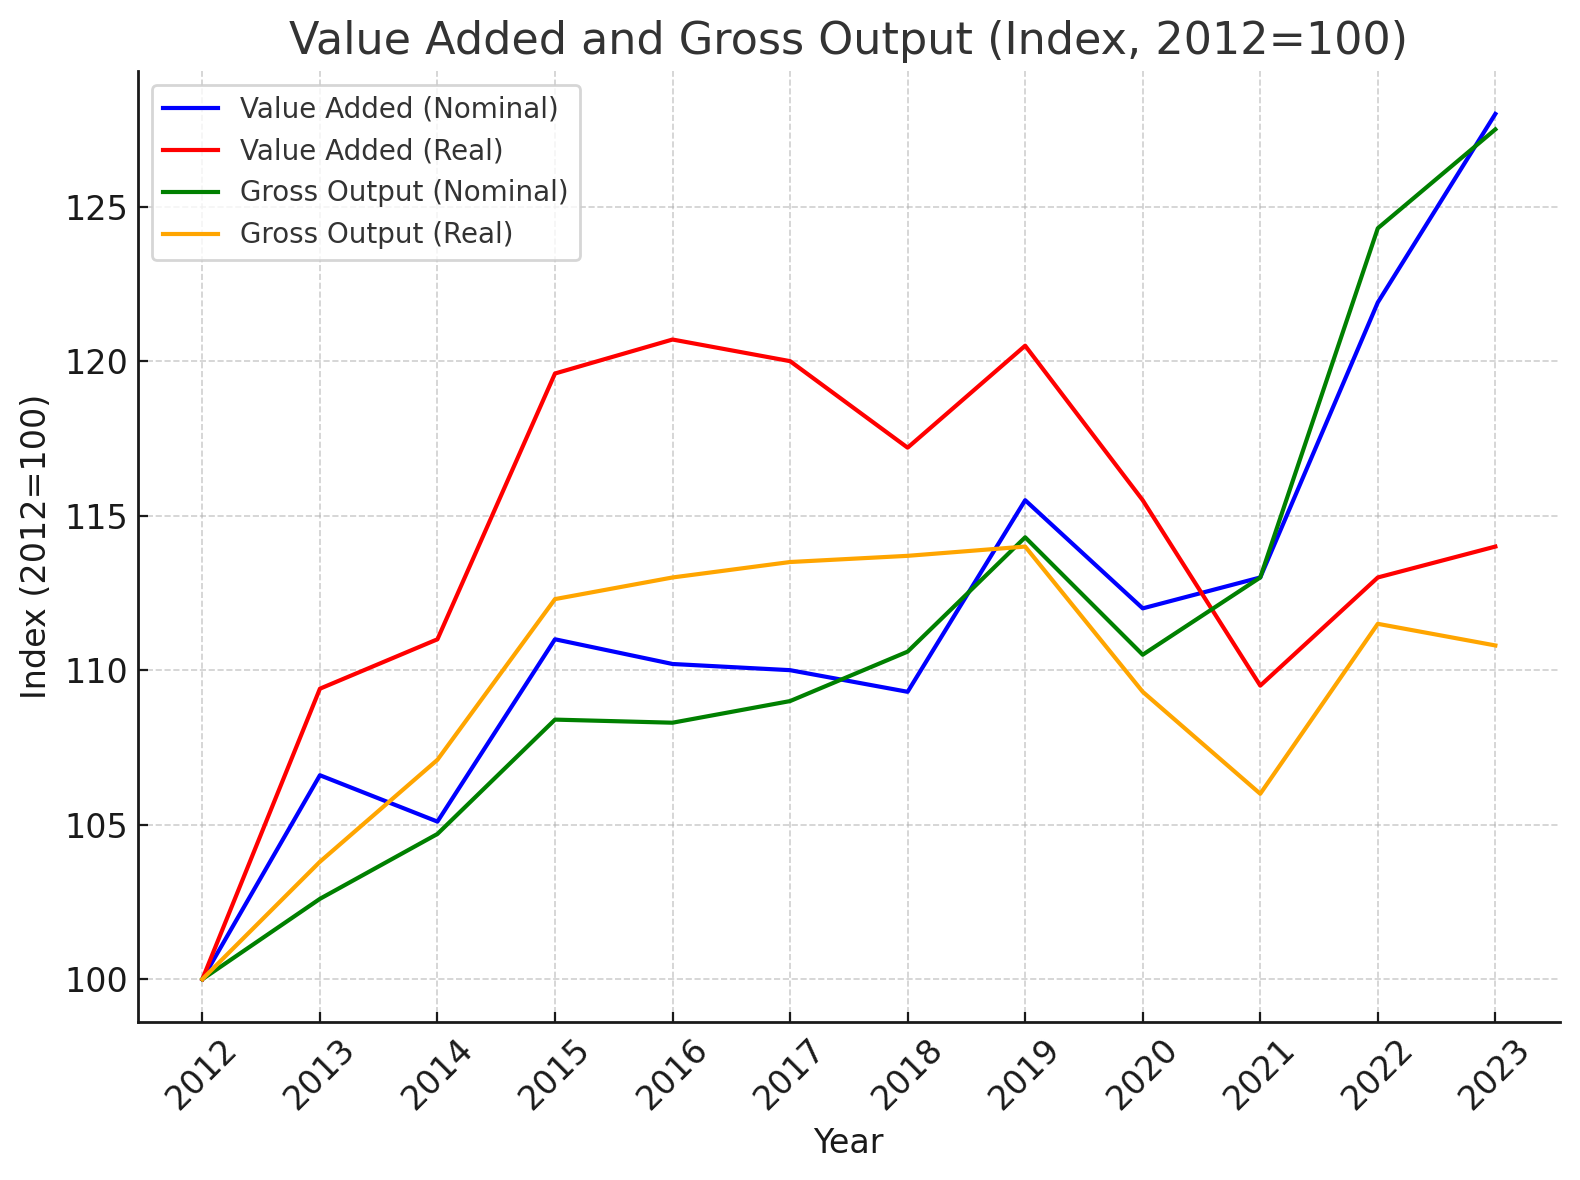
Space Economy value added & gross output index graph
-
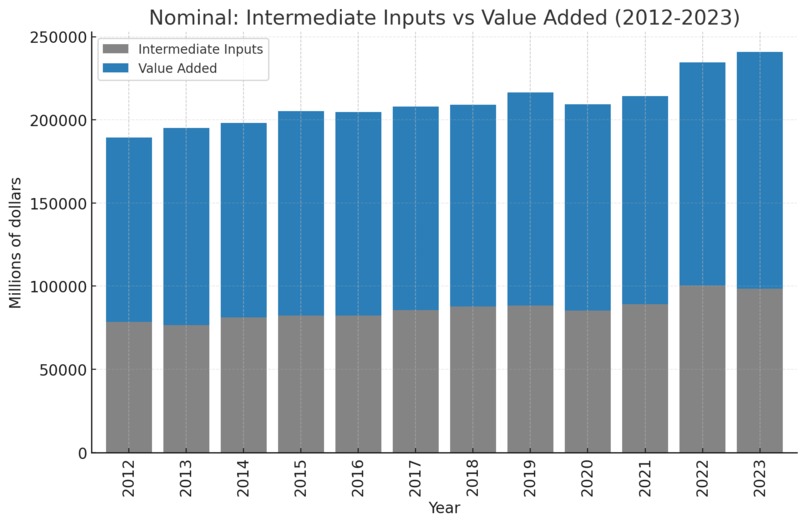
Space Economy nominal intermediate inputs
-
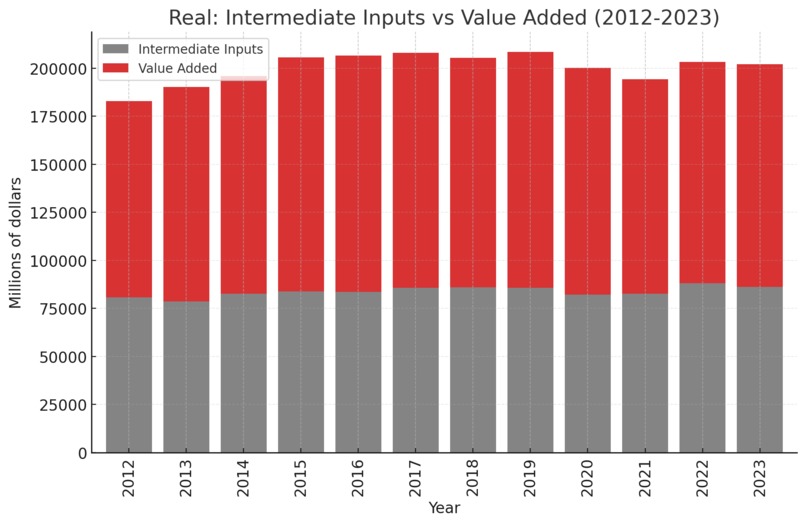
Space Economy real intermediate inputs
-
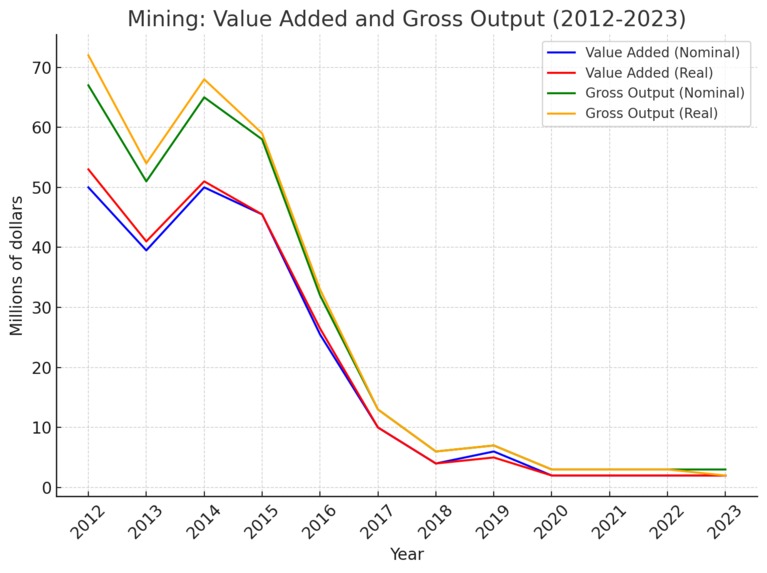
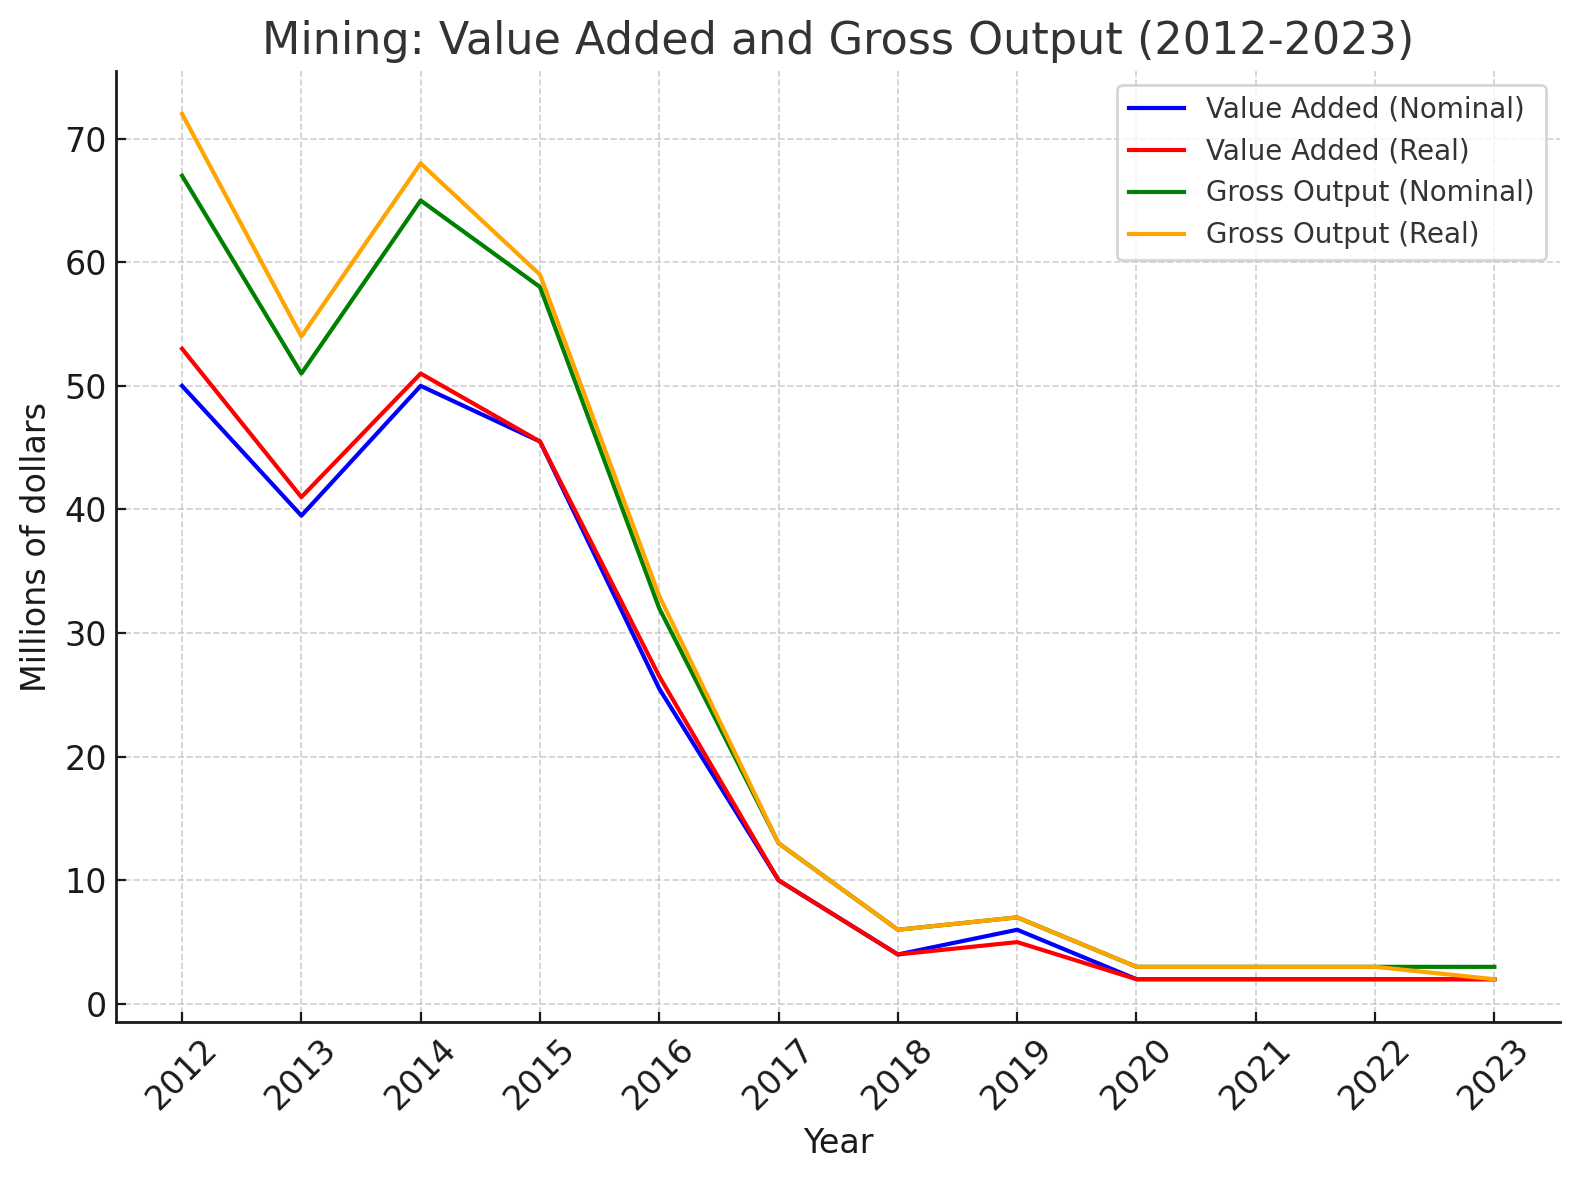
Mining Industry value added & gross output line graph
-
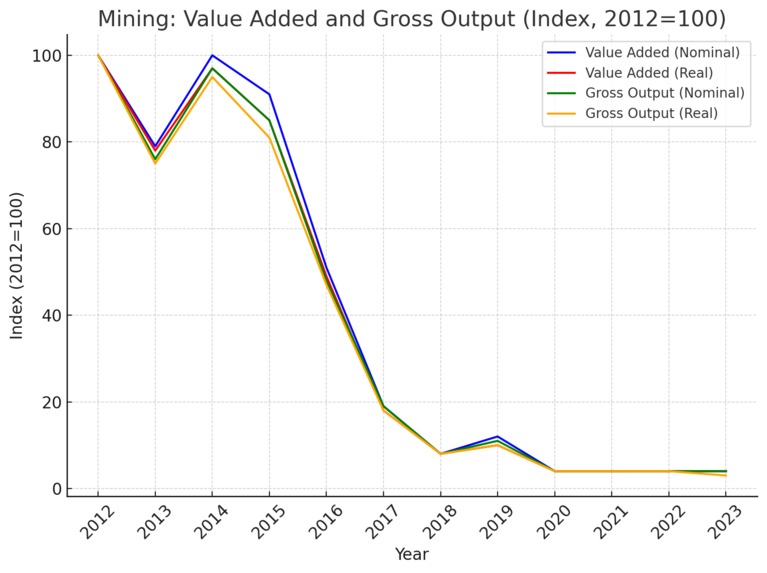
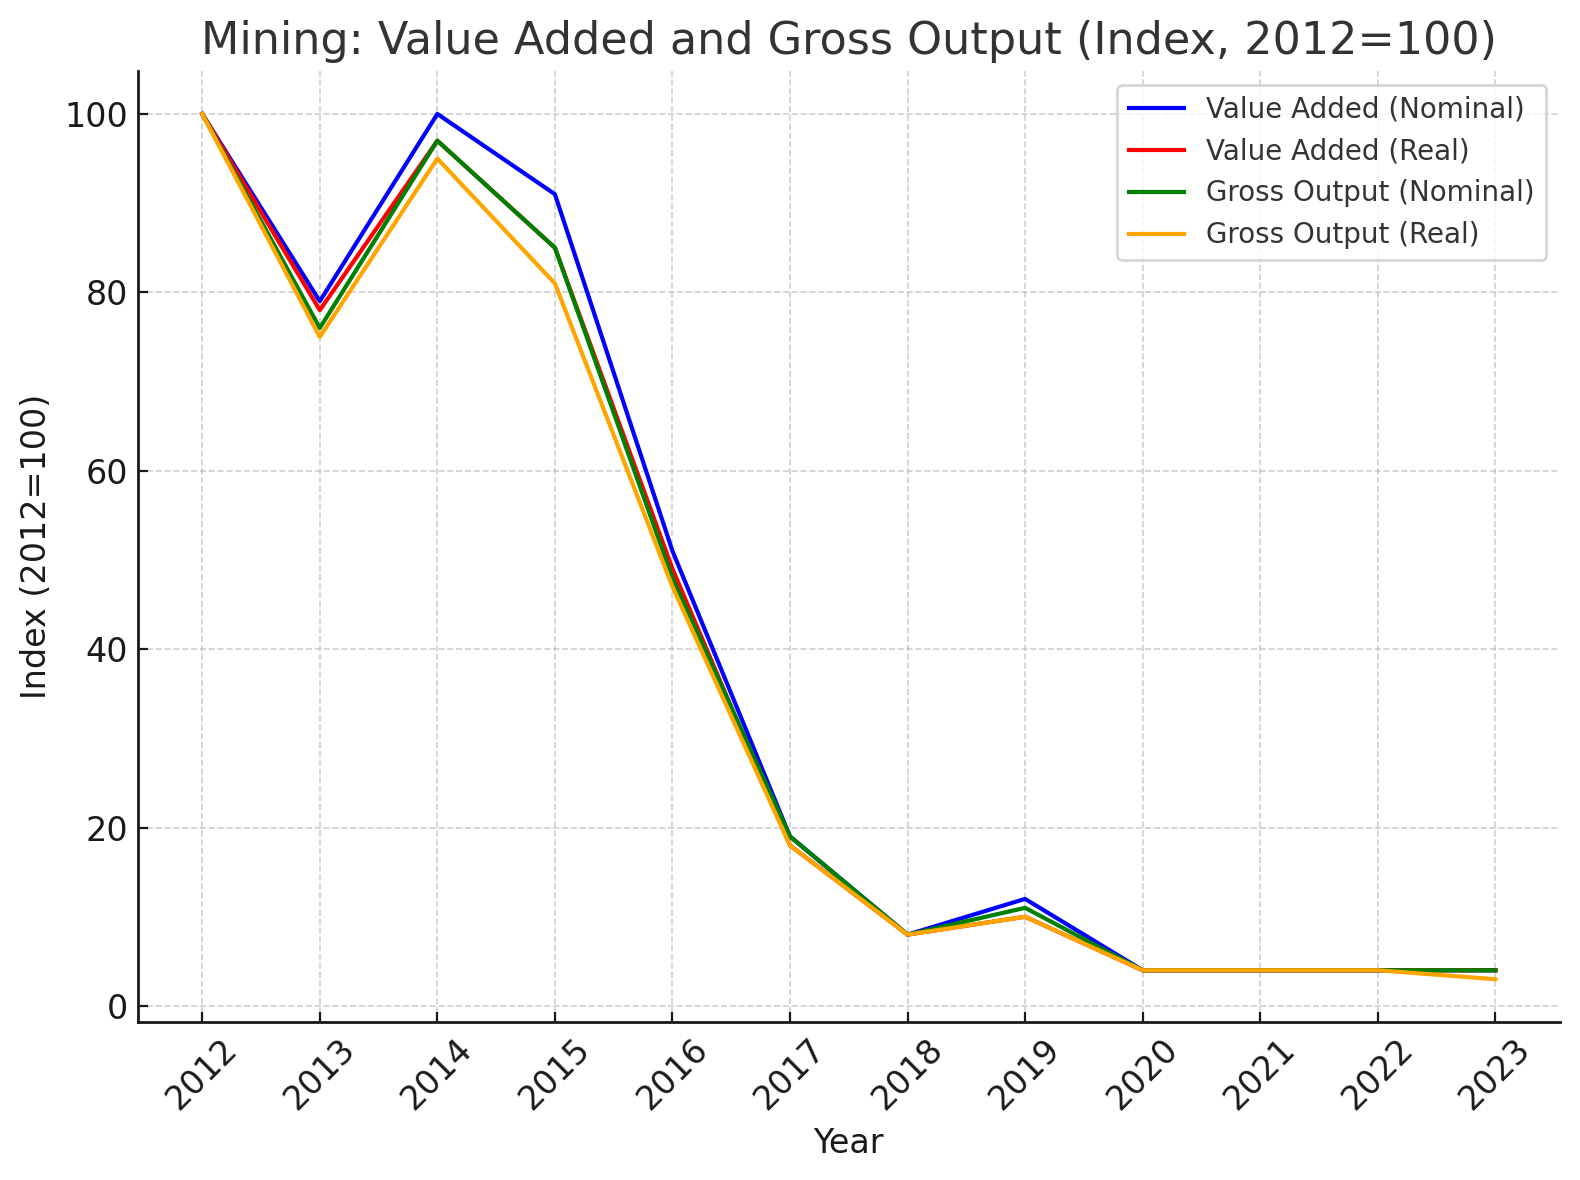
Mining Industry value added & gross output index graph
-
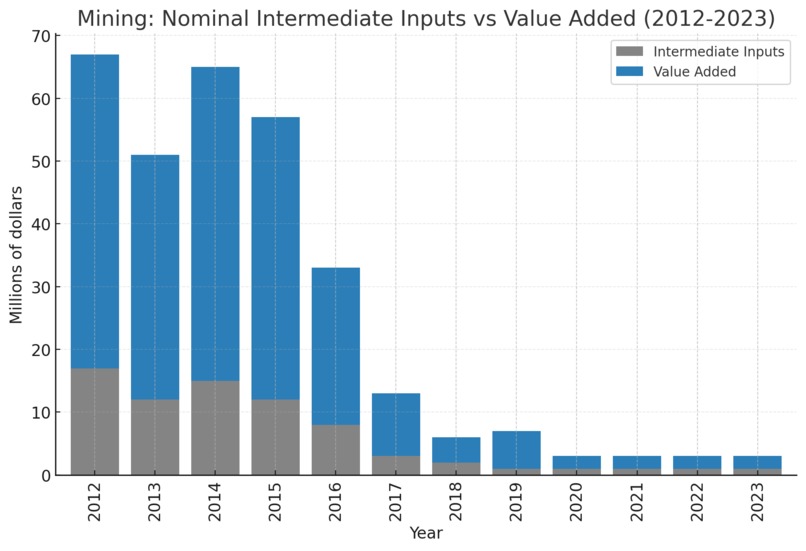
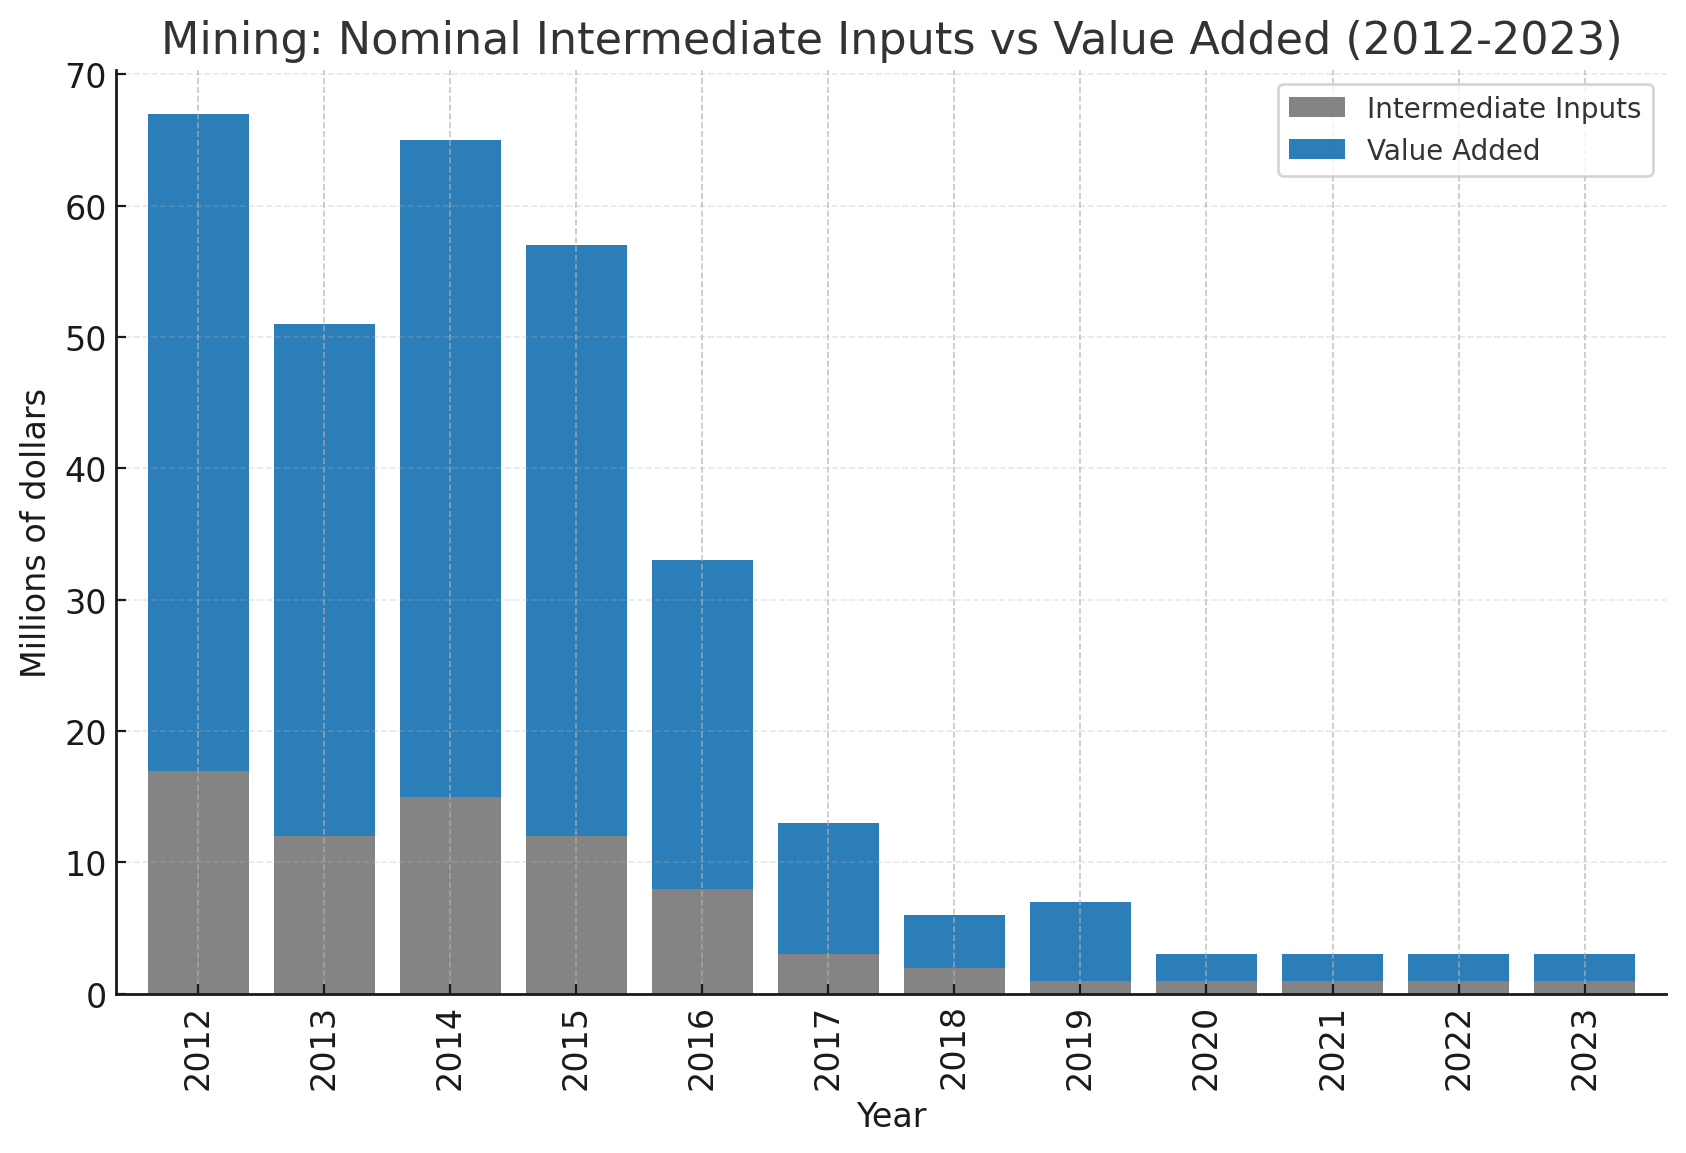
Mining Industry nominal intermediate inputs
-
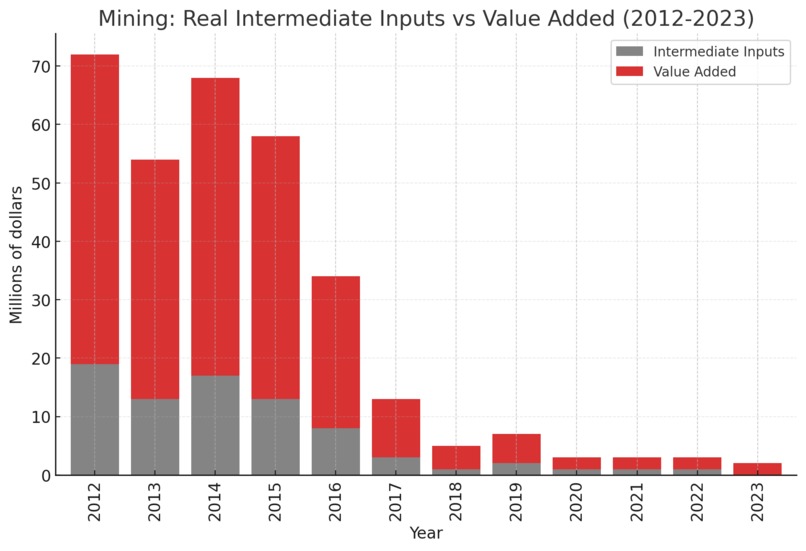
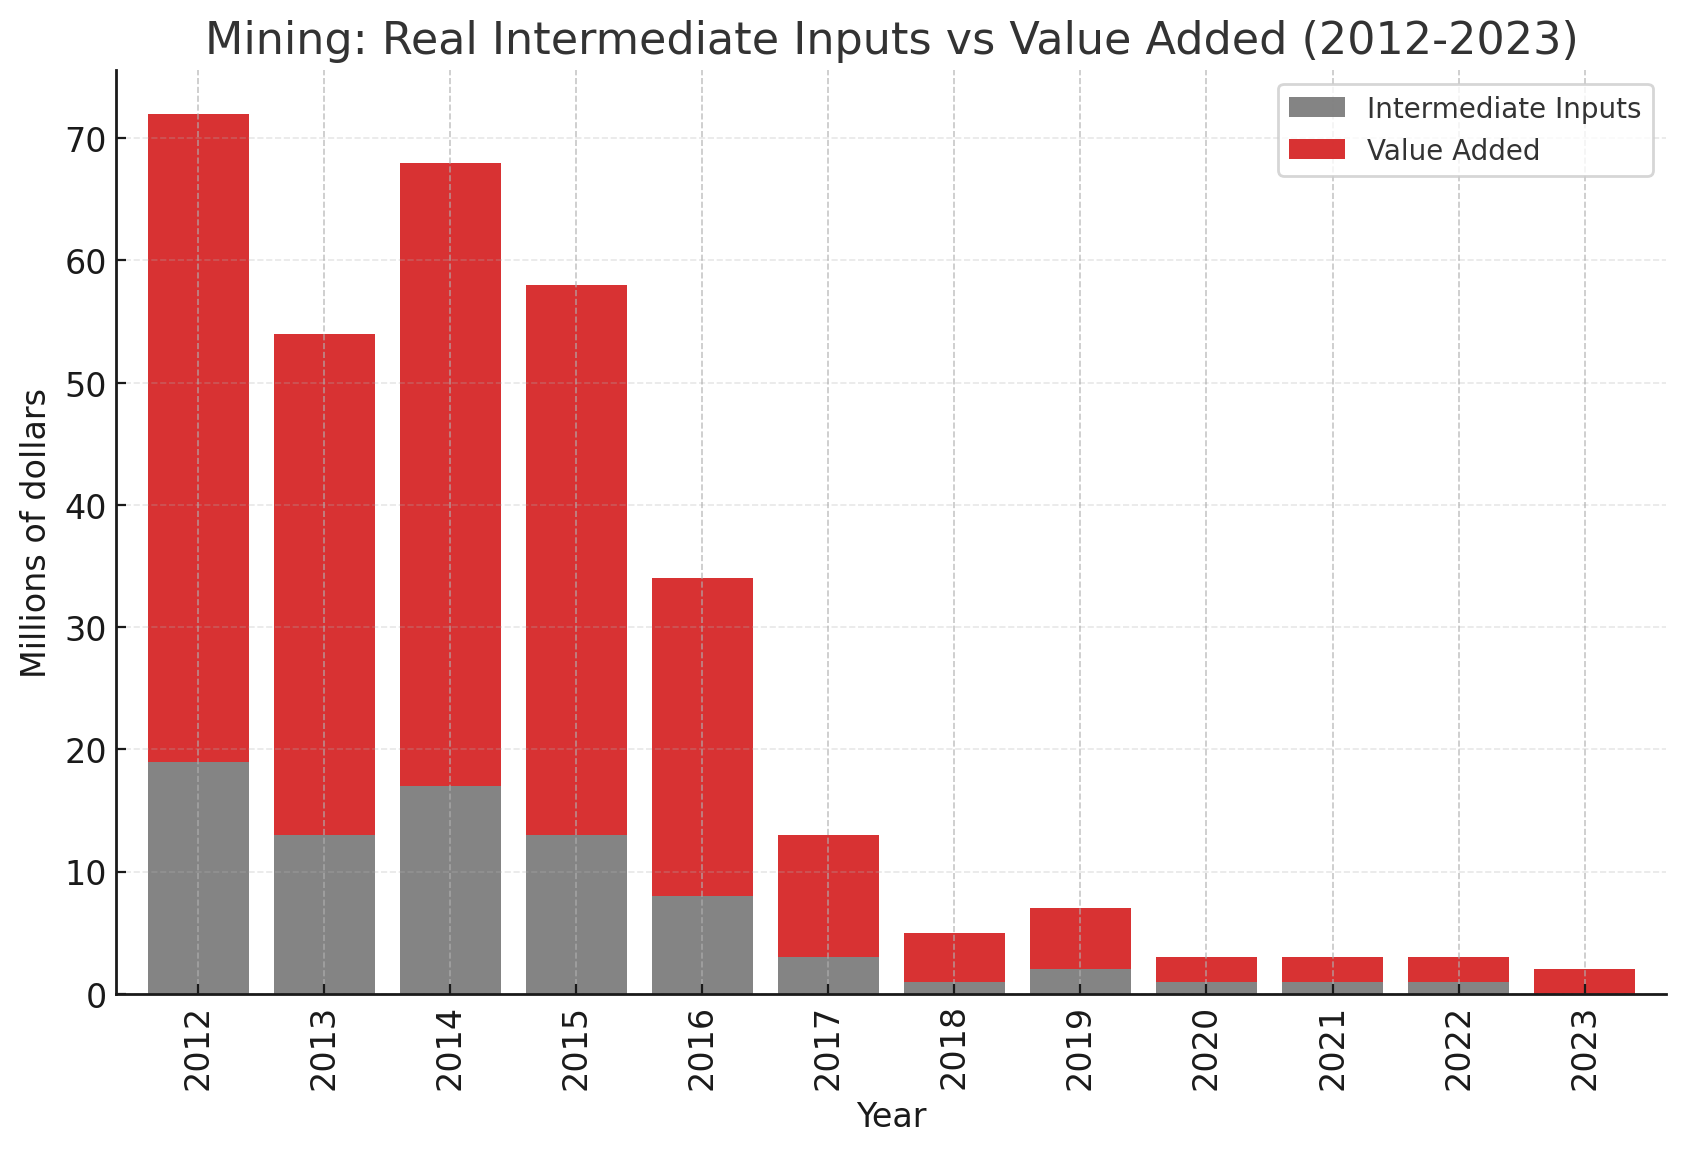
Mining Industry real intermediate inputs
-
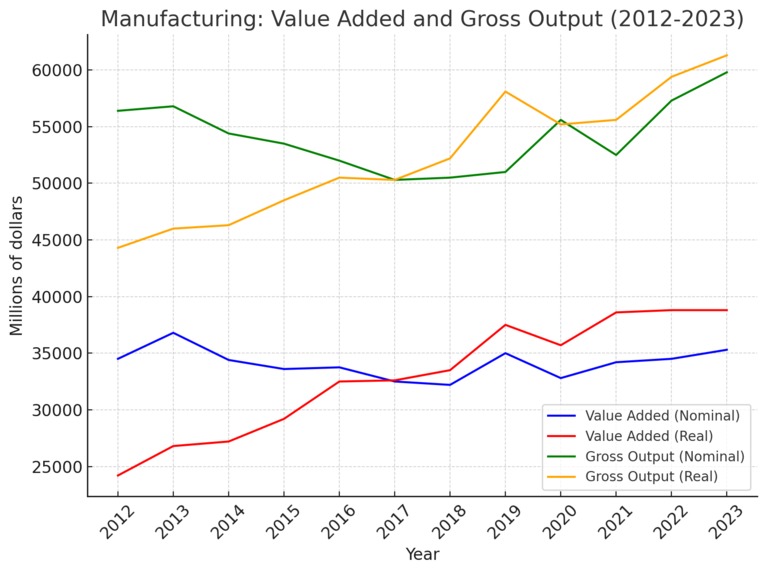
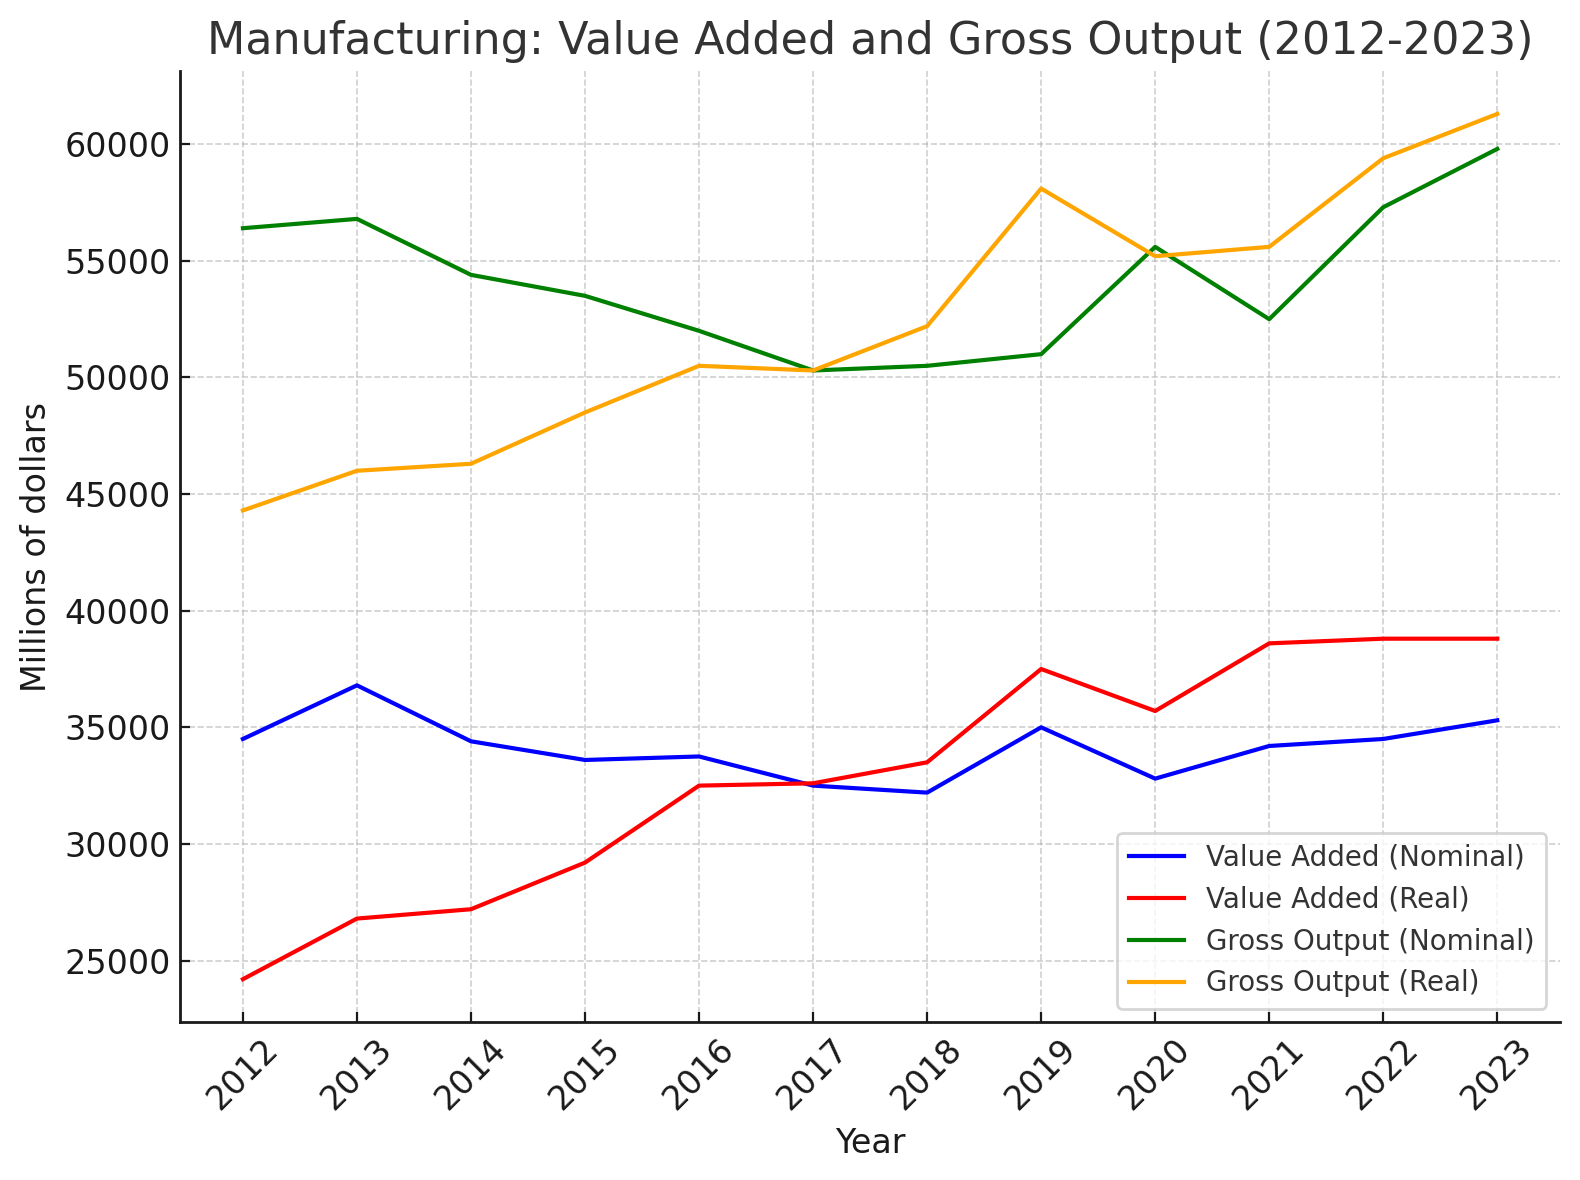
Manufacturing Industry value added & gross output line graph
-
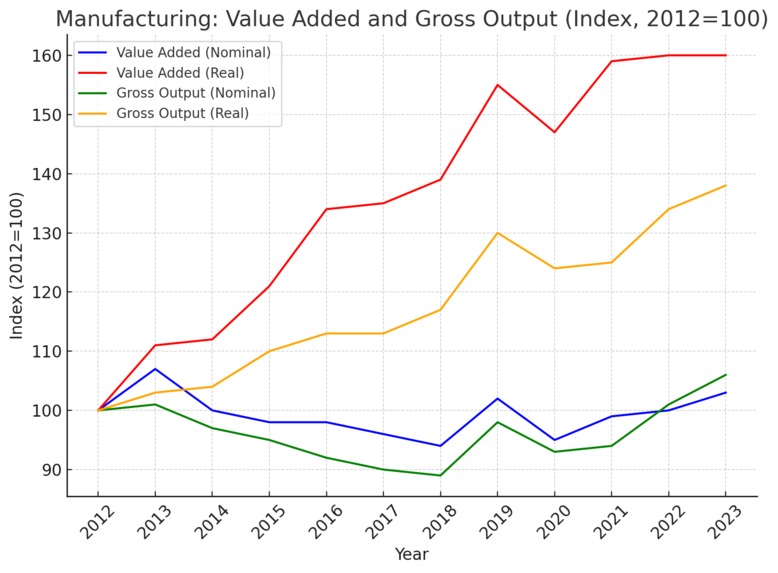
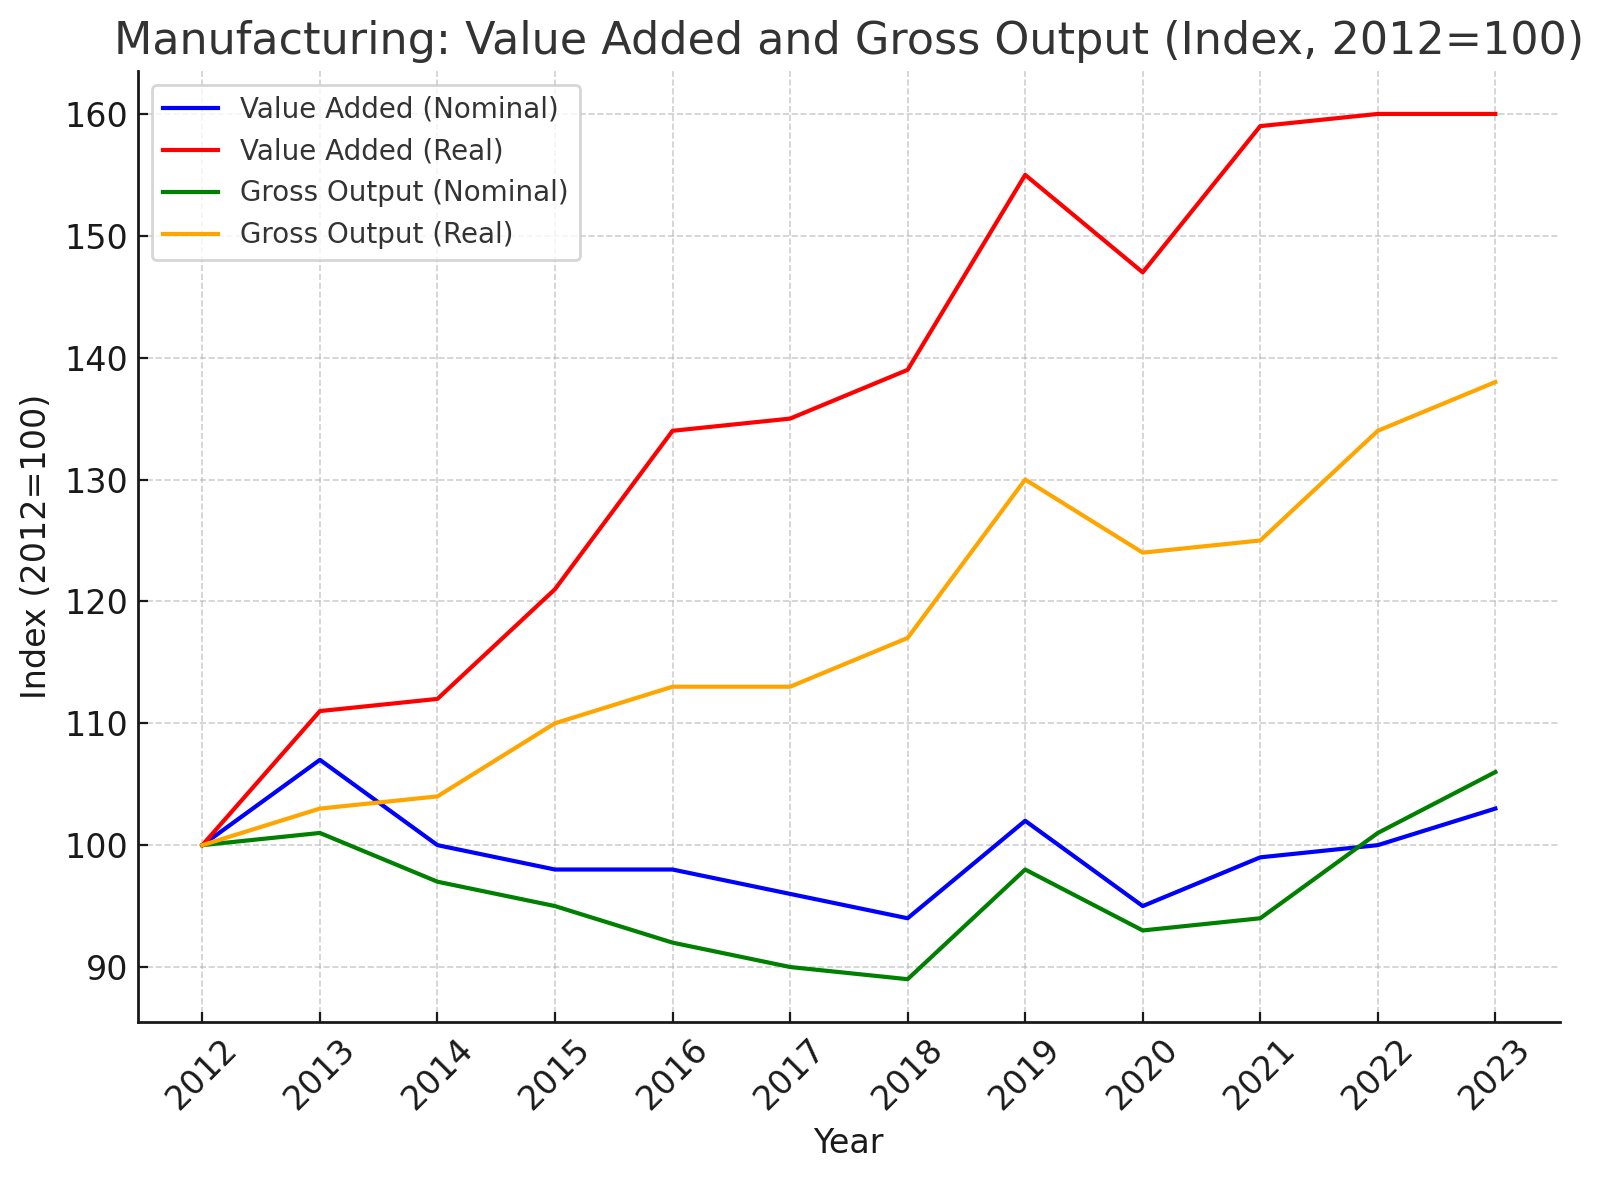
Manufacturing Industry value added & gross output index graph
-
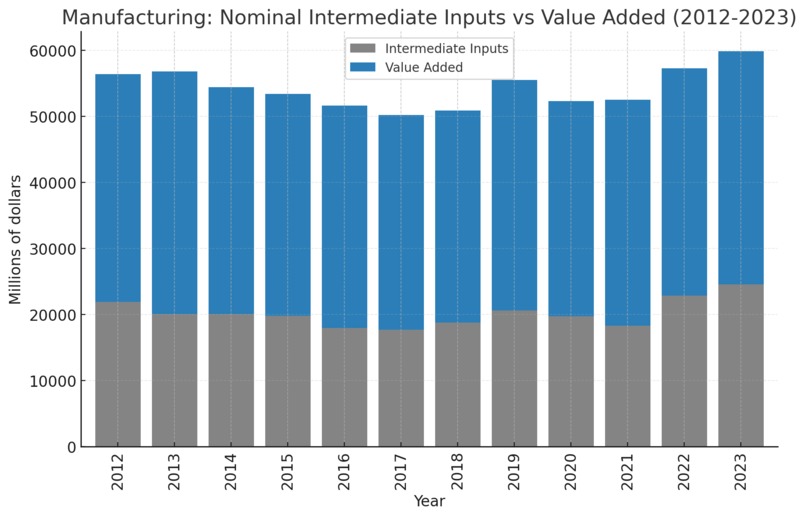
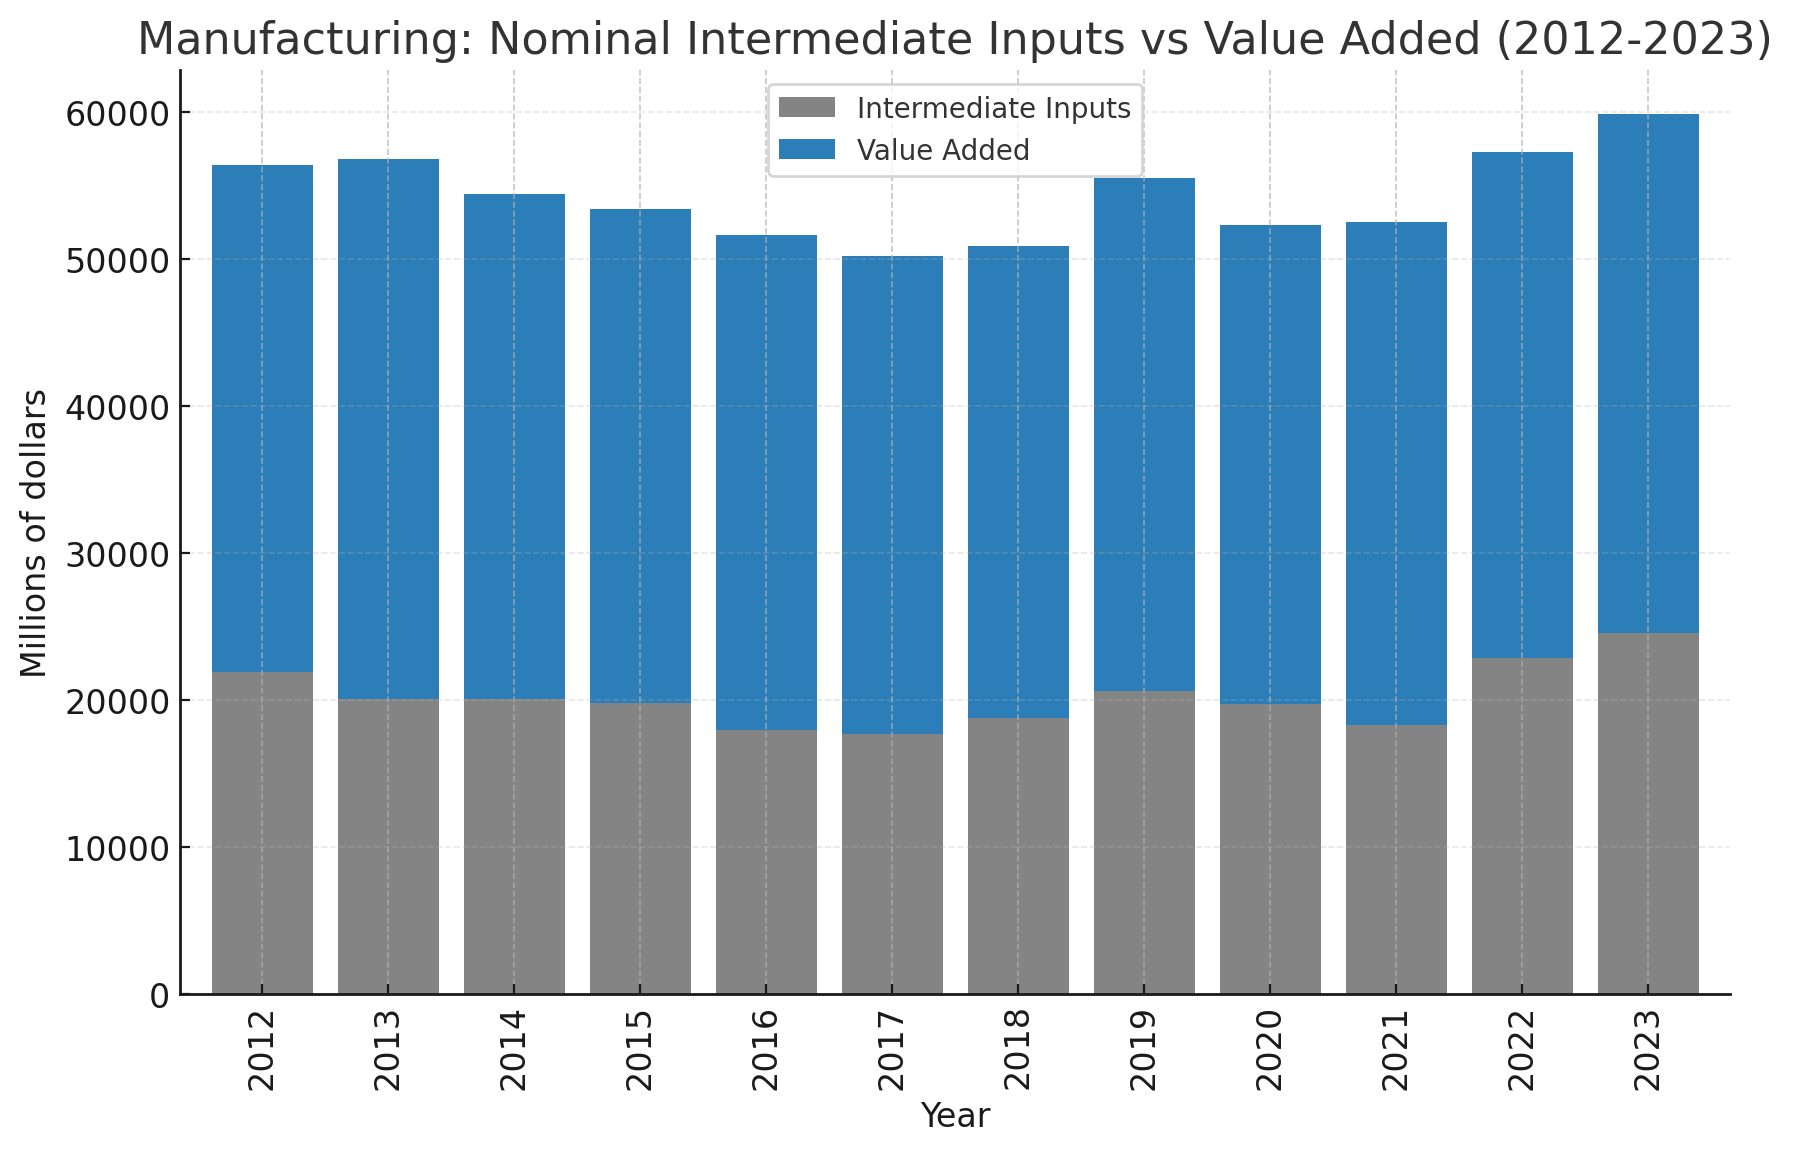
Manufacturing Industry nominal intermediate inputs
-
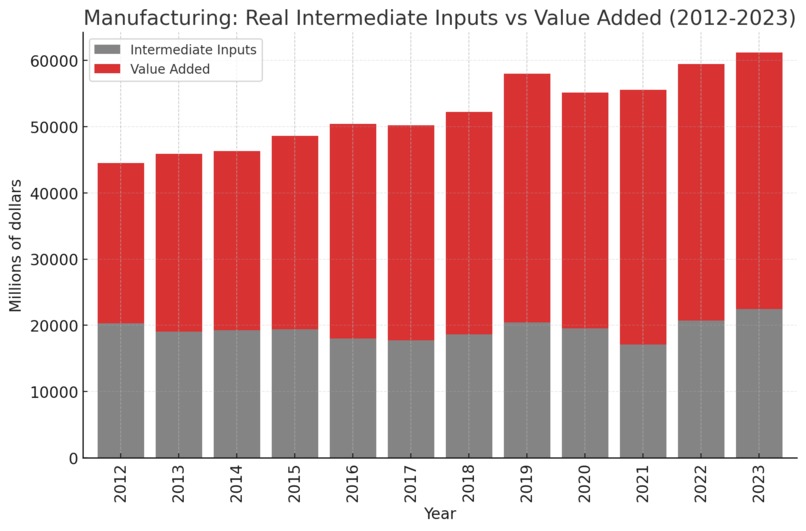
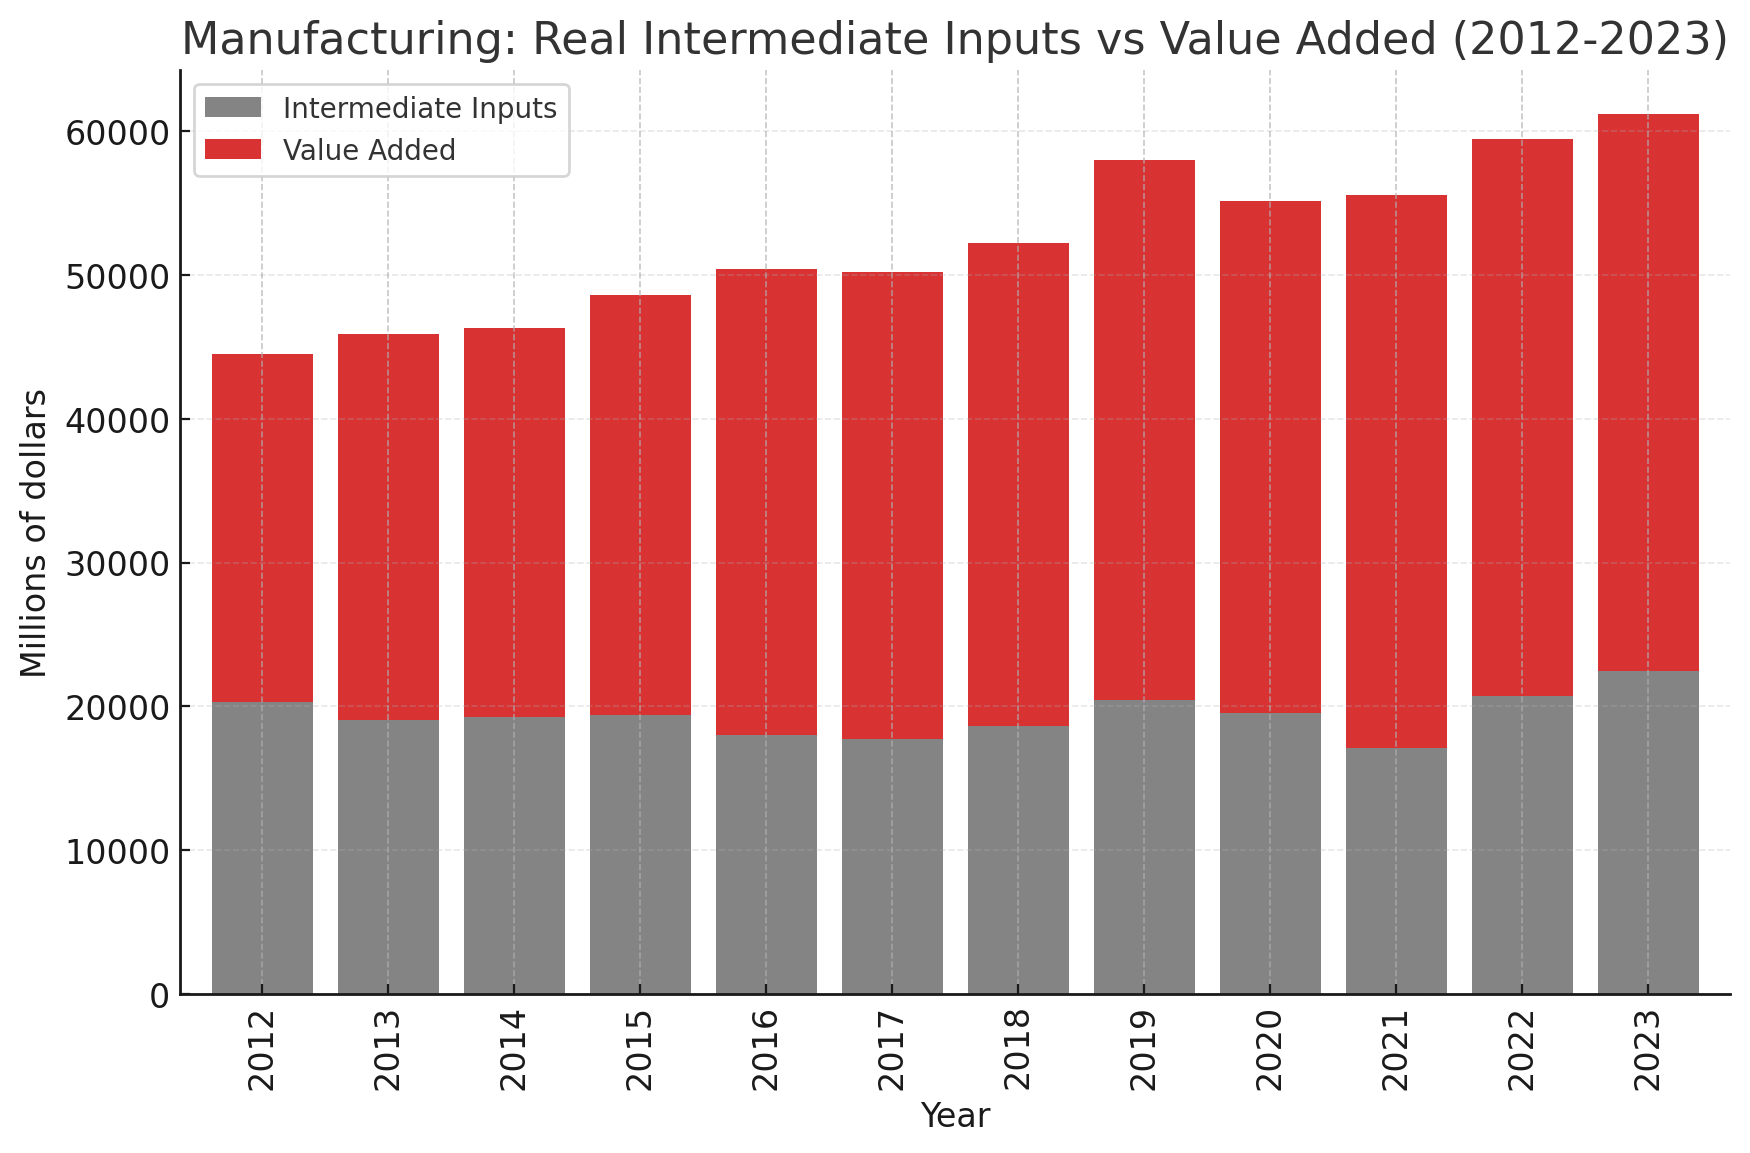
Manufacturing Industry real intermediate inputs
Inspiration
The datathon theme itself, Zero Gravity, inspired us to come up with the idea of things that look like they’re soaring but aren’t truly anchored in reality. With private space companies like SpaceX and Blue Origin making headlines, there’s a narrative of booming space investment. By using the BEA dataset, we wanted to fact-check that hype if it's real output growth or just nominal buzz.
What it does
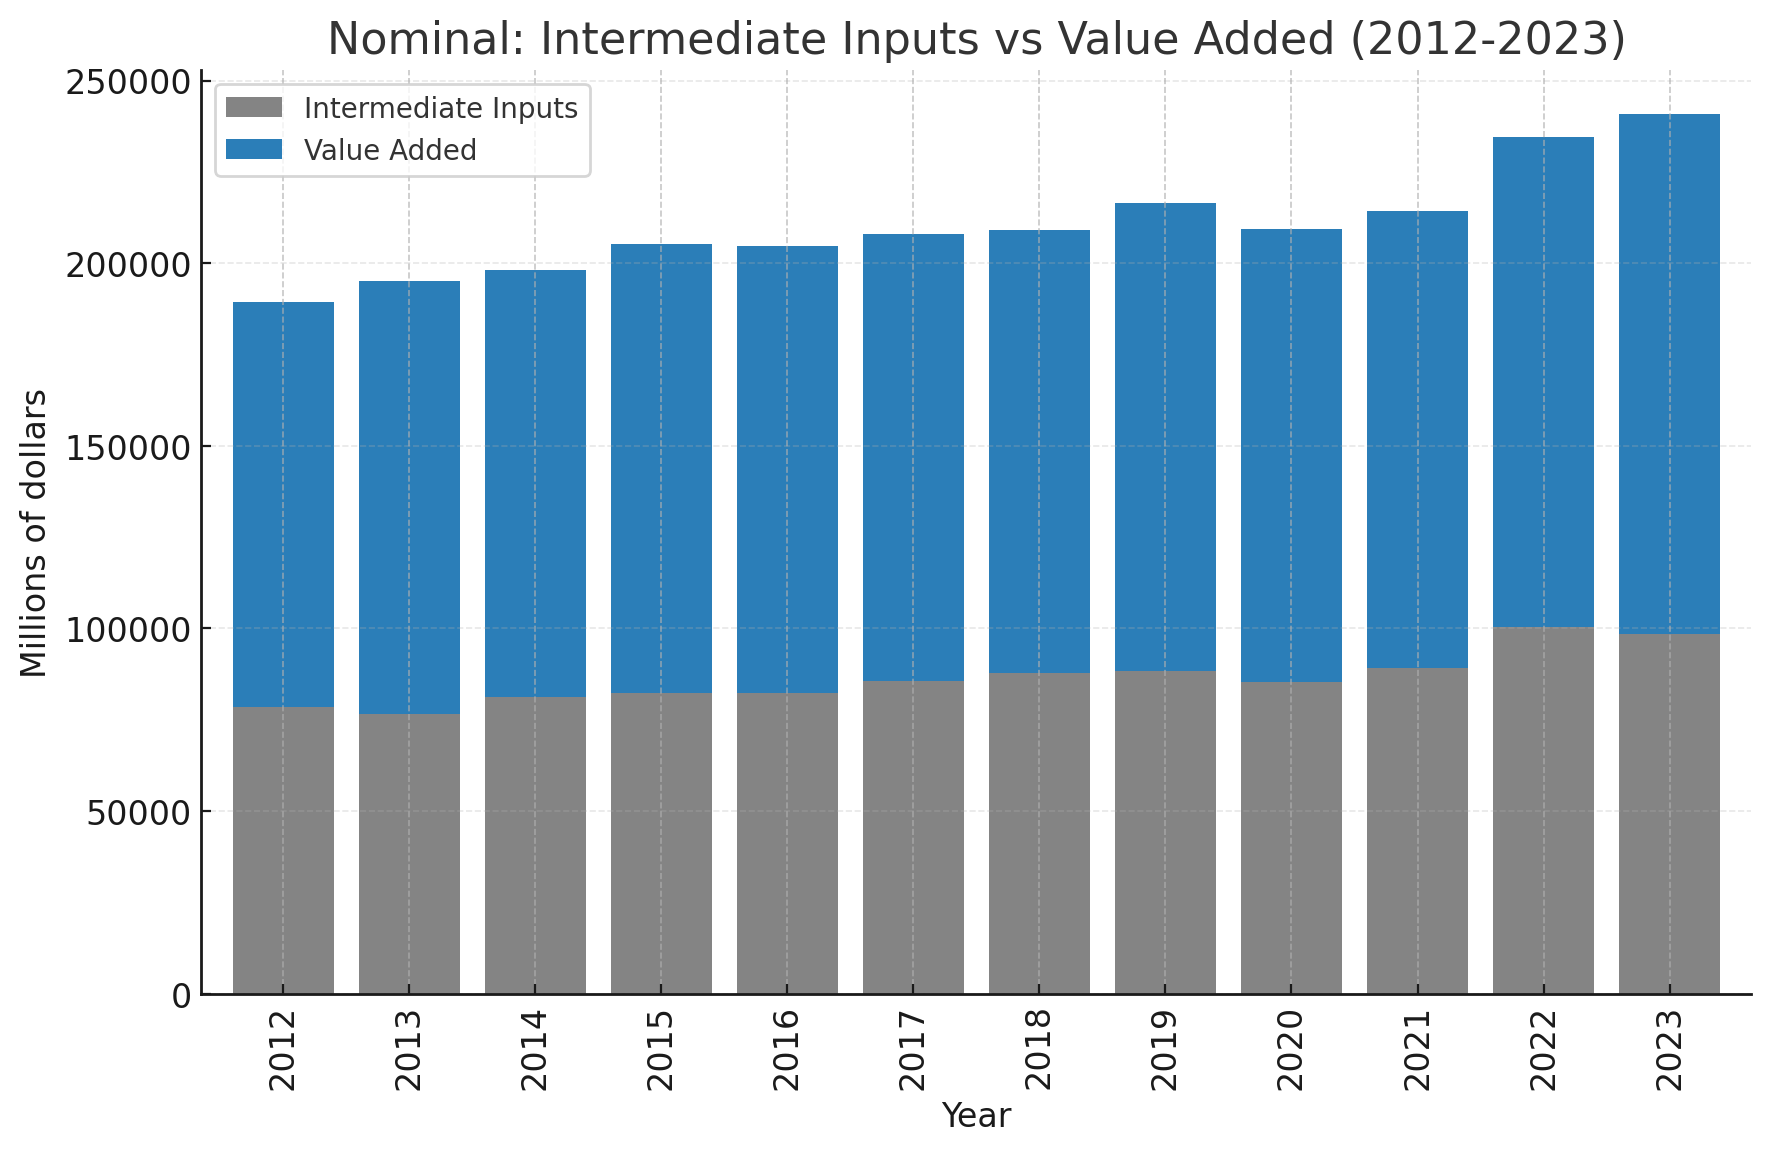
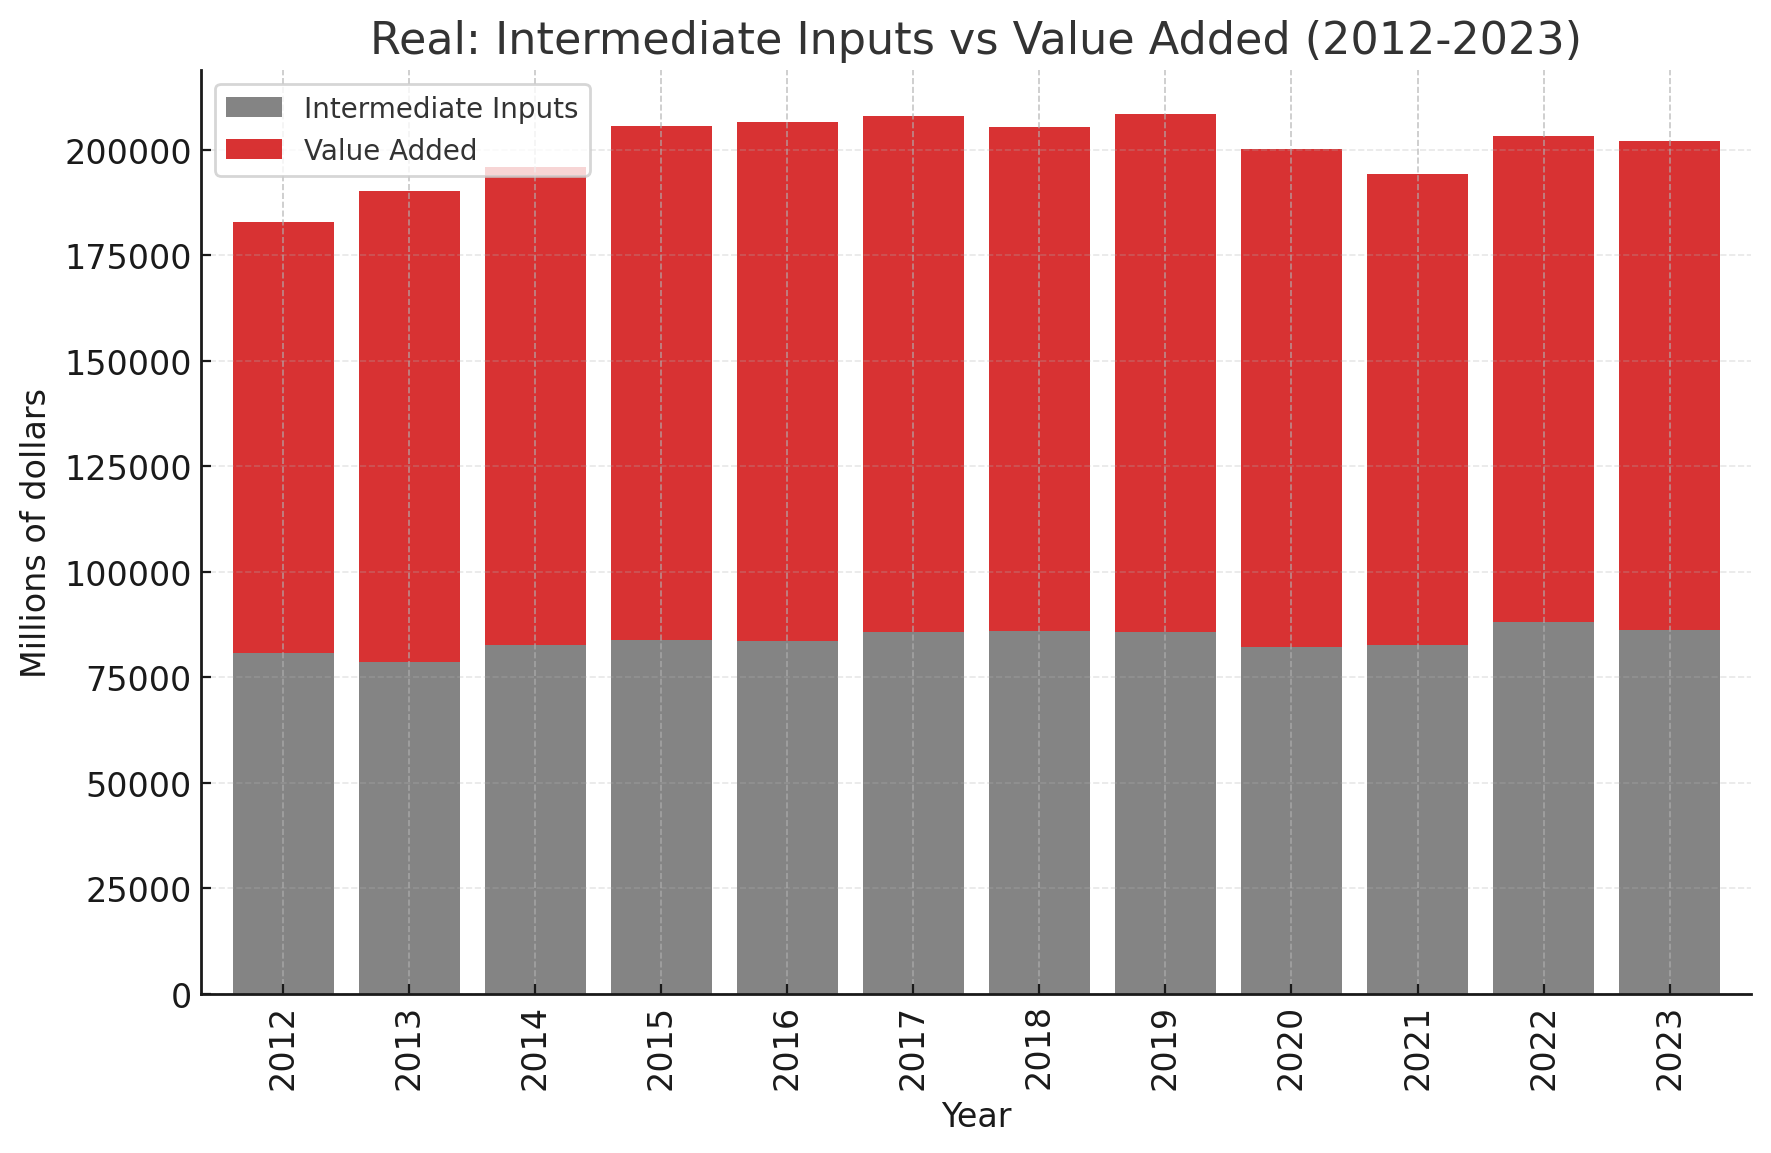
Our project analyzes BEA Space Economy data (2012–2023) to separate nominal growth from real growth and identify intermediate inputs to identify which industries generate true productivity and which ones rely mainly on cost inflation. We began with examining key industries through line graphs of nominal and real value added and gross output, along with bar charts of intermediate input vs nominal and real added value, to demonstrate how to interpret sector performance. Building on these examples, we developed interactive visualizations that cover all industries in the dataset. The platform highlights industries such as manufacturing which showed sustained real growth, while also revealing sectors such as mining that have collapsed into dependency or stagnation.
How we built it
- Data: Bureau of Economic Analysis (BEA) Space Economy Satellite Accounts, Tables 1–5.
- Processing: Cleaned and compared nominal vs real metrics; calculated intermediate inputs as $$ \text{Inputs} = \text{Gross Output} - \text{Value Added} $$
- Visualization: Line graphs for nominal and real value added and nominal and real gross output (Tables 1, 2, 4, 5); bar charts for intermediate input vs nominal added value, intermediate input vs real added value.
- Integration: Packaged everything into a responsive, interactive website for users to toggle industries and compare nominal vs real growth to guide smarter policy and investment decisions.
Challenges we ran into
- Developing the linear regression models because the data needed to be sorted in a way that python could create the linear regression model for each industry in a loop.
- Implementing the predictive analysis model into our project, which was an intended feature.
Accomplishments that we're proud of
- Building a working interactive platform that transforms dense federal economic data into an accessible tool for policymakers, investors, and researchers.
- Creating visualizations that judges and general audiences can immediately interpret without needing advanced economics training.
- Demonstrating a clear thematic fit: “weightless growth” as the illusion of nominal expansion versus the gravity of real productivity.
What we learned
- Data Science: How to clean and visualize time-series data and transform raw datasets into meaningful comparisons.
- Computer Science: How to parse Excel data into JSON and use Python to build and automate linear regression models instead of generating them manually.
- Economics: Distinction between nominal and real growth, and how intermediate inputs shape the sustainability of industries.
- Communication & Strategy: How to craft a cohesive narrative from quantitative evidence and connect technical analysis to strategic insights.
What's next for Identifying Weightless Growth in the Space Economy
- Expand our model to other national accounts (e.g., energy, health, or tech sectors) to uncover similar inflation illusions
- Explore policy simulation modules, where users can test scenarios like changing subsidies or tariffs and see the impact on real vs. nominal growth
Built With
- html/css
- javascript
- matplotlib
- python
- tableau


Log in or sign up for Devpost to join the conversation.