Inspiration Every engineer on our team has lost hours staring at a failed CI pipeline at 2 AM, scrolling through logs trying to find the one thing that broke. The frustrating part isn't the failure - it's that the same failures keep happening, and every time feels like the first time.
We started asking: what if the tool that diagnoses your CI failures could remember every diagnosis it made, measure whether it was right, and get better over time? That question became TraceFix.
The Arize track made this the perfect hackathon to build it. Arize Phoenix is built for observing, evaluating, and improving AI systems, and we wanted to push that loop as far as it could go.
What it does TraceFix is a self-improving CI/CD failure analyst agent. When your GitHub Actions pipeline fails:
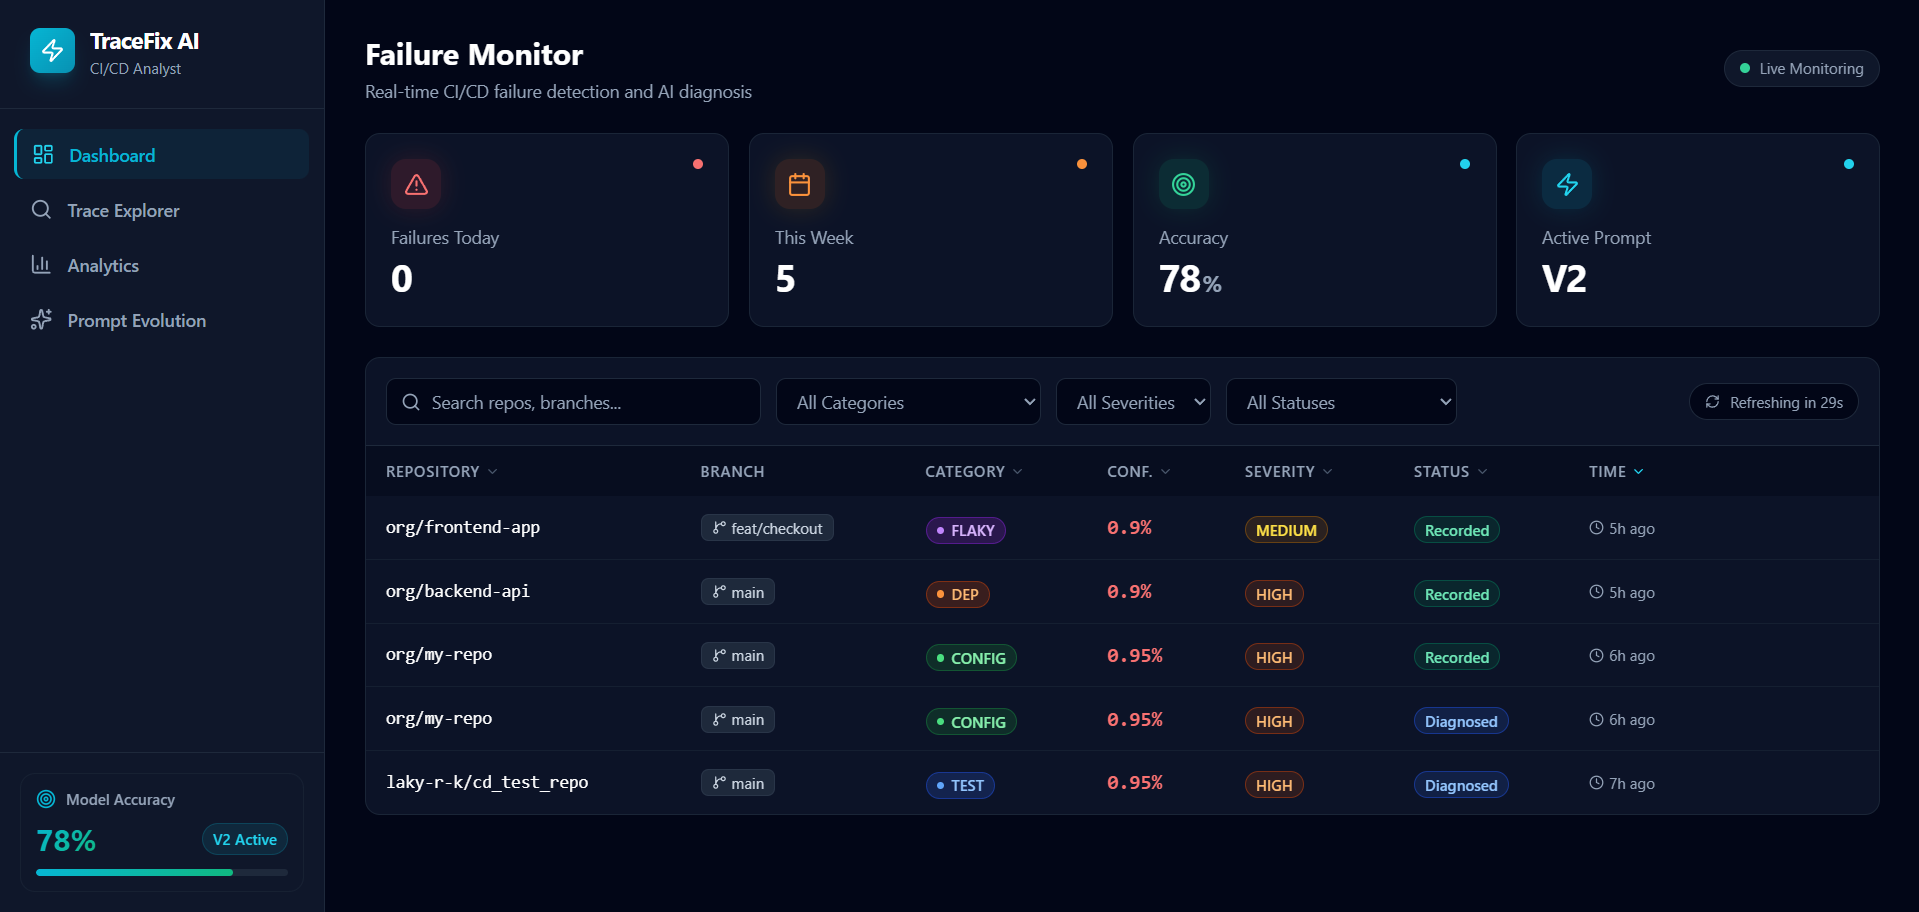
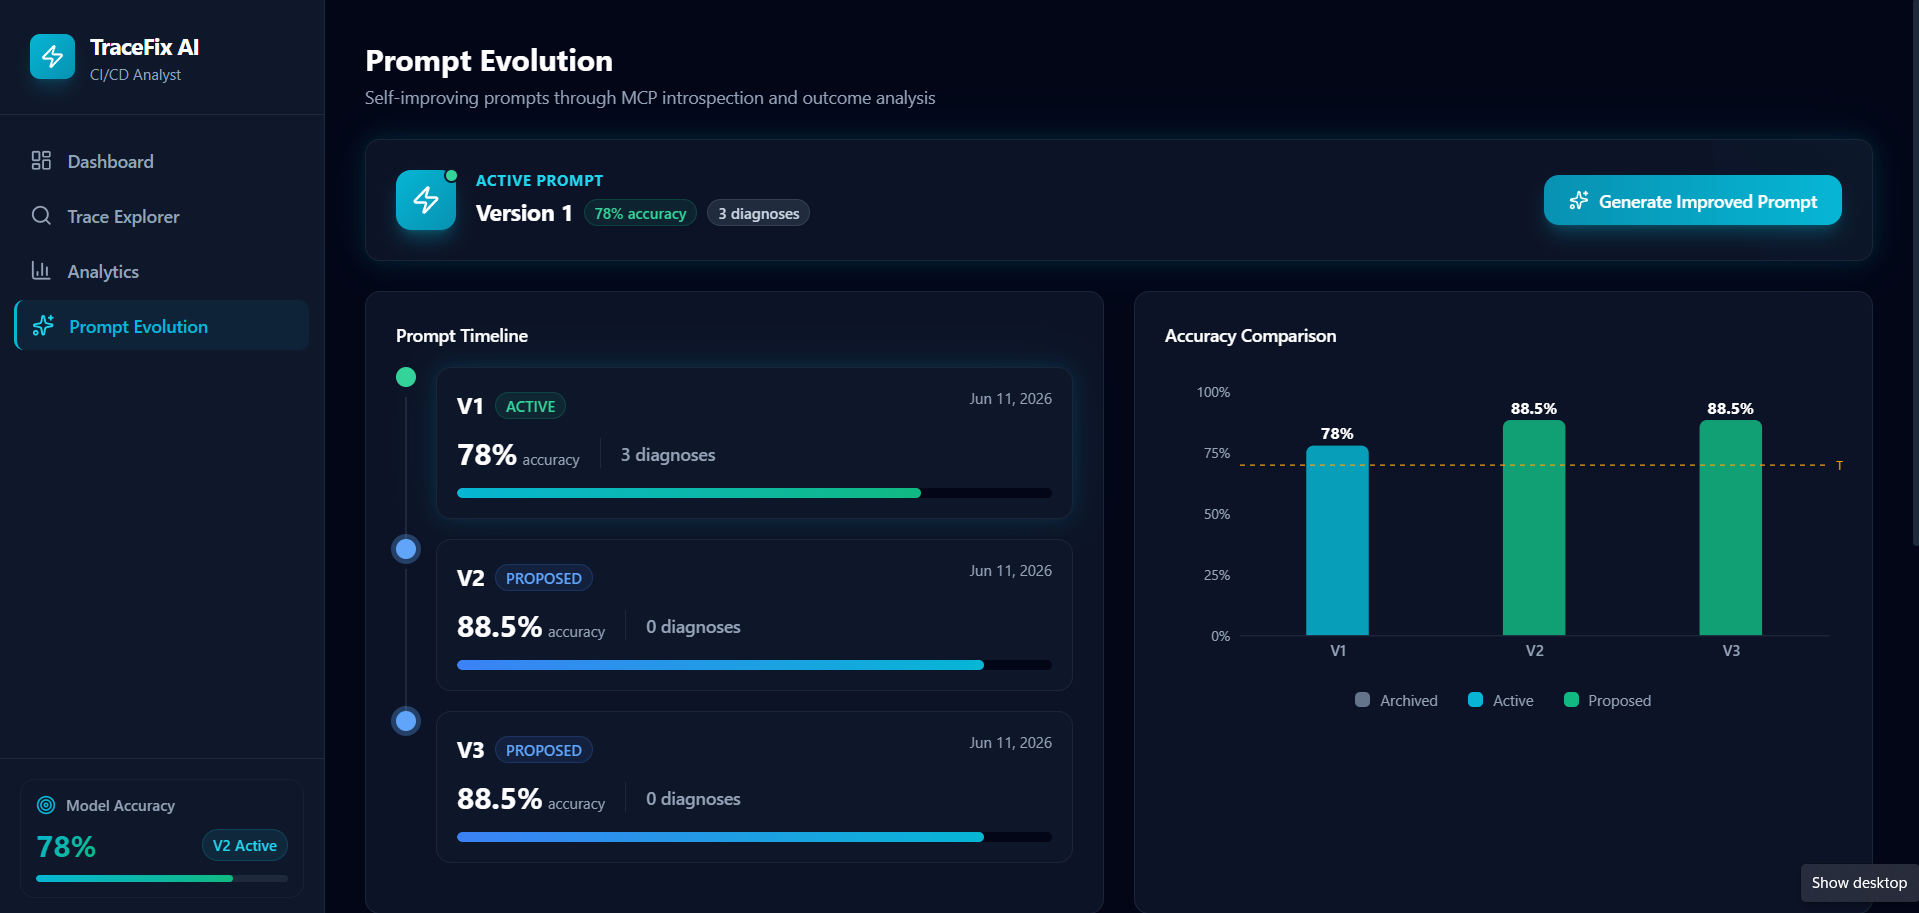
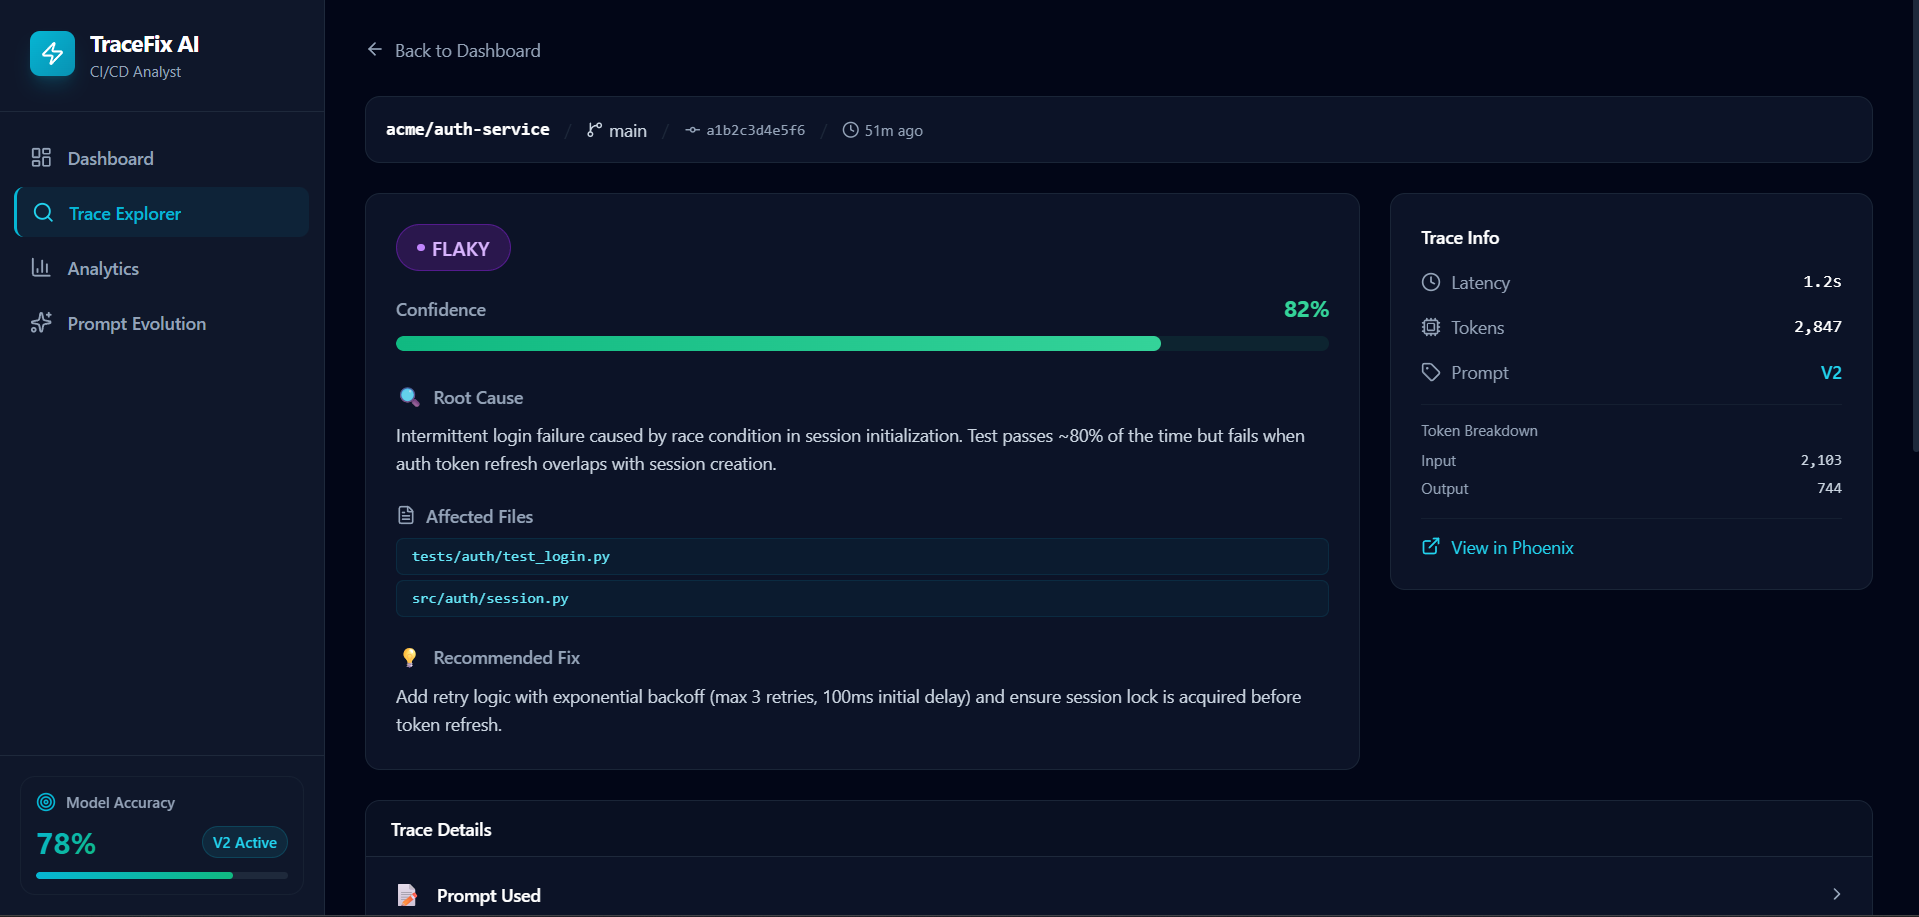
Diagnoses (Diagnosis Agent): Triggered on a new error. It reads the logs, classifies the root cause into one of 8 categories (flaky test, dependency failure, infrastructure, etc.), and recommends a specific fix with a confidence score. Traces: Every decision is traced via OpenInference into Arize Phoenix: prompt, response, reasoning, latency, and token usage. Tracks Outcomes: When the pipeline passes after a fix, we record whether the initial diagnosis was correct. Self-Evaluates (Judge Agent): When a new commit fixes the previous error, a separate Judge Agent evaluates the original diagnosis against the actual fix. Every step of this evaluation is stored in Phoenix for scoring. Introspects: The agent queries Phoenix via the Model Context Protocol (MCP): "Which failure types am I worst at diagnosing?" Improves: It generates an updated prompt (V2) targeting its weak spots, deploys it, and tracks whether accuracy improves. The dashboard shows all of this: Failure Monitor, Trace Explorer, Learning Analytics, and Prompt Evolution.
How we built it Agent Layer (Two-Agent Workflow): Gemini 2.5 Flash via LangGraph. We use a dual-agent architecture: a Diagnosis Agent (classifies new errors) and a Judge Agent (evaluates past diagnoses when errors are fixed). Both agents have their steps fully traced in Phoenix. Observability: Arize Phoenix running locally, receiving OpenTelemetry spans from every agent invocation. We store failure category, confidence score, repository, and prompt version as span metadata. MCP Integration: Phoenix MCP server exposes the agent's trace data back to it as a tool. The agent asks questions about its past performance and gets structured answers. Evaluation Pipeline: LLM-as-Judge using Gemini scores diagnosis quality against recorded outcomes. Scores are stored as Phoenix datasets and surfaced in analytics. Backend: FastAPI (Python) and SQLite for persistence. Frontend: Next.js 14, Tailwind, ShadCN components, and Recharts. Challenges we ran into Phoenix MCP Schema: Getting the agent to query its own trace data via MCP required understanding exactly how Phoenix structures span attributes. Our first few queries returned nothing because our custom metadata keys weren't indexed correctly. We had to adjust how we attached span attributes during instrumentation. Structured Output: Gemini would occasionally return diagnosis JSON with missing fields or wrapped in markdown code blocks. We added a strict output parser with fallback retry logic to handle this without crashing the pipeline. Closing the Feedback Loop: The hardest part wasn't building any single feature - it was making sure the full loop (diagnose -> trace -> evaluate -> introspect -> improve -> rediagnose) worked end-to-end without any step silently failing. Integration testing across 6 components on a tight timeline was tough. Accomplishments that we're proud of The MCP self-introspection actually works. The agent queries Phoenix, gets its own accuracy data, and uses it to write a better version of itself. Seeing that work was great. Prompt V1 to V2 accuracy improvement is measurable and visible in the dashboard. It reflects real diagnosis data. The full Observe -> Evaluate -> Introspect -> Improve loop runs end-to-end, which we weren't sure was achievable in the time we had. What we learned Arize Phoenix is underrated. Most people use it as a passive trace viewer. Using it as an active data source that the agent queries about itself via MCP is a completely different and much more powerful pattern. Evaluation is the hardest part. Building the diagnosis logic took one day. Making it measurably improvable took three. MCP changes how you think about agent memory. Instead of building custom retrieval pipelines, you can expose structured operational data through MCP and let the agent query it naturally. We'll use this pattern in future projects. What's next for TraceFix GitLab CI + Jenkins support: Same agent, different webhook formats. Auto-retry for flaky tests: If confidence > 90% that it's a flaky test, automatically re-trigger the pipeline via GitHub API. Team-level analytics: Aggregate accuracy across multiple repositories and engineers. Slack integration: Post diagnosis directly to the team's CI/CD channel with one-click outcome marking. Fine-tuned classifier: Replace the general Gemini prompt with a fine-tuned model trained on the team's historical failure data using Phoenix datasets as training input.
Built With
- arize-phoenix
- fastapi
- gemini-2.5-pro
- github-actions-api
- google-adk
- next.js-14
- openinference
- opentelemetry
- phoenix-mcp
- python
- recharts
- shadcn-ui
- sqlite
- tailwind-css
- typescript
