-
-
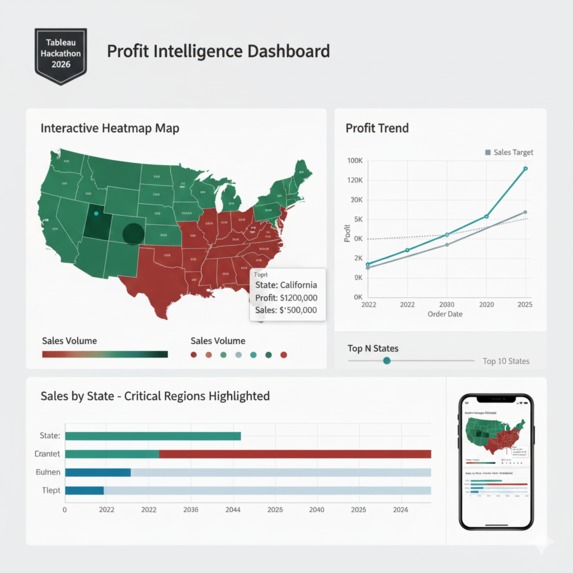
Profit Intelligence Dashboard

Inspiration
As a data analyst, I witnessed sales managers drowning in spreadsheets, struggling to identify which regions were profitable versus problematic. They spent hours on manual analysis that could be automated. I wanted to create a solution that would transform raw sales data into instant, actionable visual insights.
What it does
The Profit Intelligence Dashboard provides an interactive heatmap visualization of sales performance across US states. It uses color coding (blue/green for profit, red for losses) and size encoding (larger circles for higher sales) to convey multiple data dimensions at once. Users can click any state to filter all connected charts, enabling drill-down analysis.
How we built it
Built entirely with Tableau Public using the Superstore dataset: Created a dual-encoded heatmap (color = profit, size = sales) Implemented cross-filtering using dashboard actions Added a trend analysis chart for temporal insights Designed a mobile-responsive layout Incorporated tooltips with key metrics for quick insights
Challenges we ran into
Tableau Public has limitations, particularly around automated legend generation for dual-encoded visualizations. We worked around this by making the visualization intuitive and adding explanatory text. Another challenge was creating a seamless cross-filtering experience that worked consistently across all chart types.
Accomplishments that we're proud of
Creating an entirely functional, interactive dashboard within Tableau Public's constraints. The dashboard successfully identifies critical insights at a glance - like Pennsylvania's paradox of high sales but significant losses - which would take much longer to discover in traditional reports.
What we learned
Effective data visualization requires careful consideration of color theory, visual hierarchy, and user interaction patterns. We learned how to maximize Tableau Public's capabilities while working around its limitations, particularly in creating intuitive visualizations that don't require extensive legends or explanations.
What's next for Profit Intelligence Dashboard
Integrating real-time data feeds, adding predictive analytics for sales forecasting, implementing alert systems for when regions fall below profit thresholds, and expanding to global markets with multi-currency support.
Built With
- dashboard-actions
- dual-encoding
- heatmap-visualization
- mobile-responsive
- parameters
- tableau-public


Log in or sign up for Devpost to join the conversation.