-
-
grafana
About the Project
We built a highly scalable and resilient URL Shortening service designed with a strict "production-first" methodology. Our architecture proves that modern applications must extend beyond merely serving HTTP requests; they require deep, automated observability and robust incident management systems to survive real-world, 24/7 web traffic gracefully.
Inspiration
Most rapid-prototyping projects focus exclusively on building flashy features, ignoring what happens when the application inevitably crashes. We were inspired to flip this paradigm upside down. We set out to build an infrastructure-hardened application where the true innovation lies in the enterprise-grade reliability, telemetry data, and alerting scaffolding supporting the core business logic. We didn't just want to build an app that works locally—we wanted a system capable of handling automated incident response during a 3 AM outage.
What it does
Our project is a blazingly fast URL shortener backed by an ultra-resilient monitoring stack. While users actively generate and manage shortened links via our performant backend, the system continuously tracks its own health. The application emits cleanly structured JSON logs (with explicit INFO/WARN/ERROR categorization) and exposes a rich /metrics/json API measuring CPU and RAM saturation. If an anomaly occurs—such as a container crashing, or error rates breaching a 5% threshold for a sustained 5-minute rolling window—our automated pipeline catches it. It batches the incidents to prevent alert fatigue and dynamically pages the active on-call engineers across both Slack and Discord simultaneously.
How we built it
We architected the system for high scalability and separation of concerns using a modern Docker Compose stack:
- The Backend: Built on Python and FastAPI for high-throughput asynchronous processing, fully containerized using a multi-stage Docker build to keep images lightweight and secure.
- The Database: PostgreSQL acts as the stateful backbone, equipped with automated internal health checks to ensure data integrity during cold starts.
- The Observability Matrix: We instrumented Prometheus to actively scrape endpoint health and Golden Signals every 15 seconds.
- The Incident Response Pipeline: We configured a dedicated Prometheus Alertmanager instance. By utilizing environment variables and boot-time shell replacements, Alertmanager dynamically routes critical outages directly to native communication webhooks.
Challenges we ran into
Handling "Alert Fatigue" was a significant challenge when structuring our incident response. When we first built our alerting logic, any tiny momentary spike in CPU usage or a single dropped network packet would trigger a 5xx error and immediately page us on Discord. We realized that an overly sensitive monitoring system is just as dangerous as having no monitoring at all. We carefully formulated our Prometheus rule-engine to enforce explicit time-delay thresholds, such as for: 5m on error rate spikes, ensuring that engineers are only woken up for sustained, genuine systemic failures.
Accomplishments that we're proud of
We are incredibly proud of our highly reliable, dual-channel event routing integration. Getting Prometheus to seamlessly communicate with both Slack and native Discord webhooks concurrently—without hardcoding any sensitive secrets into our Git repository—demonstrable real DevOps dexterity. We also successfully conducted "fire drill" simulations where intentionally breaking the API container successfully tripped our ServiceDown trap, reliably pinging our phones with actionable notifications within our strict response-time deadlines.
What we learned
We learned the critical difference between logs and metrics in an enterprise environment: Logs tell you what happened, but metrics tell you how much is happening. We learned that simple print() statements are useless for automated pipelines; scalable systems require structured JSON telemetry to parse incidents effectively at scale.
What's next for Production Ready URL shortener
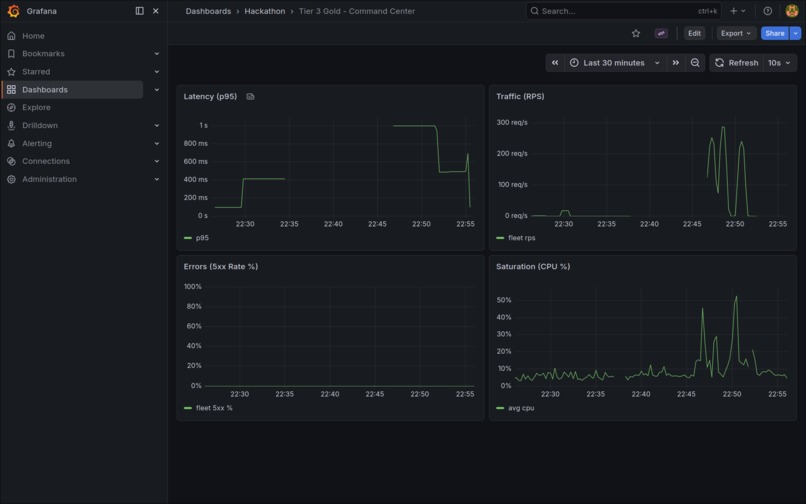
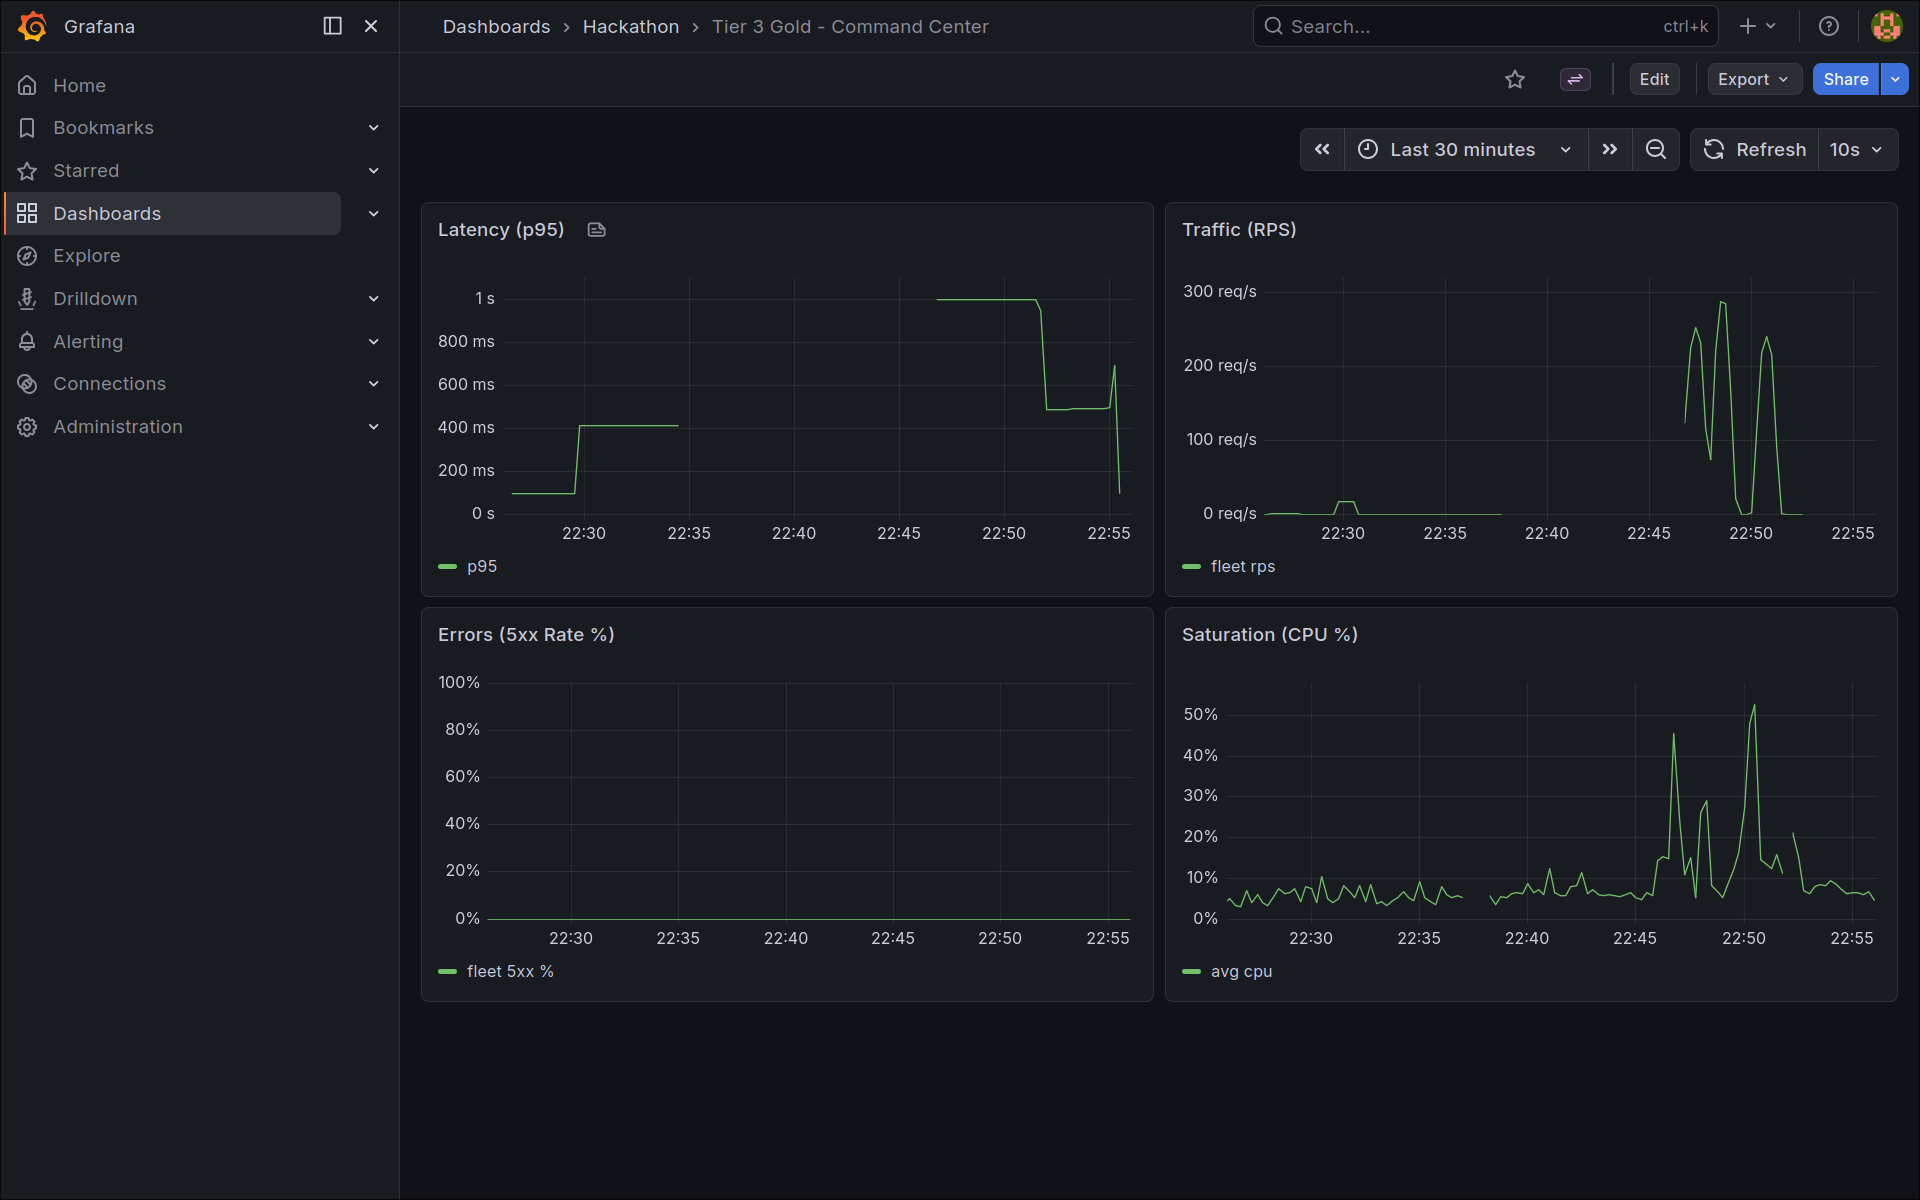
The foundation is rock solid, so our immediate next steps involve heavily expanding our scalability and analytics. We plan to introduce a Redis caching layer to handle high-velocity read requests for heavily trafficked short links, which will take stress off the primary PostgreSQL database under intensive load. To elevate our incident response capabilities, we’d also like to layer a custom Grafana dashboard over our stack to supply on-call engineers with a centralized, data-rich "command center" UI.


Log in or sign up for Devpost to join the conversation.