-
-
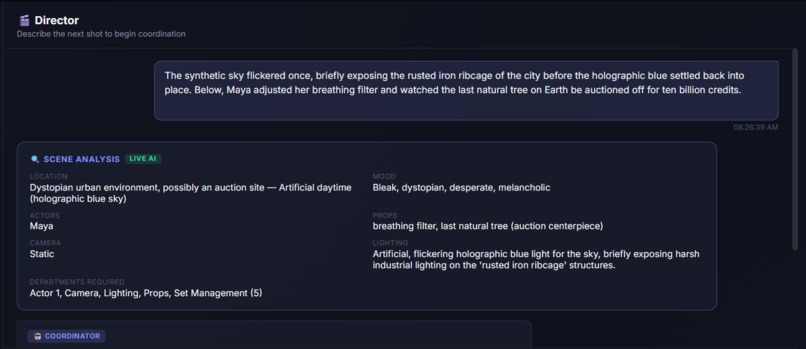
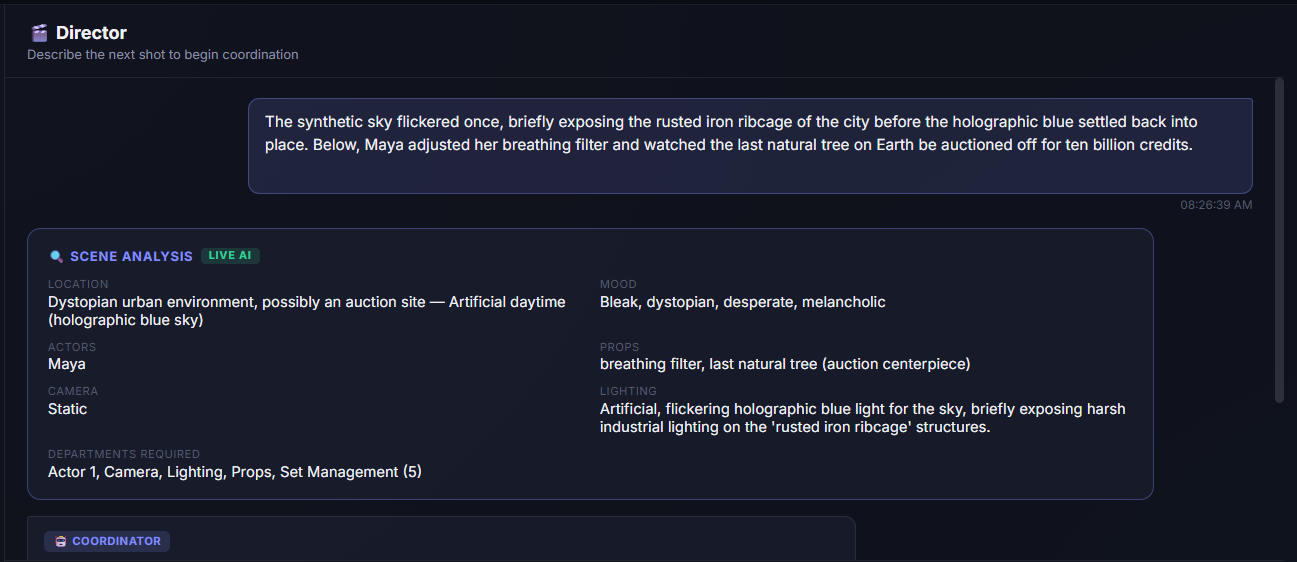
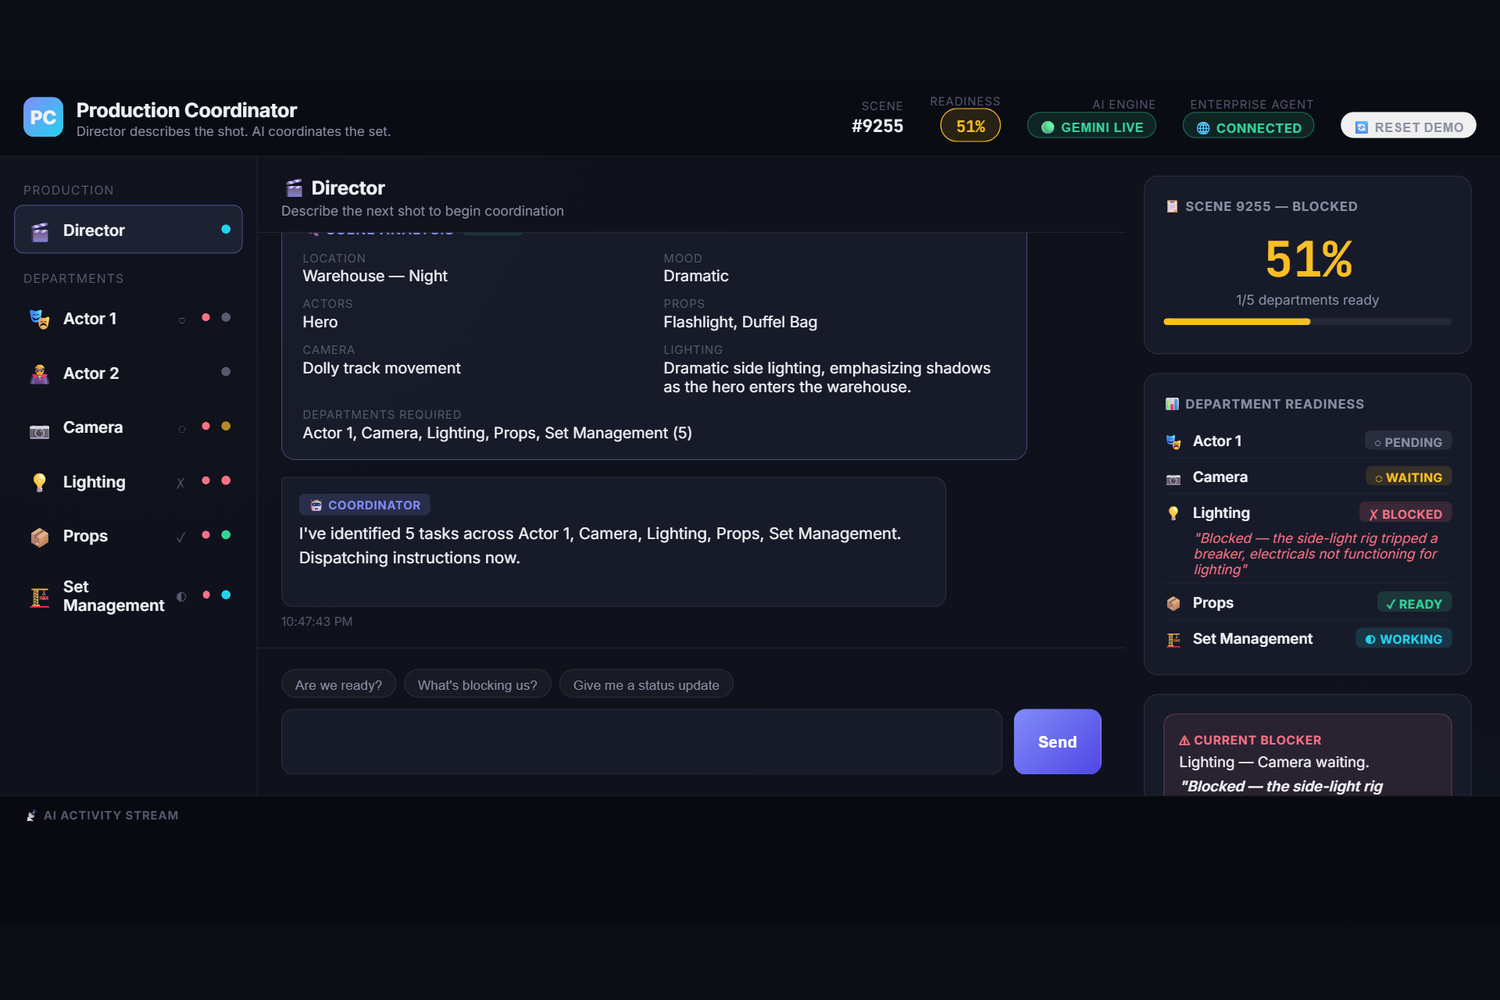
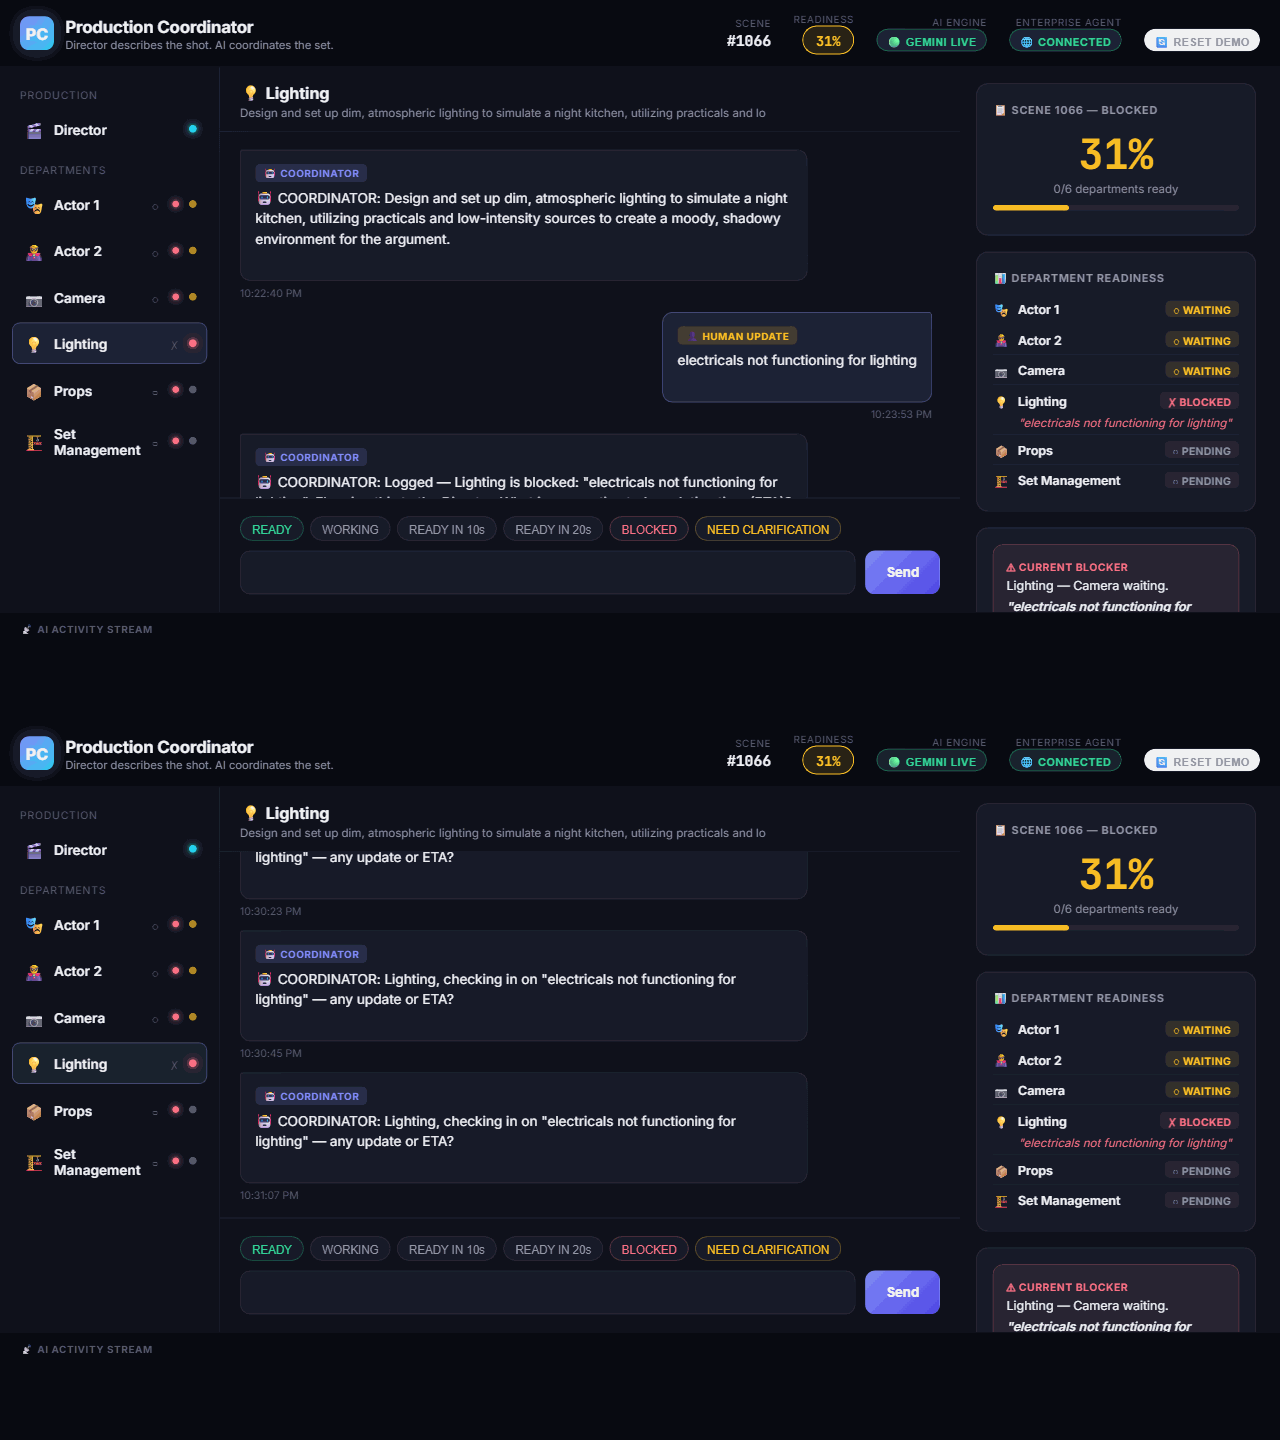
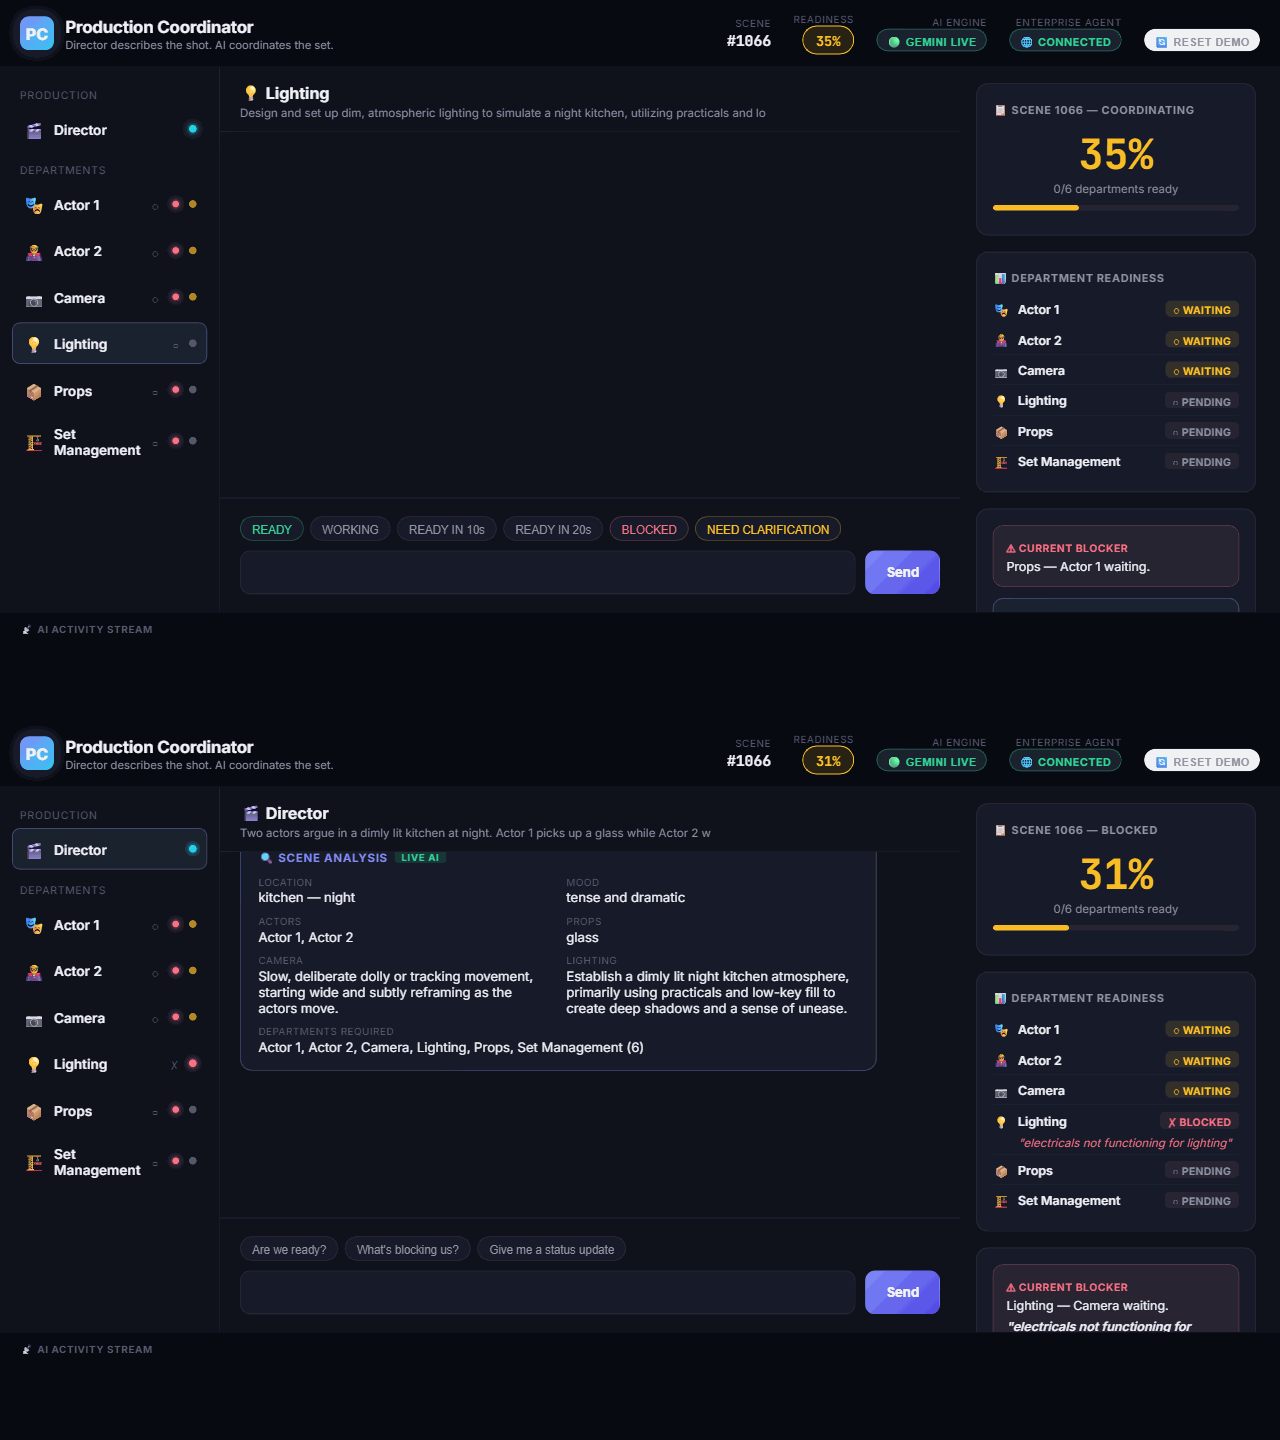
The Director describes a shot in plain English — that's the only input the whole coordination loop needs.
-
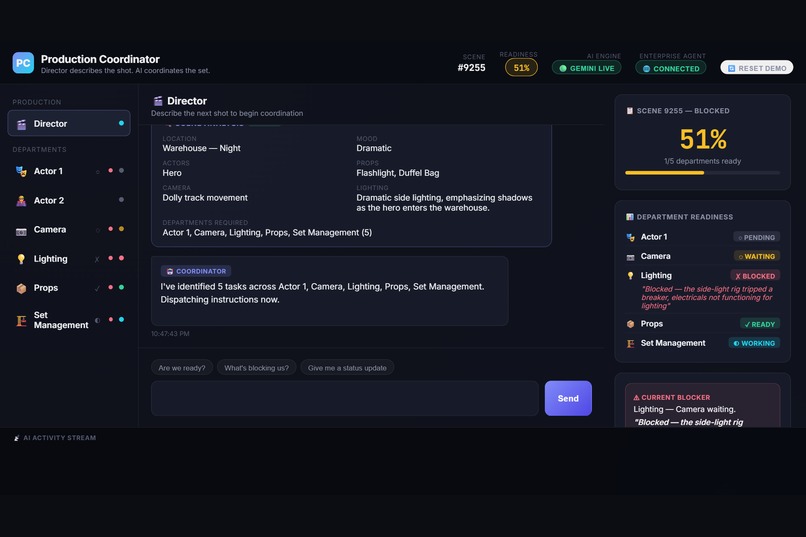
Gemini decomposes the shot into 5 concrete per-department tasks and dispatches them instantly.
-
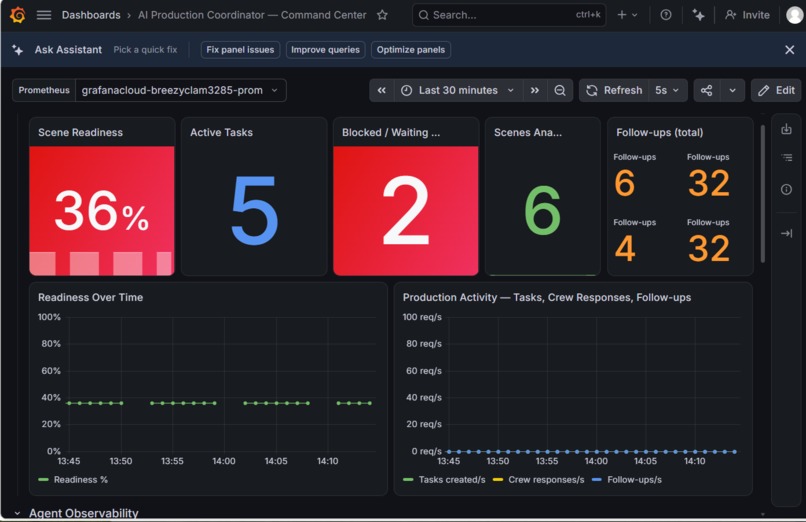
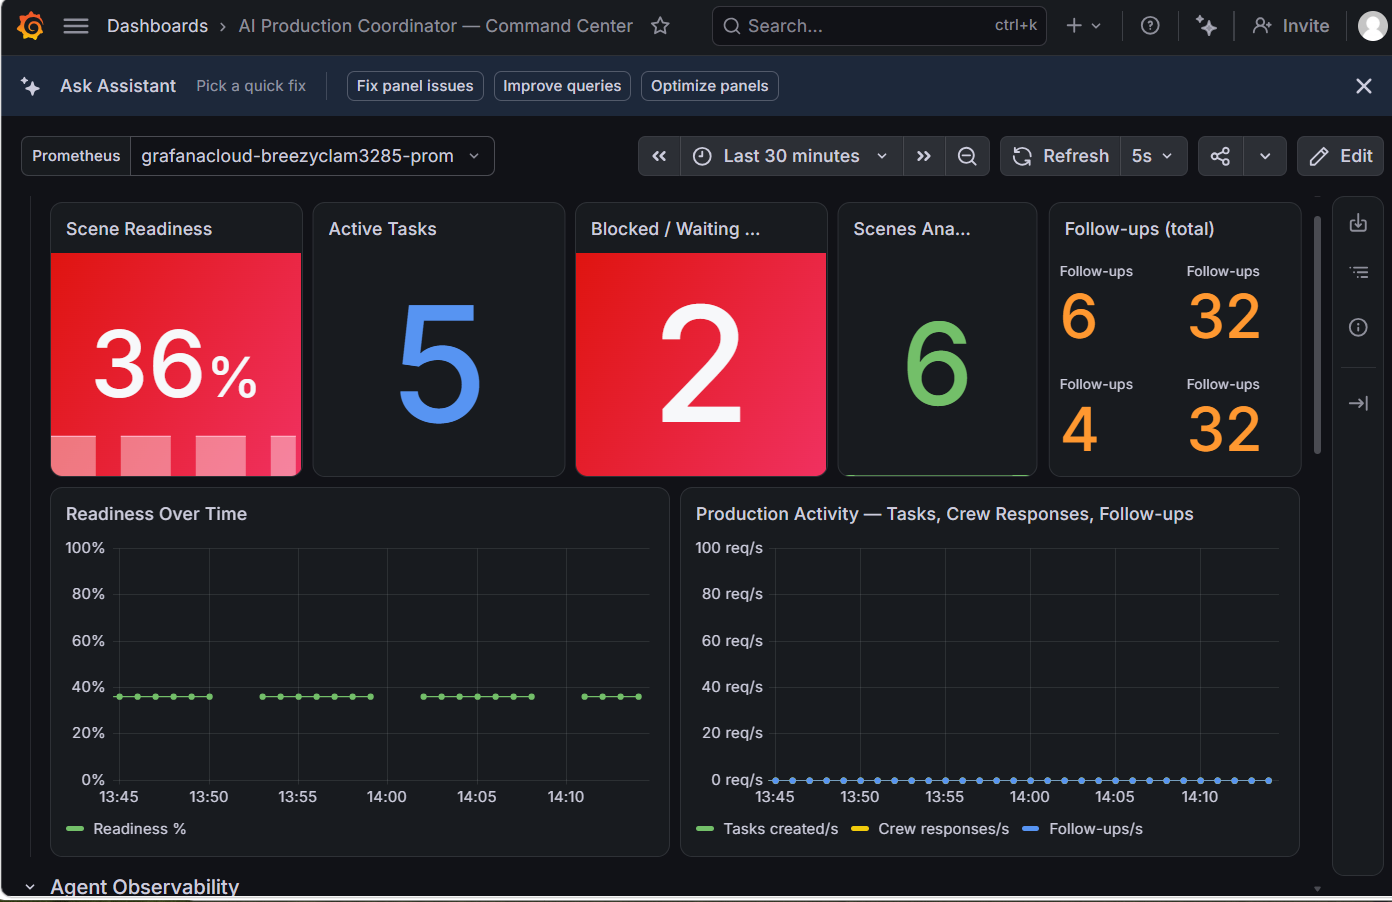
Grafana Dashboard with live metrics
-
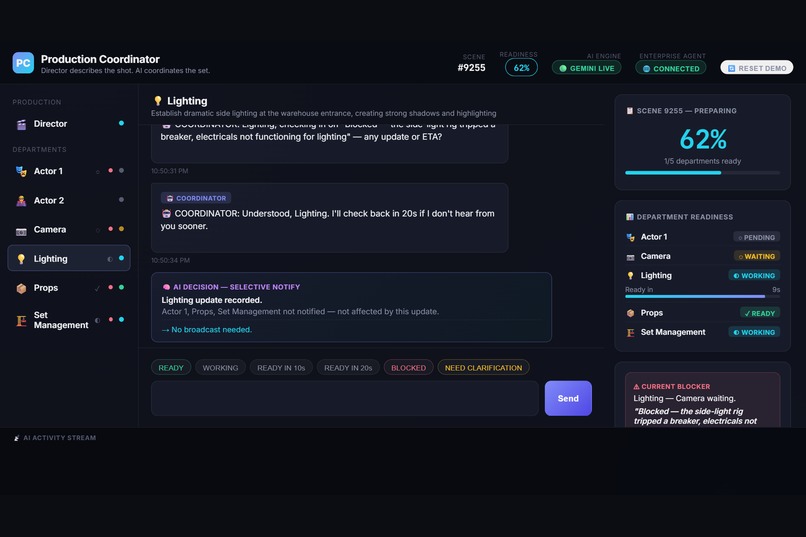
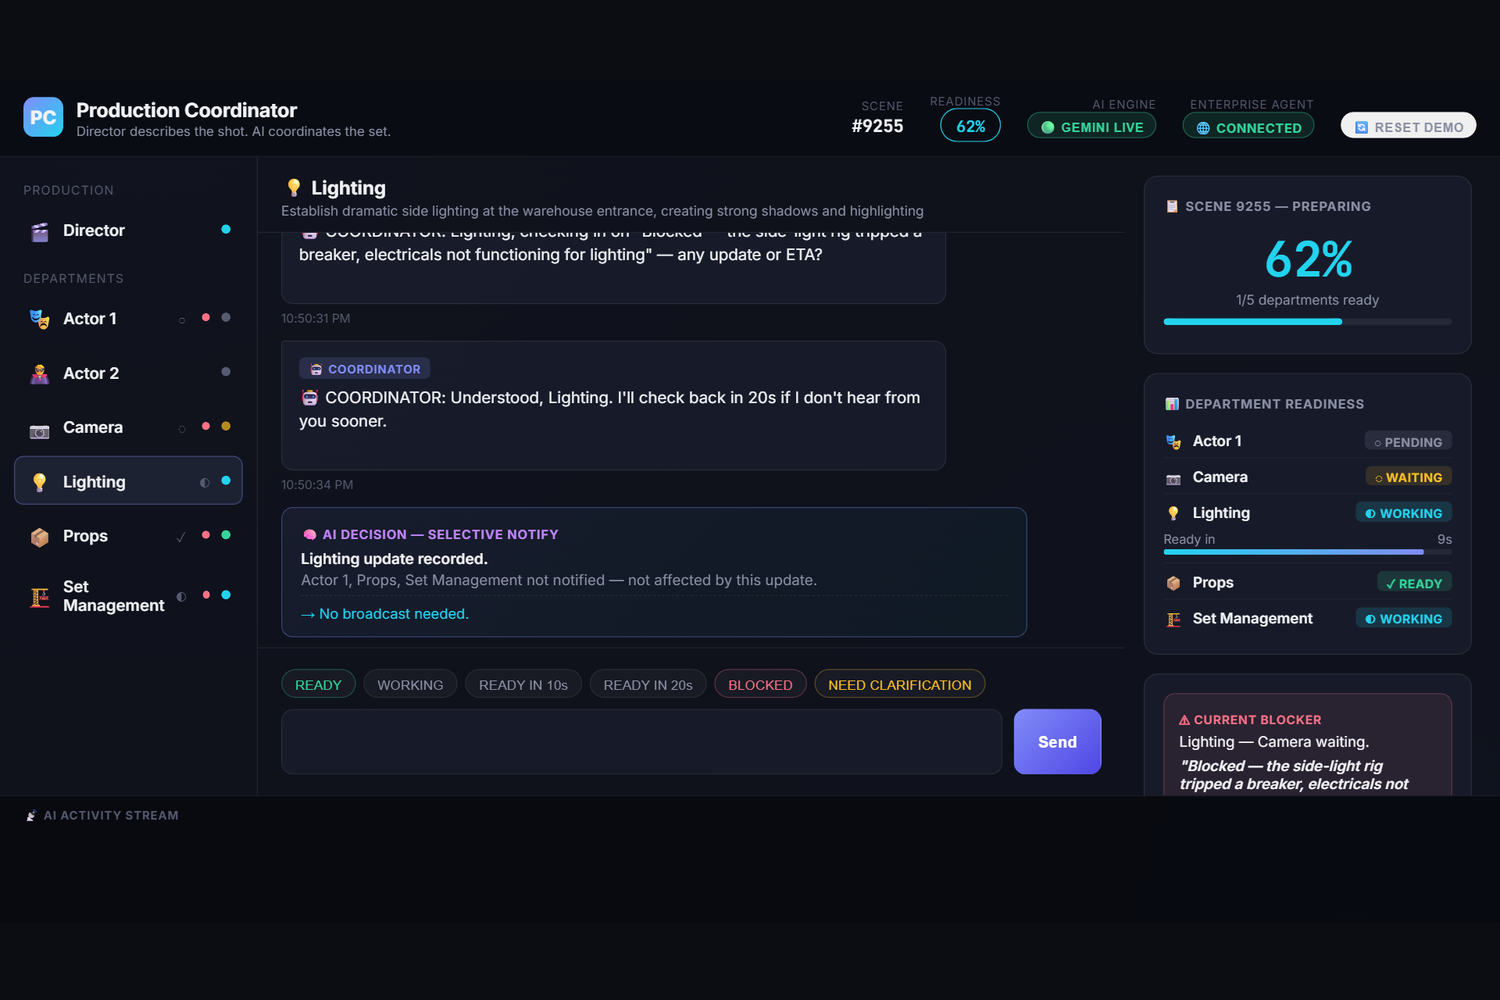
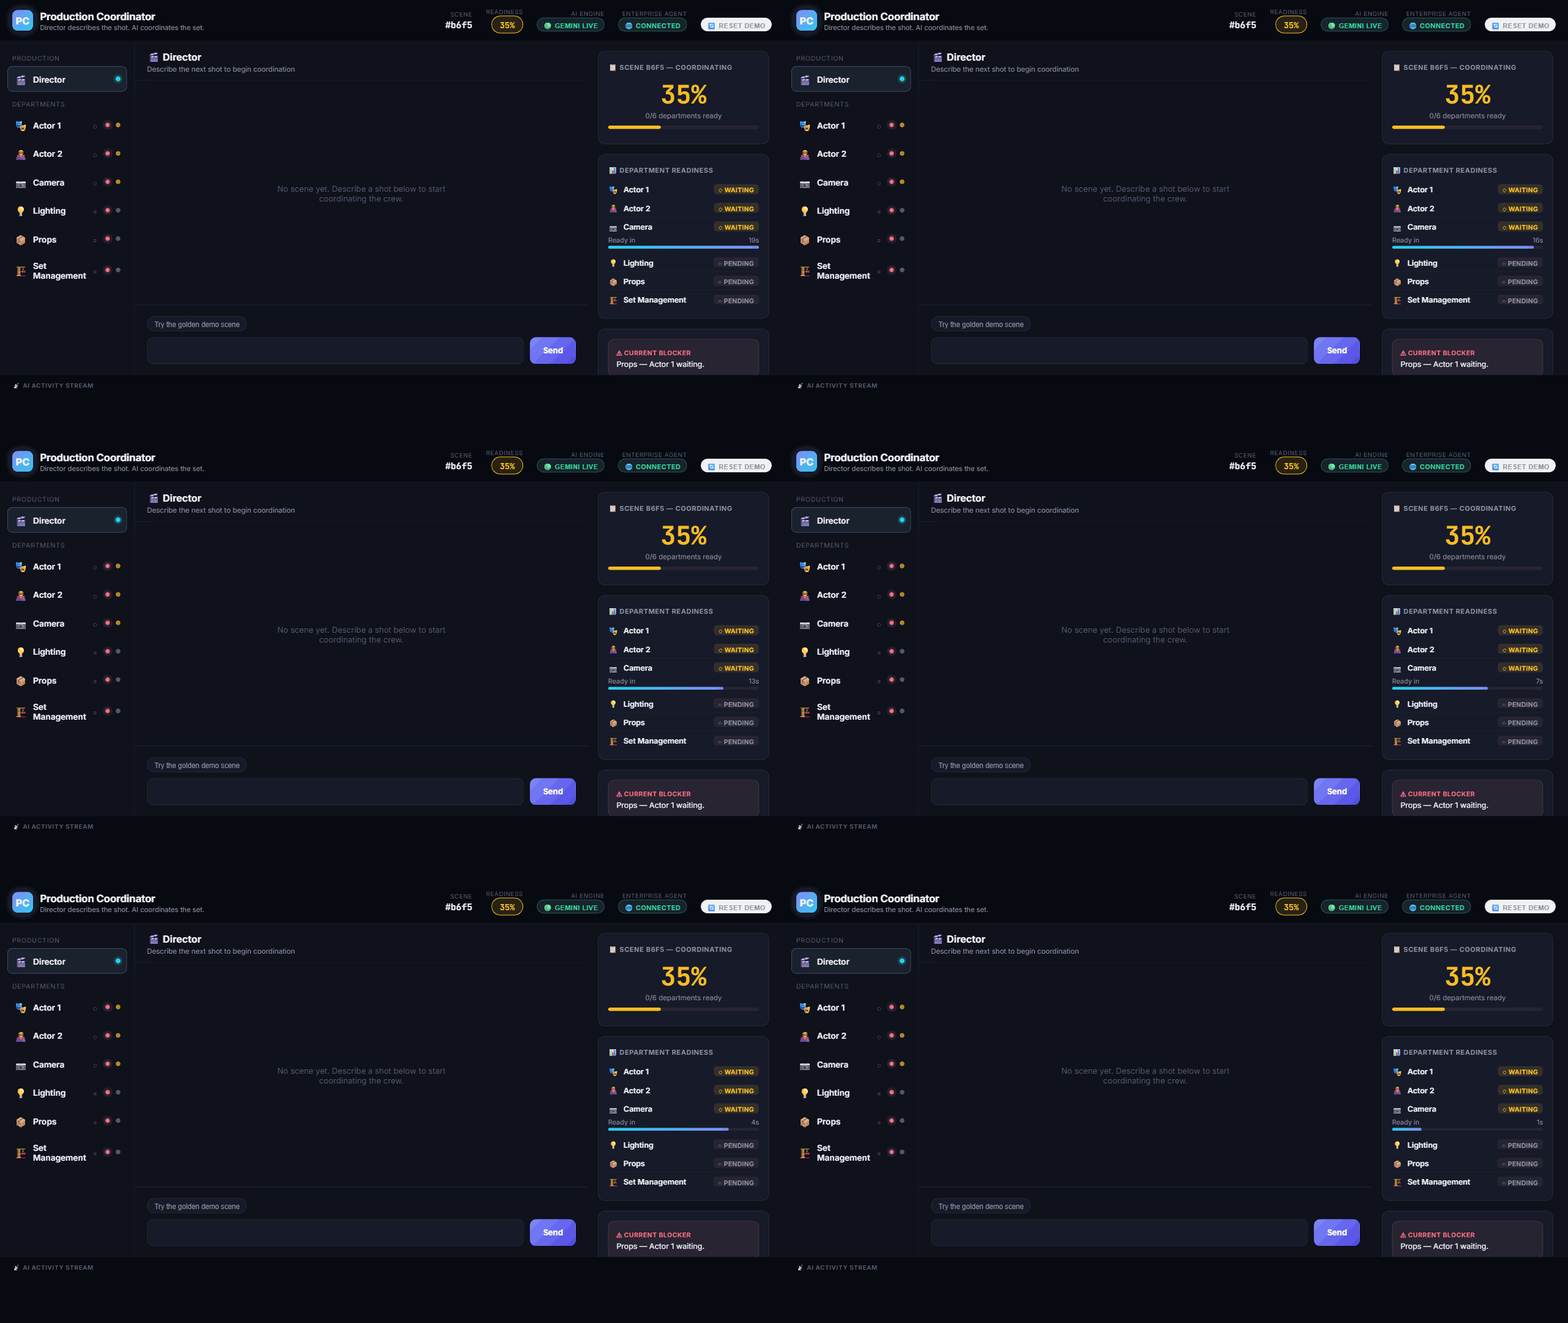
Once Lighting gives an ETA, the Director watches it count down live — "Ready in 9s" — the same promise the department itself is tracking.
-
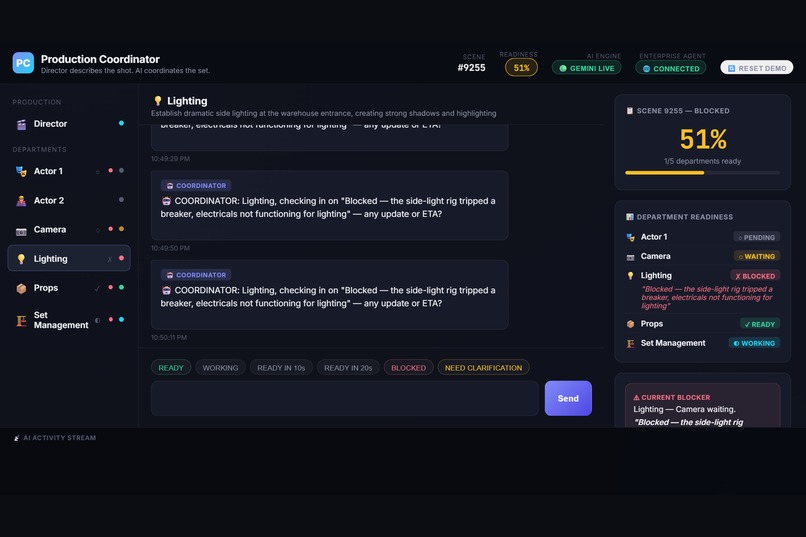
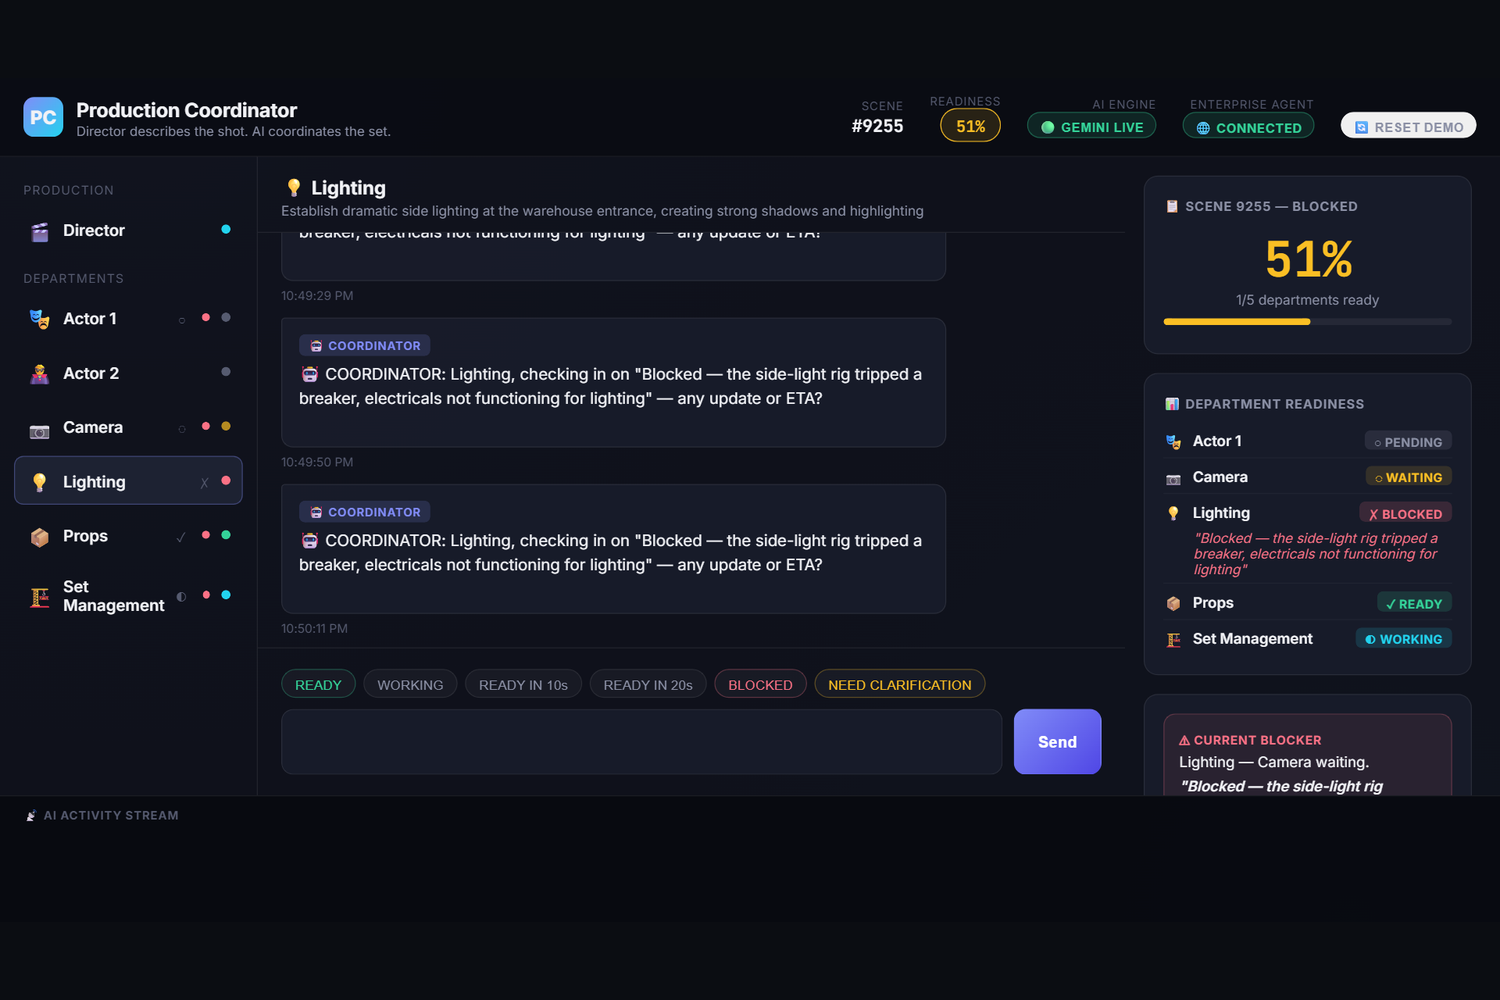
With no ETA given, the Coordinator checks back in on its own — repeatedly, referencing the department's stated reason, not a generic nudge.
-
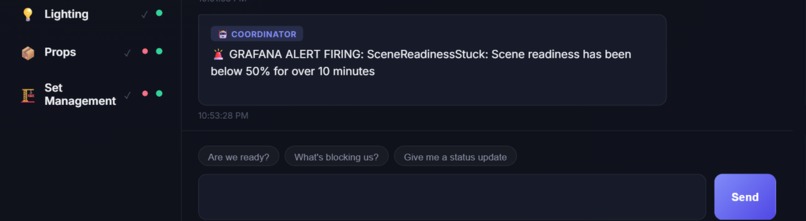
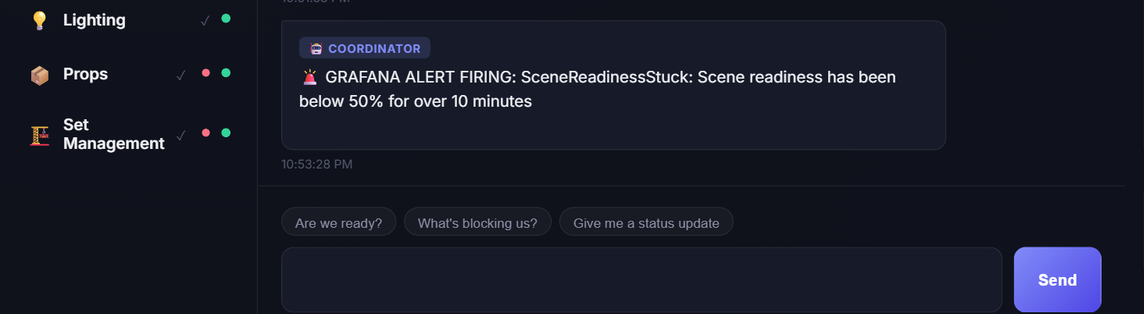
A real Grafana alert fires on live telemetry and calls back through a signed webhook — the Coordinator announces it in the Director's chat.
-
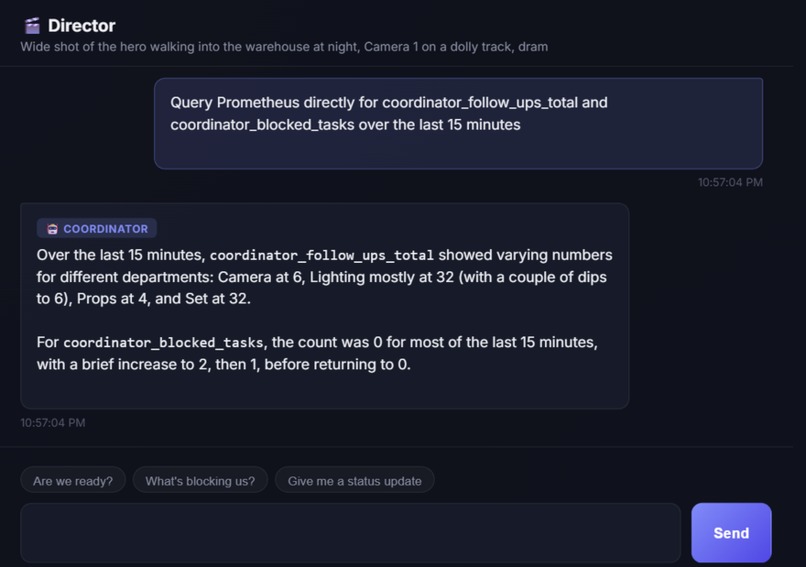
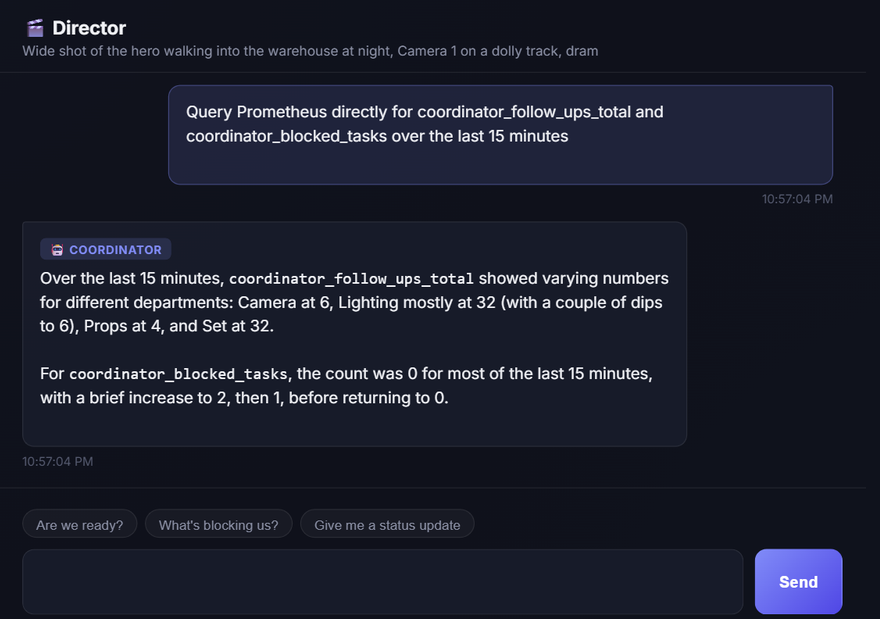
The Director queries Prometheus via MCP tool calls — real coordinator_follow_ups_total and coordinator_blocked_tasks values, not a guess.
Inspiration
Every film set runs on the same quiet chaos: a Director calls a shot, and that intent has to fan out to six departments — Actor 1, Actor 2, Camera, Lighting, Props, Set Management — each with real dependencies on the others. Props has to be ready before Actor 1 can start. Set has to be dressed before Actor 2 can walk in. Lighting has to be set before Camera can roll. Somewhere in the middle of that web sits a human — an AD, a script supervisor — manually tracking who's ready, who's silently stuck, and chasing people down over radio.
That's not a chatbot problem. It's a deterministic, multi-step coordination problem that happens to need language understanding at its edges — someone has to read "still looking for the 5mm lens" and know that means BLOCKED, not WORKING. We wanted to build an agent that does the coordination itself: reads intent, tracks real state, chases silence, and never fabricates a number just because a human is waiting for an answer.
What it does
The Director types one scene description in plain language. From there, the AI Production Coordinator runs the whole operational loop on its own:
- Analyzes the scene — a real Gemini agent decomposes it into a task per required department, with specific, concrete instructions (not generic placeholders).
- Builds a real dependency graph — Props → Actor 1, Set → Actor 2, Lighting → Camera — computed deterministically, never invented by the LLM.
- Dispatches and tracks — every department gets its instructions instantly, and can report back in plain English ("still looking for the lens," "ready in 20s," "got the part, need a minute").
- Follows up autonomously — a background loop checks every 2 seconds. If a promised ETA elapses, or a department is blocked with no ETA at all, the Coordinator proactively checks back in — repeatedly, referencing the department's own stated reason, not a generic nudge.
- Reports readiness, always truthfully — ask "what's blocking us?" and you get a fully deterministic report: real percentage, every currently-blocked department and its actual reason (not just one), the critical dependency chain, and one clear next action. None of it is phrased by an LLM.
- Watches itself, live, in Grafana — every action is exported as real OpenTelemetry traces and metrics. A custom Grafana dashboard shows readiness, active/blocked tasks, decision rate, and agent health in real time.
- Reaches back into Grafana, live — the Director can ask the agent to go check real telemetry ("check Prometheus for our blocked task count"), and it genuinely queries Prometheus, Loki, and Tempo through the Model Context Protocol to answer with real data — not a guess.
- Closes the loop with real alerting — two live Grafana alert rules watch the same telemetry the dashboard shows: one for a scene stuck below 50% readiness, one for a department that's gone unresponsive after repeated follow-ups. When either fires, Grafana calls back into the app through a real, HMAC-signed webhook, and the Coordinator announces it to the Director directly in chat.
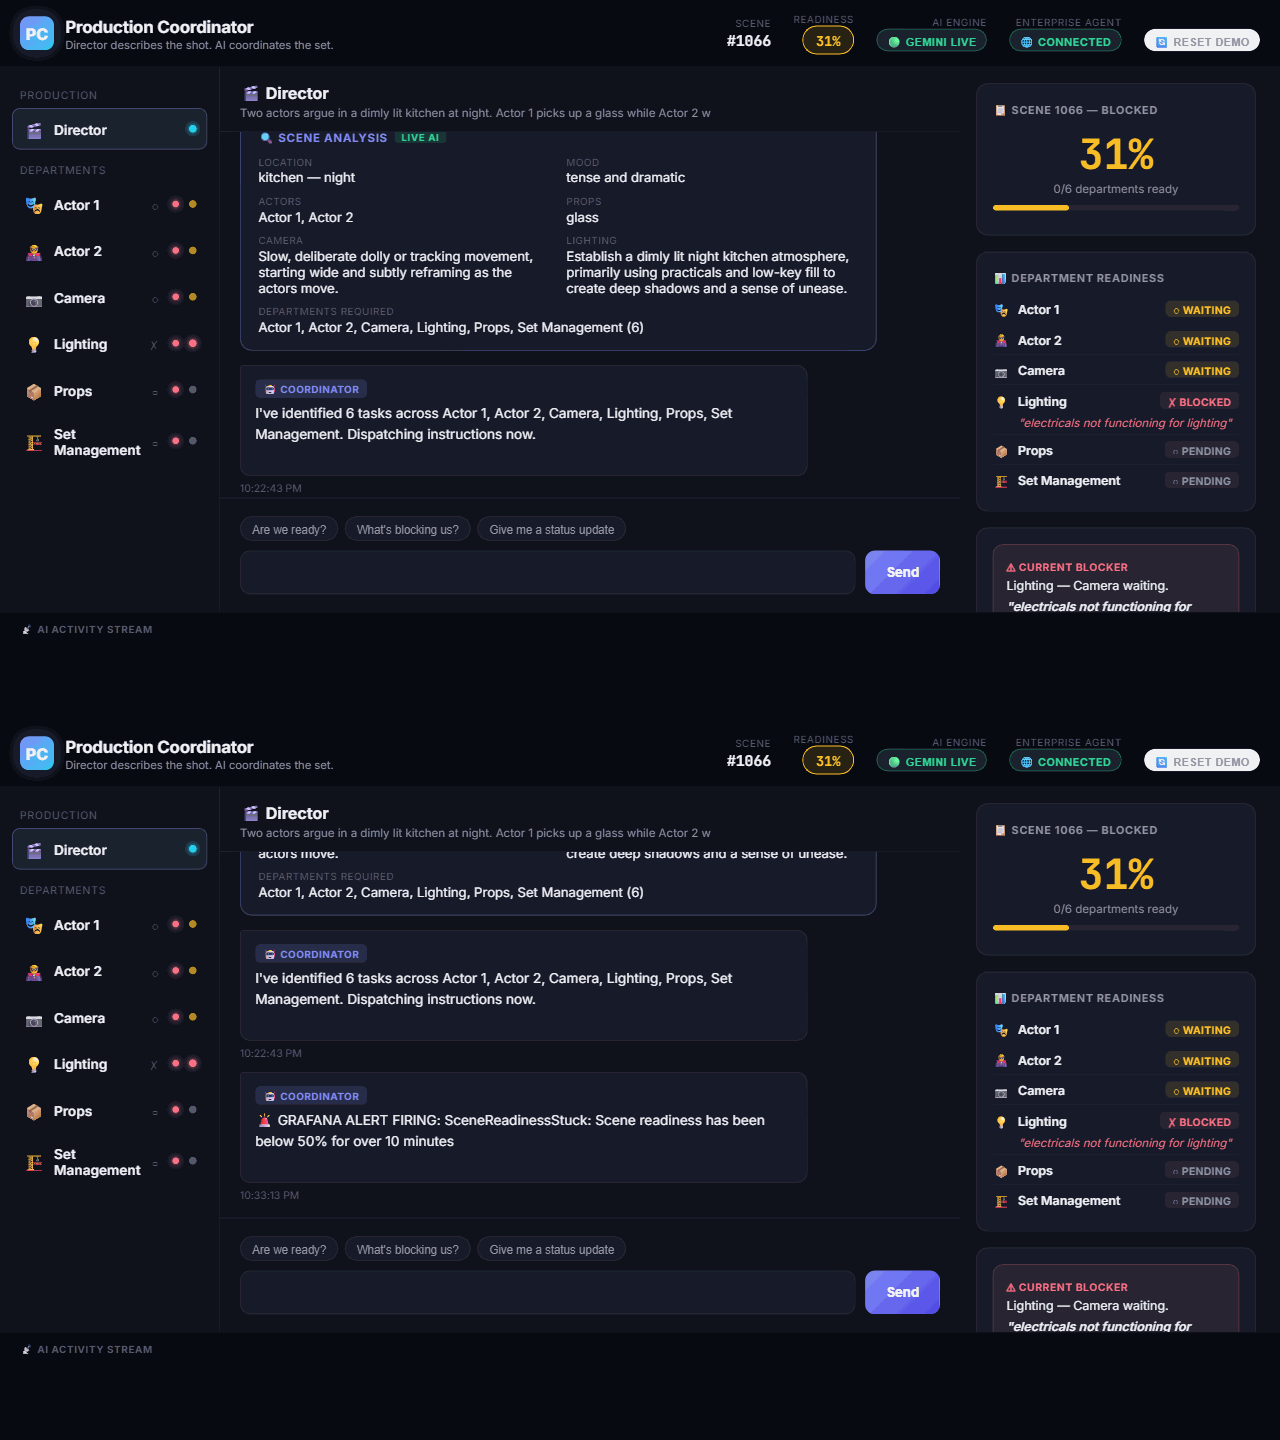
A department reporting a real blocker doesn't just flip a badge — the actual stated reason shows up everywhere that matters: the sidebar, the readiness report, and the Coordinator's own reply.
And a countdown a department promises is tracked and shown live, not just logged — the Director watches it tick down the same way the department does.
How we built it
- Google ADK, genuinely, everywhere. All three Gemini-calling paths — scene analysis, crew-message interpretation, and the Director-facing chat — are real
google-adkLlmAgent+Runnerinstances, not raw SDK calls with a JSON-mode prompt trick. Structured output uses ADK'soutput_schema, real Gemini structured output. - A hard deterministic/LLM boundary.
domain.py's dependency engine and readiness weights are plain, auditable Python. The LLM understands language and phrases sentences; it never computes a percentage, a bottleneck, or a dependency. This rule got tested by real bugs during development (more below) and held up every time we restored it. - Grafana, in both directions. Outbound: real OpenTelemetry traces and metrics on every domain event. Inbound: the Director's ADK agent has two separate, real MCP toolsets — the open-source
mcp-grafanaserver for Prometheus/Loki, and Tempo's own dedicated MCP server for trace queries (deliberately not Grafana's newer OAuth-only Cloud MCP server, since that doesn't fit an unattended backend agent — a real architectural call, not an oversight). And now, alerting: a dedicated webhook endpoint (grafana_alerts.py) that verifies Grafana's native HMAC-SHA256 request signing and reacts to real alert-group payloads generically, so any alert rule pointed at it — today's two, or a future one — just works. - A real managed protocol adapter.
enterprise_adapter.pyexposes a complete, resolvable OpenAPI schema with enforced bearer-token and HMAC auth, so an external agent platform could genuinely register and call into this app's tools. - Real infrastructure, not a demo shim. Firestore for persistent state and an immutable event/decision log, Pub/Sub for four topics of event streaming, Secret Manager for the durable API key, all deployed live on Cloud Run.
Challenges we ran into
The honest version of this section is a list of real bugs, found by testing against a live server with live Gemini calls — never mocks — and fixed by restoring the deterministic boundary, not by prompting harder:
- A two-layer bottleneck bug. A department's own self-reported BLOCKED status was being silently downgraded to a generic "waiting on a dependency" signal, hiding the specific reason a human actually gave behind a vague placeholder. Fixed in both the bottleneck-selection algorithm and, one level deeper, the status-resolution pass that was overwriting it in the first place.
- A bare-reply misclassification. A crew member replying just
"20s"to the agent's own "what's your ETA?" question got read as READY instead of "still working, 20 seconds out" — because each classification call is stateless by design. Fixed by passing the department's prior status as context. - A blocker reason getting silently erased. The next time that same bare-reply pattern hit a BLOCKED department, it overwrote the real, specific reason ("electricals not functioning") with the throwaway reply text ("20s"). Fixed by protecting an already-recorded reason from being clobbered by a content-free follow-up.
- A malformed alert query, caught only by checking Grafana's actual live alert state via its API — not by trusting the UI preview. The rule looked configured; the stored PromQL was silently broken.
- An idle-vs-stuck ambiguity. A gauge deliberately zeroed on reset (so the dashboard wouldn't show stale numbers) turned out to look identical to a genuinely stuck scene once we wired up alerting on top of it — an idle app was triggering a "readiness stuck" alert every time. Fixed with a second
scene_activesignal so alerts can tell the difference. - Notification batching hiding real-time alerts. Grafana's default notification grouping bundled every department's alert under one shared timer, delaying delivery by minutes. Diagnosed by pulling the actual historical metric data and cross-referencing exact timestamps, not by guessing.
- Cloud-side flakiness that looked like app bugs. Grafana Cloud's free tier auto-pauses on inactivity; Cloud Run scales to zero the same way. Both silently stop telemetry, and both were mistaken for logic bugs at first — until we checked the raw data and found the pipe itself had gone quiet, not the logic.
Accomplishments that we're proud of
- Grafana tool-calling that's actually real, verified by connecting directly and listing live tools rather than trusting a screenshot — the agent has genuinely used them to pull real metrics and real span attributes that only exist because our own code put them there.
- A fully closed alerting loop, not just outbound telemetry: Grafana watches our metrics, decides something's wrong, and calls back into the same app that's being watched — verified end-to-end with Grafana's own real signed test notifications, not simulated ones.
- A deterministic core that survived adversarial testing. Every one of the bugs above was a case of the LLM's judgment quietly overriding ground truth, and every fix restored the deterministic layer's authority — the architecture we designed around held up under real pressure, not just in theory.
- A live, deployed, working product with a clean public GitHub repo, real regression tests run against a live server on every change, and zero secrets ever committed.
What we learned
- The hardest part of building an "agentic" system isn't getting an LLM to do something — it's deciding, precisely, what it's never allowed to decide, and then defending that line every time a new feature is tempted to blur it.
- Real observability for an agent needs the same rigor as observability for any other production service — trace latency, tool-call success rates, decision rates — not just a metrics counter that looks good in a demo.
- Ground-truth verification beats trusting any single layer's UI. More than once, an alert rule "looked" correctly configured in the Grafana UI, and only querying the actual live API surfaced that it wasn't.
- Cloud infrastructure has its own failure modes — scale-to-zero, free-tier pausing — that show up disguised as application bugs if you don't check the infrastructure layer first.
What's next for Production Coordinator
- Cross-production analytics — right now the app tracks one active scene; a natural next step is a historical layer (ClickHouse or similar) so a studio can ask "which department is our recurring bottleneck across the last 50 scenes," not just "right now."
- Real script ingestion — accepting an actual screenplay PDF and grounding scene analysis in it, instead of a typed paragraph.
- A genuine Agent Engine deployment for the Director agent specifically, once we've validated that its MCP toolsets behave correctly inside that managed runtime.
- Real crew-facing check-in, using the enterprise adapter's partner webhook path that already exists for this — so a crew member's own phone, not the Director's screen, is where a status update actually comes from.

Log in or sign up for Devpost to join the conversation.