Inspiration
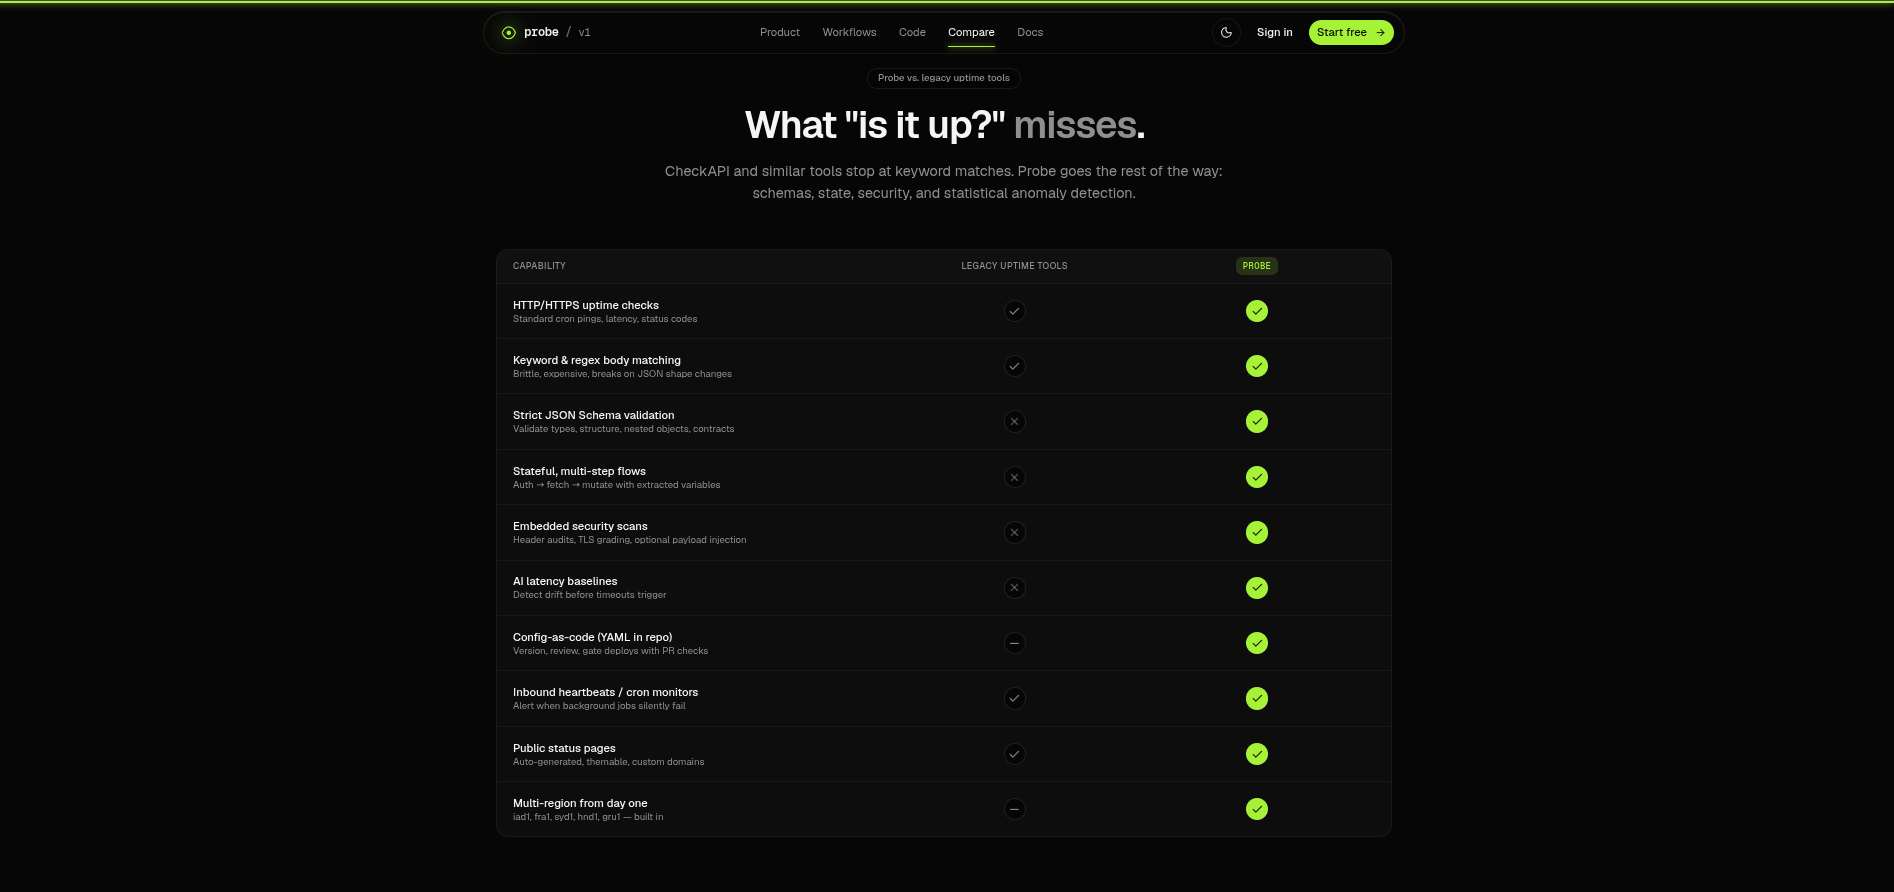
Every developer has been burned by an API that lies.
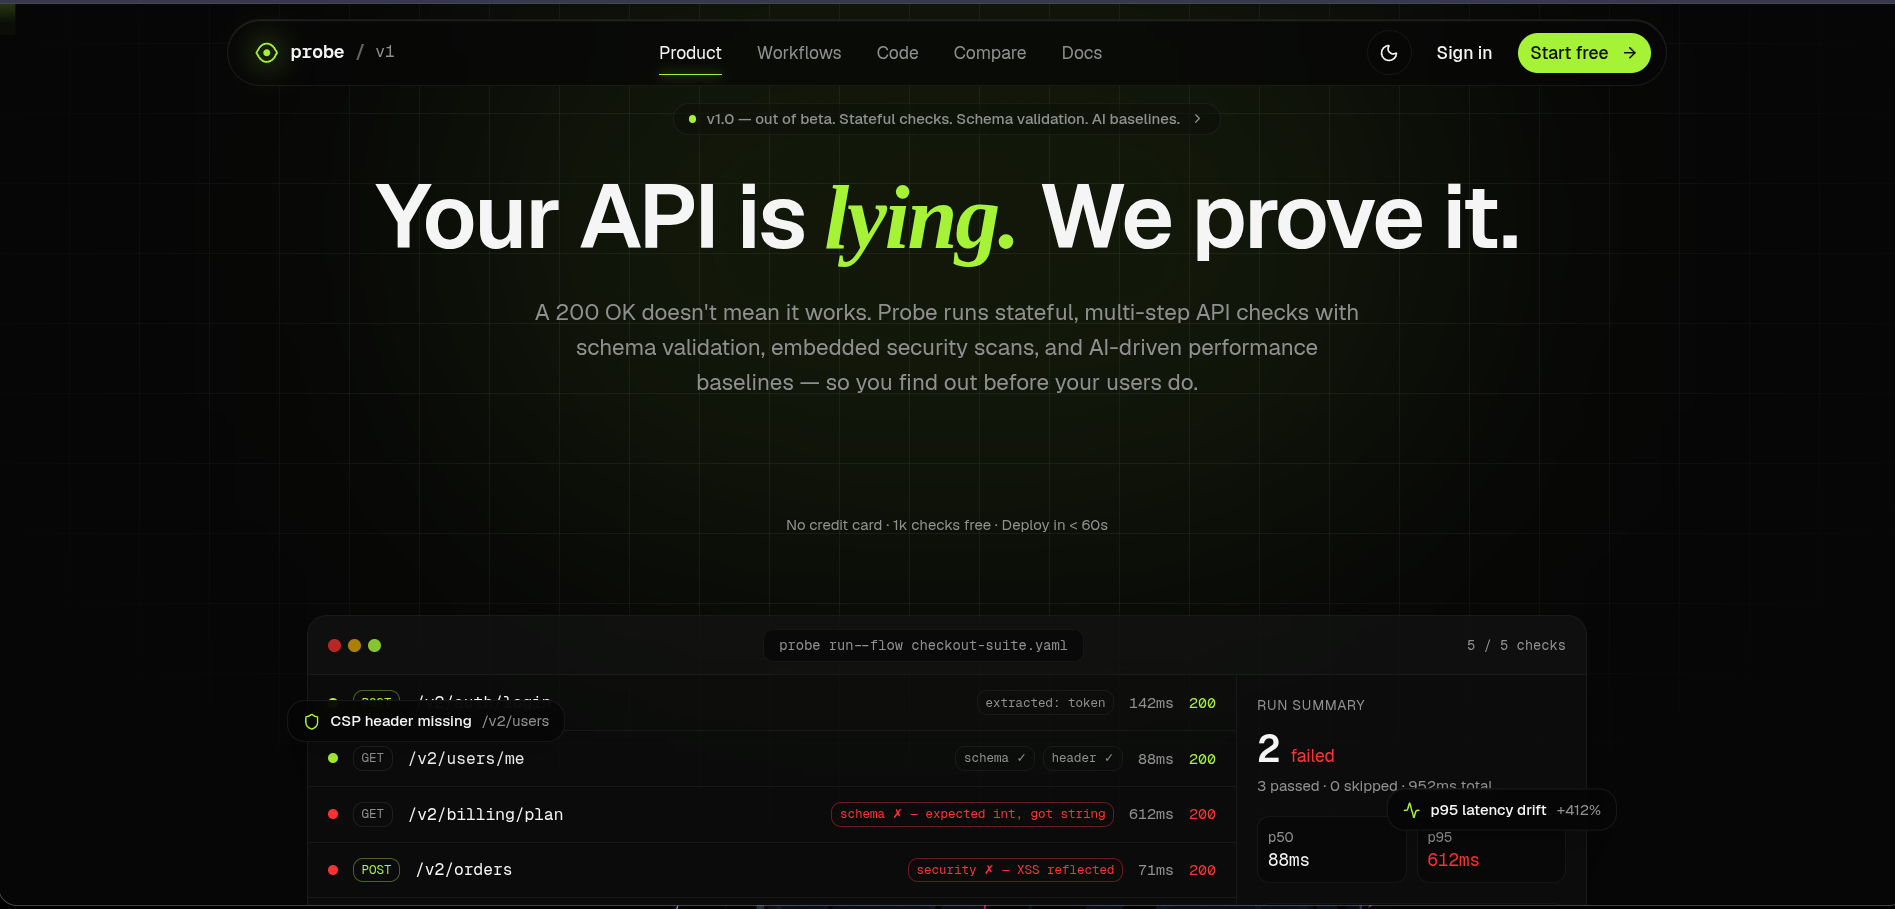
Your server returns a HTTP 200 OK status code, your uptime monitor shows a reassuring green checkmark, but your frontend is crashing because the response body is empty, the schema has drifted, or the latency has spiked to $4000\text{ms}$.
We realized that modern SRE monitoring tools are either too basic (pinging raw endpoints for status codes) or too complex (bloated enterprise platforms requiring heavy SDK integration). We built Probe.dev to prove that a 200 OK doesn't mean it works. We wanted a gorgeous, real-time, stateful API monitoring companion that developers actually love to look at, equipped with AI-powered diagnostic root-cause analysis.
What it does
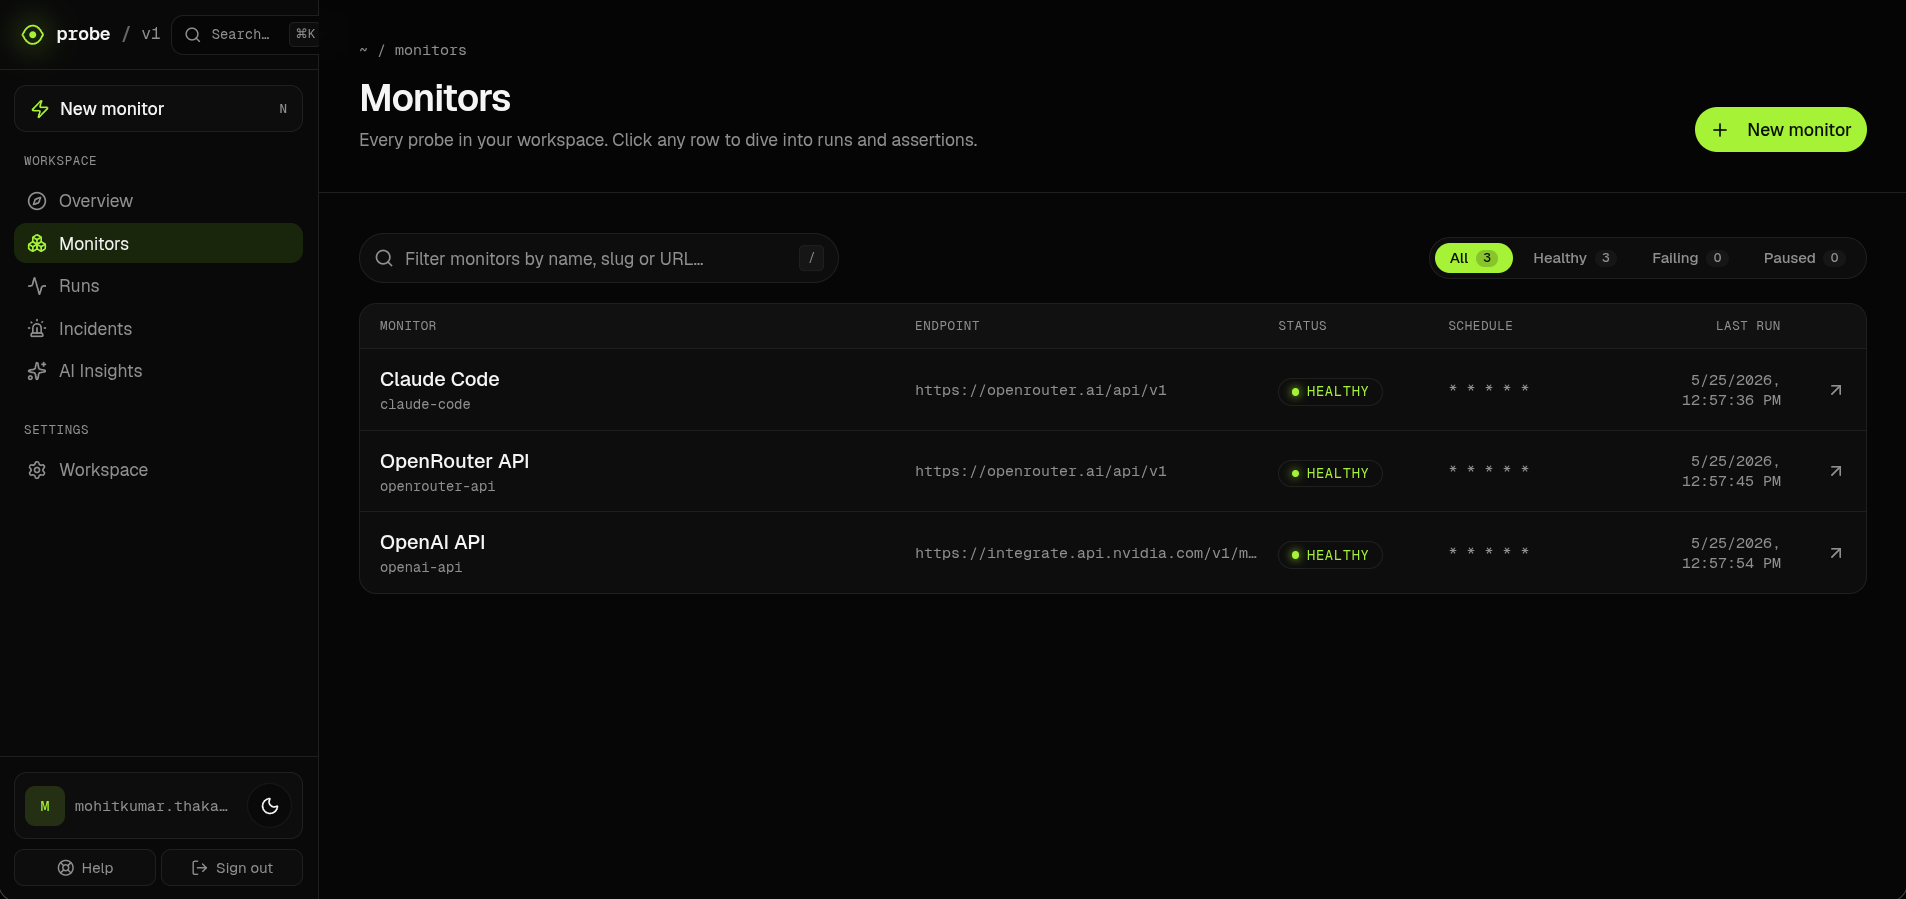
Probe is a real-time, multi-tenant API monitoring platform. It allows developers to:
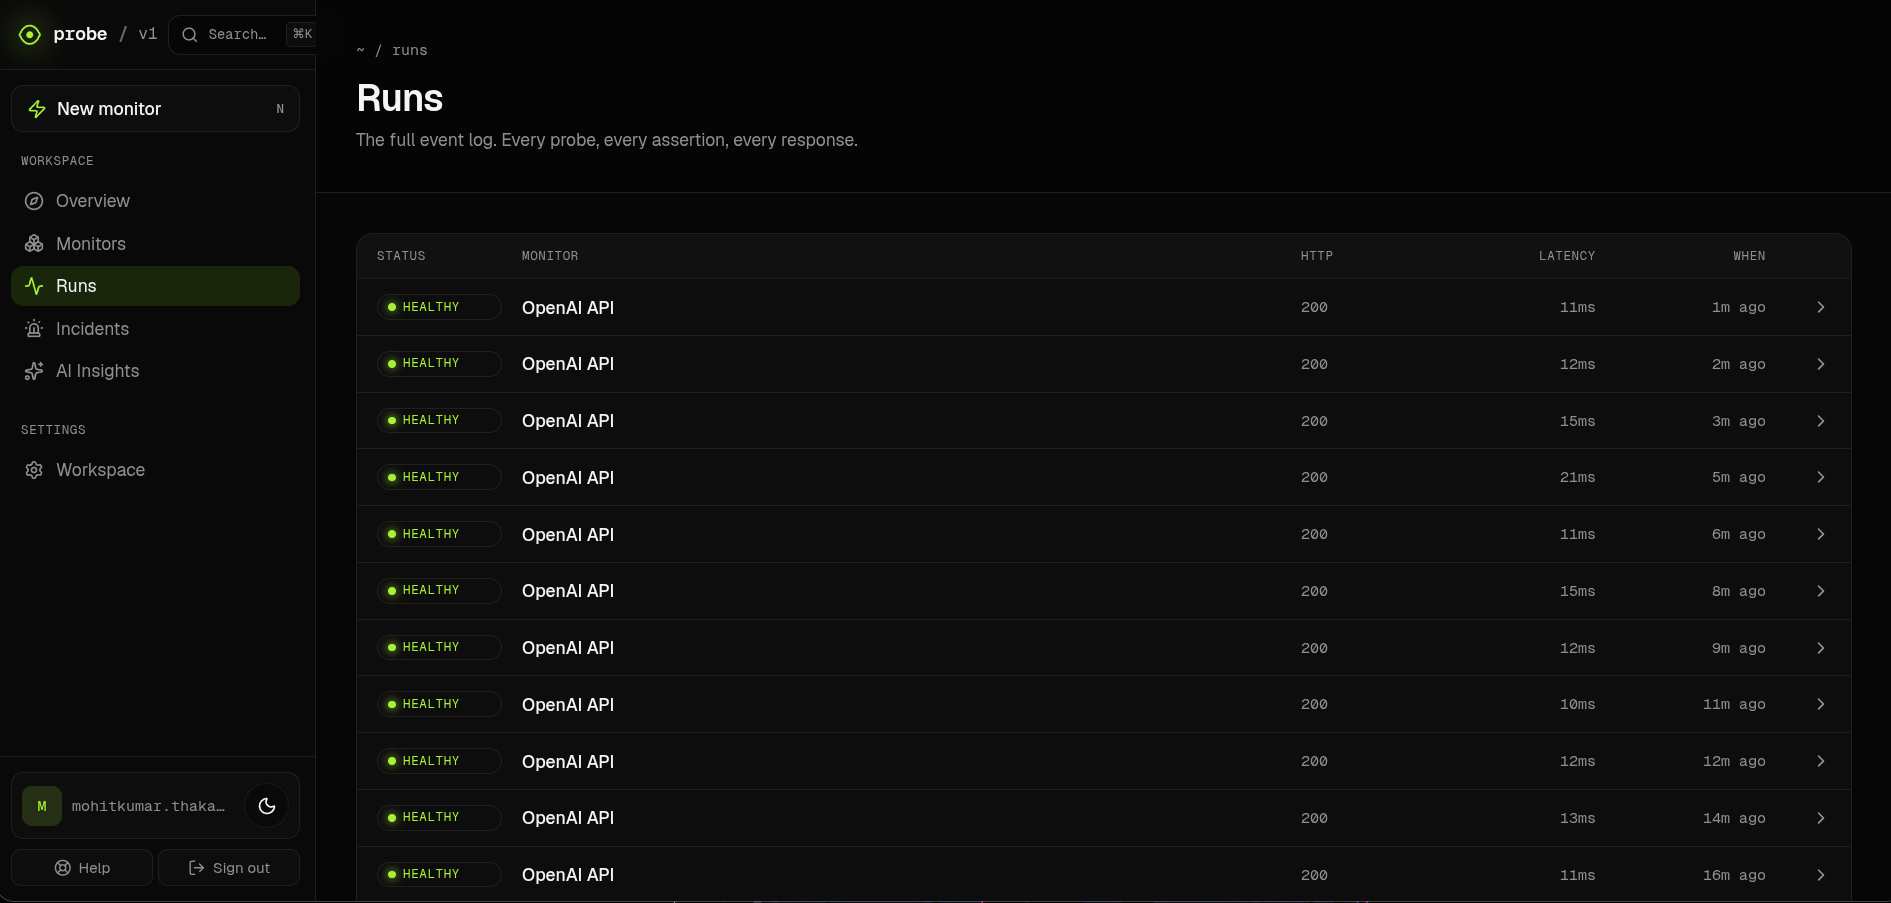
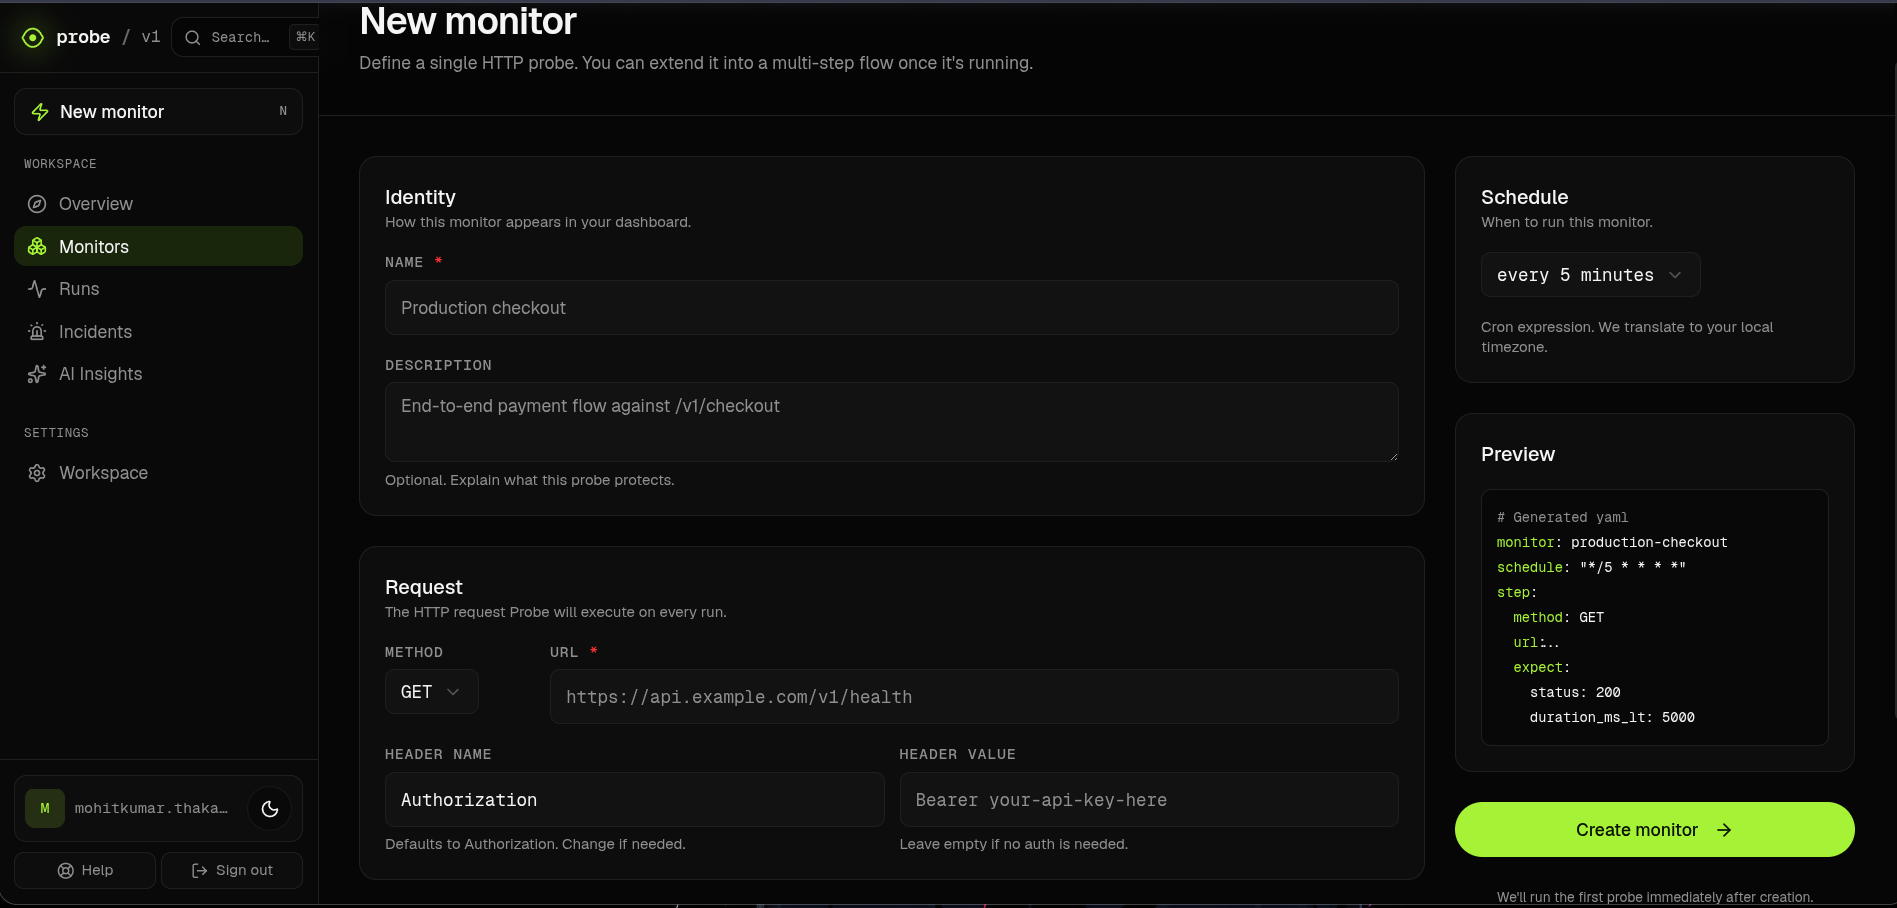
- Set up stateful multi-step API runs with strict HTTP response assertions (status codes, max latency, header validation, and JSON body matching).
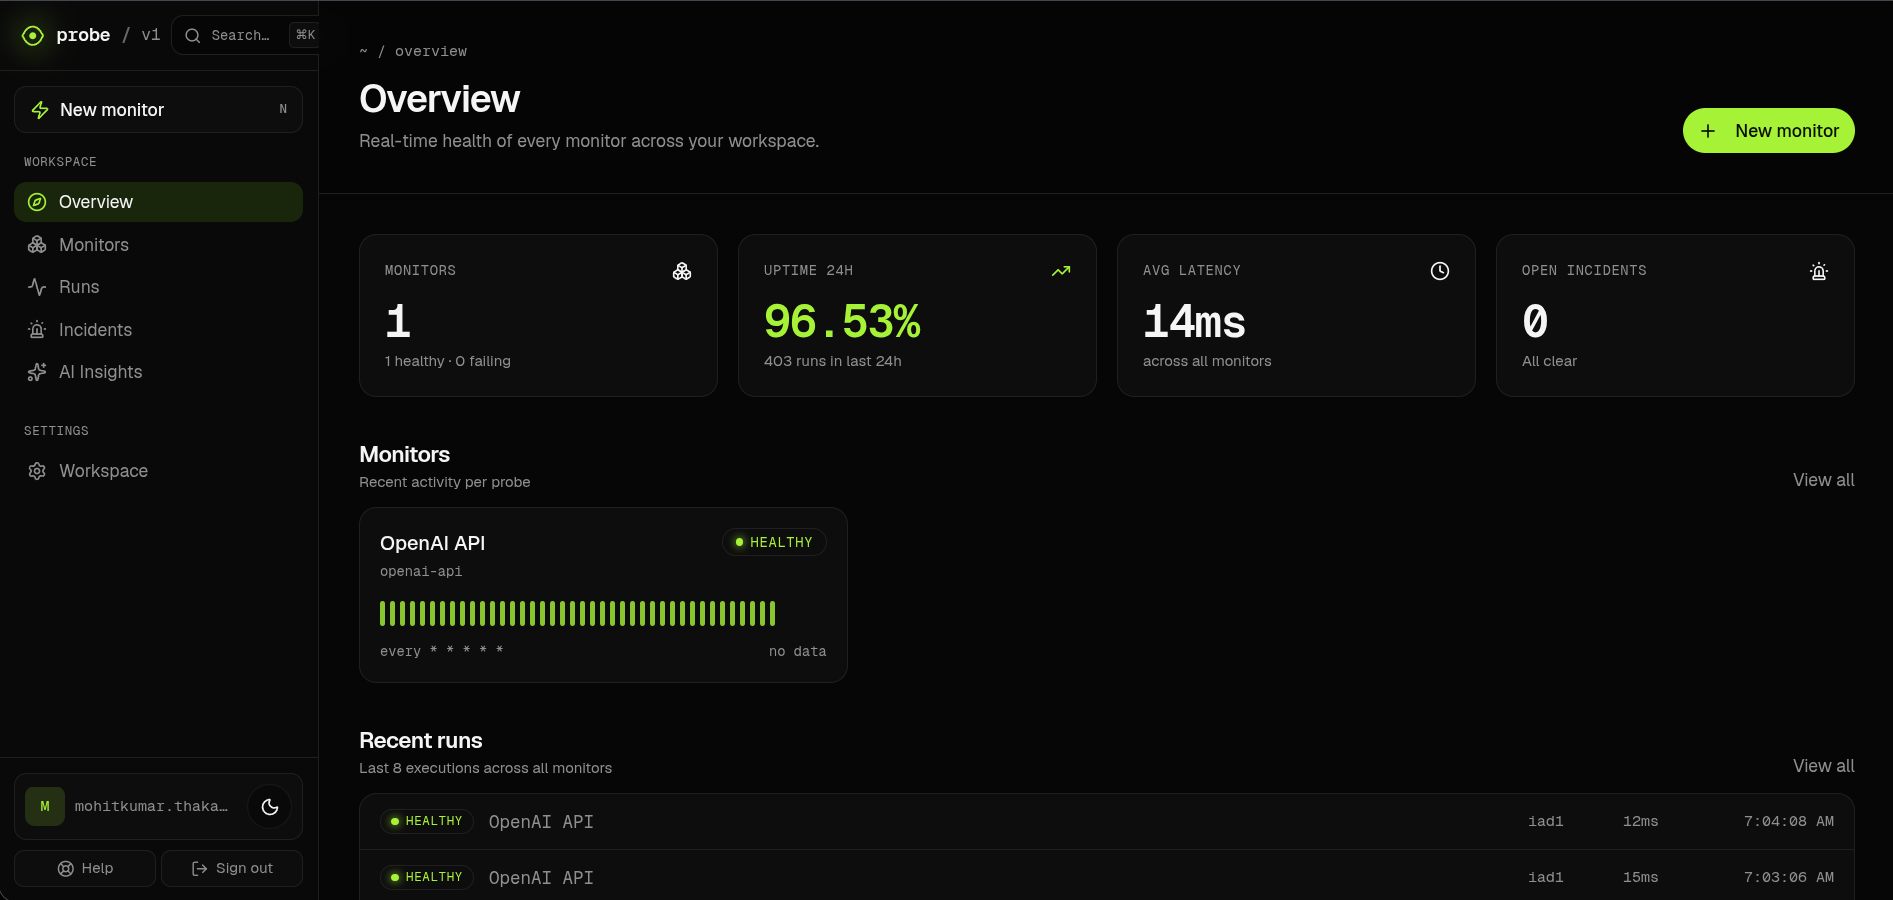
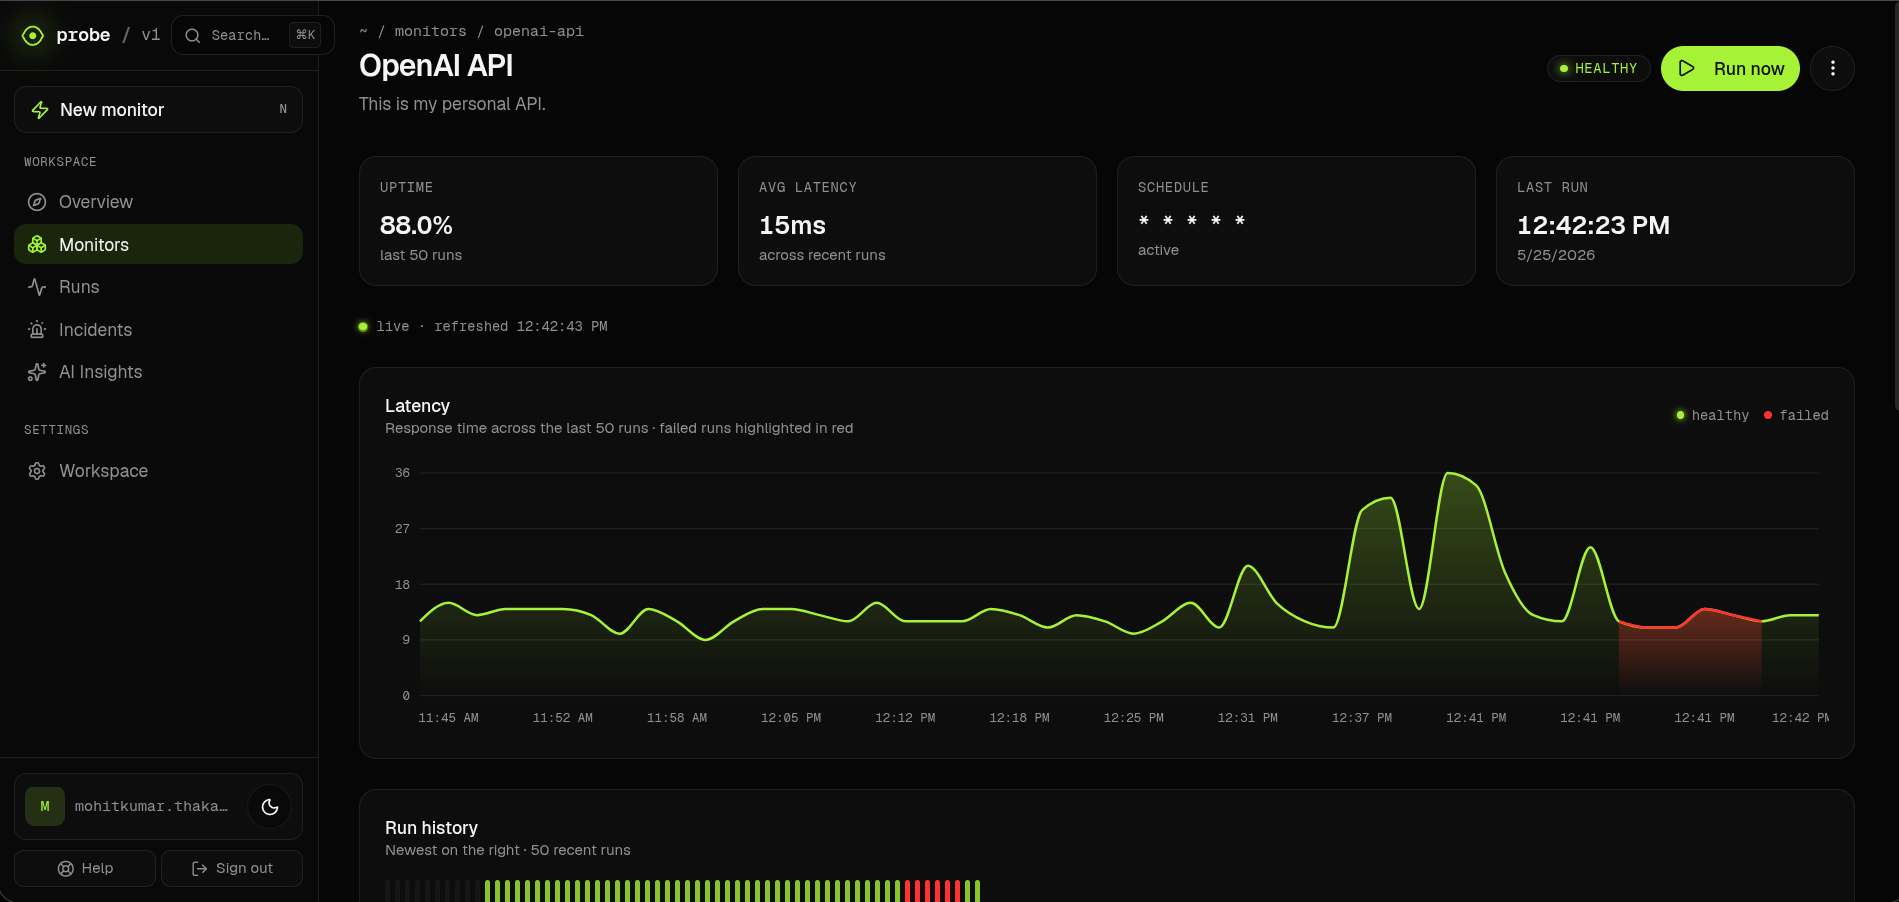
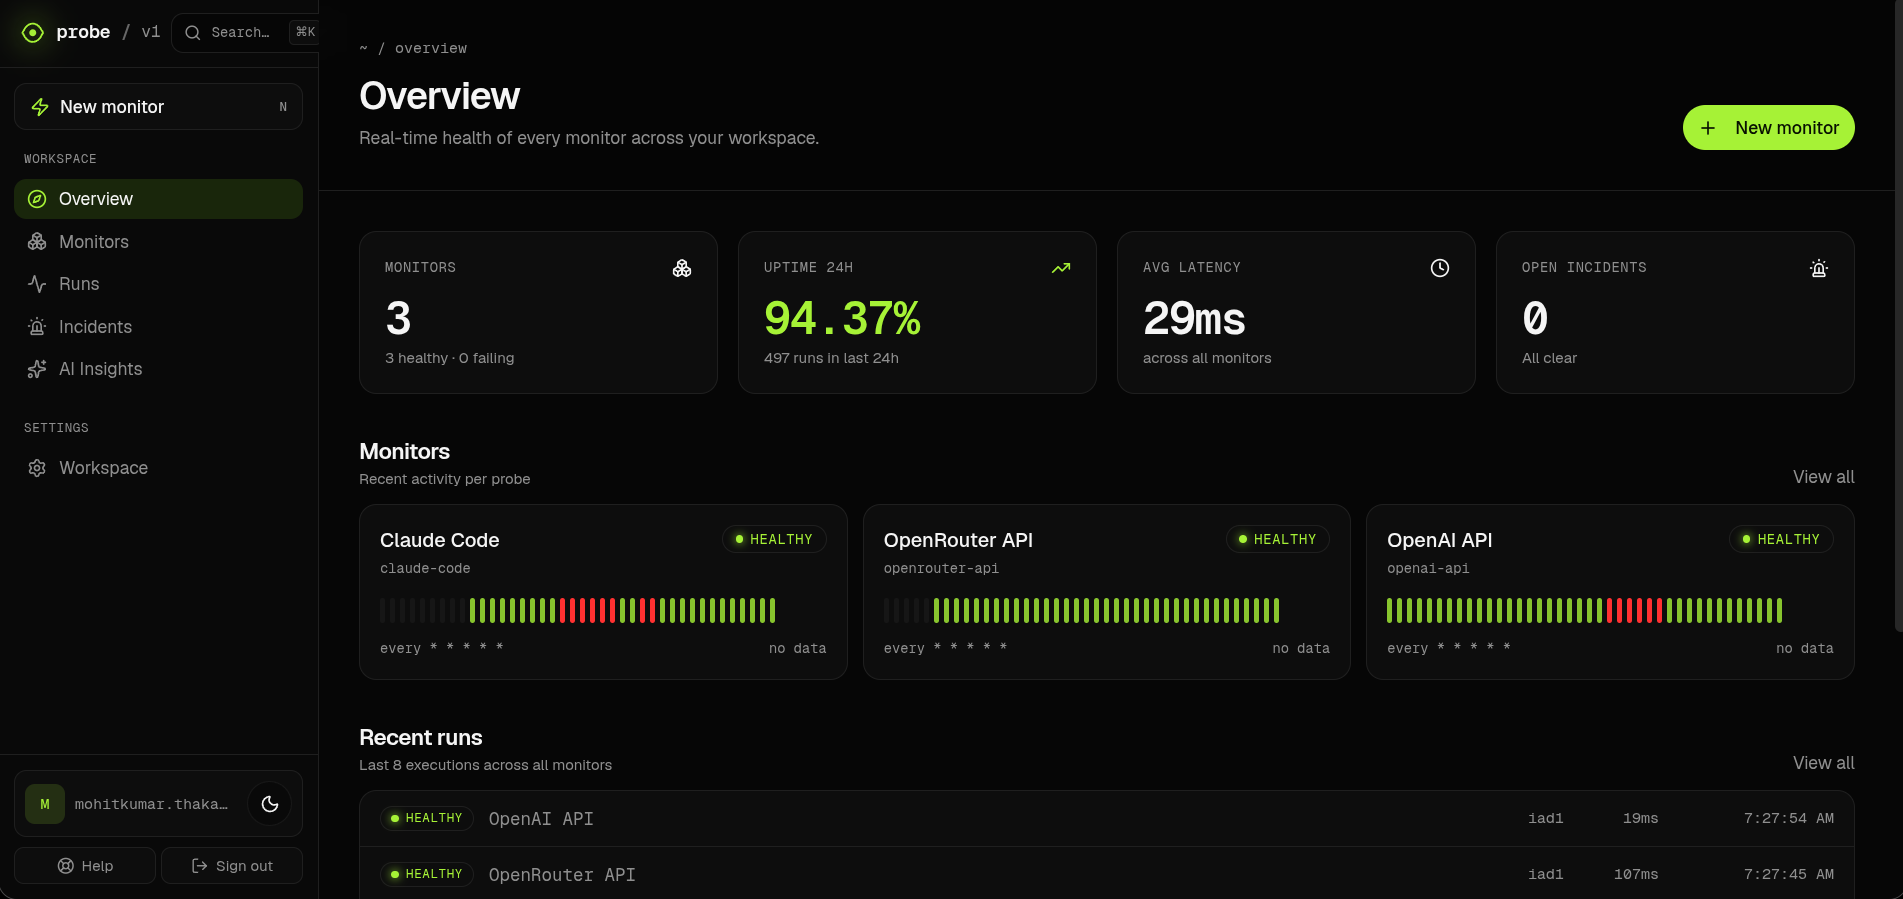
- Track real-time performance on a highly responsive, animated dashboard that auto-updates on every cron cycle.
- Generate public status boards with secure tokens that auto-refresh, allowing teams to transparently report uptime to users without exposing confidential authentication keys.
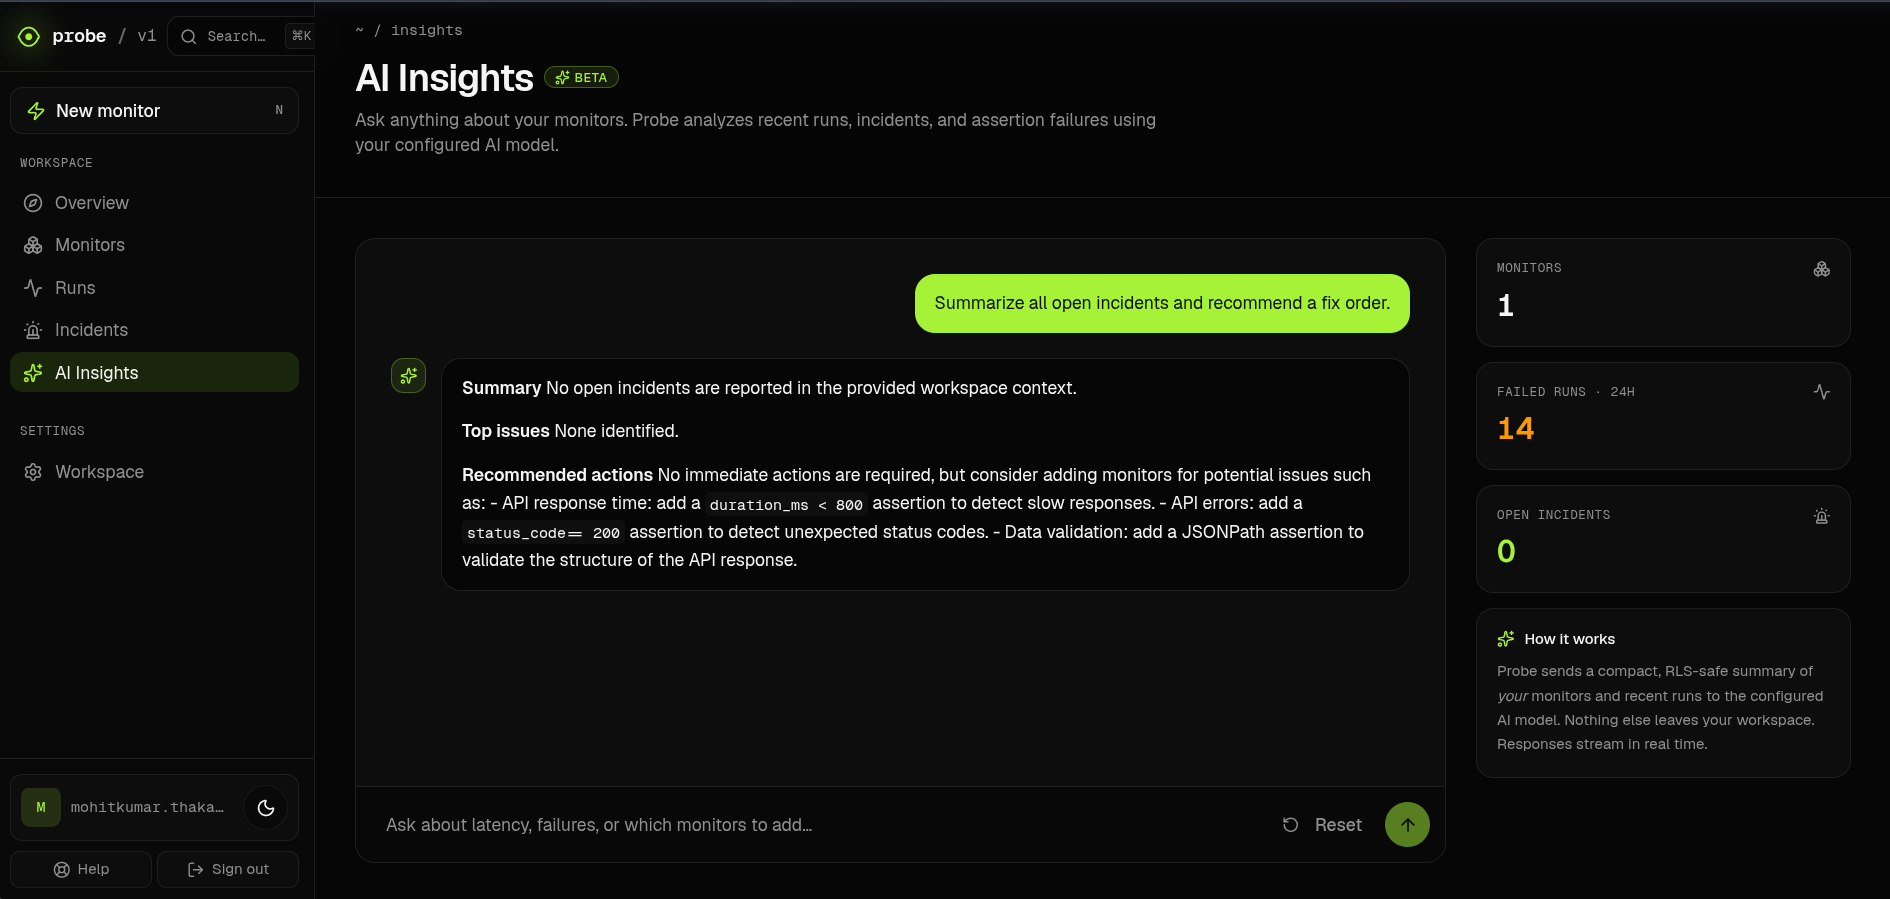
- Diagnose failures with SRE AI: If a probe fails, our SRE AI Assistant (powered by Llama 3.1 70B via NVIDIA NIM / OpenRouter) analyzes the raw execution logs, failed assertions, and system history to pinpoint the exact root cause in seconds.
How we built it
Probe was engineered with a state-of-the-art serverless stack designed to minimize latency and maximize developer control:
- Frontend & Router: Next.js (App Router) styled with deep dark-mode panel aesthetics, using GSAP for highly refined micro-animations (like the dynamic SLO uptime ring and batched run history charts).
- Backend & Cron Engine: Next.js Server Actions and Route Handlers coupled with a lightweight, secure cron pipeline triggered by external heartbeats.
- Database & Security: Supabase (Postgres) using deep Row-Level Security (RLS) to isolate multi-tenant data seamlessly at the database layer.
- Caching & Resilience: Upstash Redis acting as a lightweight, ephemeral rate-limiter and cross-step state manager.
- AI Stack: Integrated via the Vercel AI SDK with OpenRouter and NVIDIA NIM model endpoints.
Challenges we ran into
1. SSRF Outbound Request Protection
Allowing users to monitor custom API endpoints opens up severe Server-Side Request Forgery (SSRF) vulnerabilities. If a user entered a loopback or local network address, they could scan internal ports.
To solve this, we built a custom DNS resolver that validates outbound targets. Before making a request, we resolve the domain and check if the resulting IP belongs to private address spaces using the following constraint:
$$\text{IP} \notin \mathcal{P}_{\text{private}}$$
Where $\mathcal{P}_{\text{private}}$ is defined as:
$$\mathcal{P}_{\text{private}} = [10.0.0.0/8] \cup [172.16.0.0/12] \cup [192.168.0.0/16] \cup [169.254.0.0/16] \cup [127.0.0.0/8] \cup [::1/128]$$
If the resolved IP lands in any of these intervals, the connection is instantly aborted before a single socket opens.
2. High-Availability Cache Resilience
We originally designed our Upstash Redis client with synchronous static initialization. However, if a user's Upstash database went offline or had missing credentials, the entire server runtime crashed. We refactored our caching layers into a graceful fail-open singleton pattern. If Redis is unconfigured or unreachable, the application logs the warning but fails open safely, letting manual monitors run smoothly.
3. Real-Time Synchronization and Client Polling
Keeping server components, local dashboards, and public status pages updated in sync without building heavy WebSocket servers was tough. We solved this by pairing client-side polling hooks with a native browser custom event handler (probe:run-complete). When a user triggers an instant manual run, the client fires an event that immediately bypasses the polling clock to fetch fresh metrics instantly, updating the UI concurrently.
Accomplishments that we're proud of
- Instant manual execution: Triggering a live request, evaluating assertions, opening an incident in Supabase, and seeing the latency chart dynamically animate the new node in under a second.
- SSRF Safety & RLS Integration: Achieving a flawless security score where sensitive Bearer authorization keys are strictly handled on the server, while the public status page securely renders an anonymous sub-slice of the telemetry.
- AI Diagnostics: Ingesting complex, unstructured assertion failures and outputting accurate, highly technical SRE debug steps in real-time streaming markdown.
What we learned
- Next.js Server Actions resilience: How to wrap server execution and Next.js page revalidation boundaries in robust error catch blocks to prevent RSC runtime crashes.
- Form UX constraints: We learned that developer tool design must be extremely explicit. We fixed issues where placeholder text (like grayed-out header names) was mistaken for default inputs by replacing placeholders with true pre-filled default variables.
- Postgres Schema Design: Structuring clean transactional relationships between
monitors, telemetryruns, and openincidentsto auto-resolve statuses on successful recovery probes.
What's next for Probe.dev
- Notification Webhooks: Direct integrations with Slack, Discord, and PagerDuty to immediately alert SRE teams when an incident opens.
- End-to-End Synthetics: Going beyond simple HTTP requests to run headless browser tests, simulating real users logging in and interacting with a web app.
- AI Spec Scanning: Allowing users to upload their OpenAPI / Swagger specifications and letting our LLM auto-generate dozens of multi-step, stateful API monitors automatically.
Built With
- gsap
- lucide-react
- next.js
- nvidia-nim-api
- openrouter-api
- pnpm
- postgresql
- radix-ui
- react
- redis
- shadcn/ui
- sql
- supabase
- tailwind-css
- typescript
- upstash
- vercel
- vercel-ai-sdk


Log in or sign up for Devpost to join the conversation.