-
-
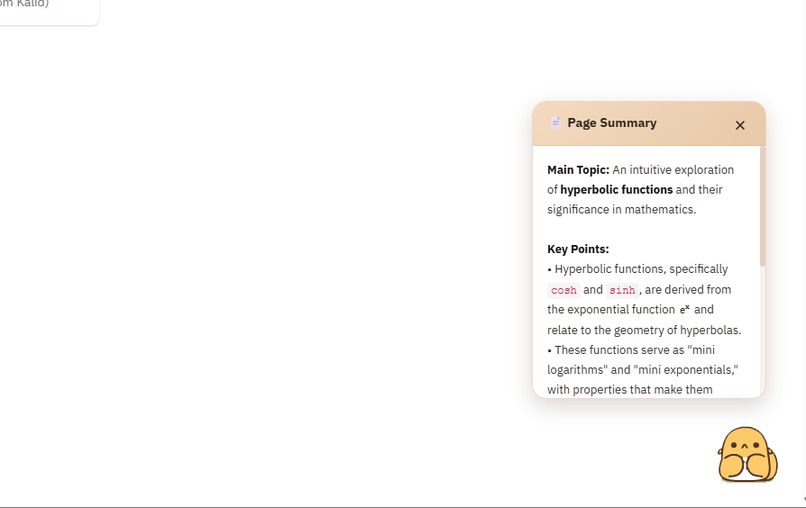
auto summary
-
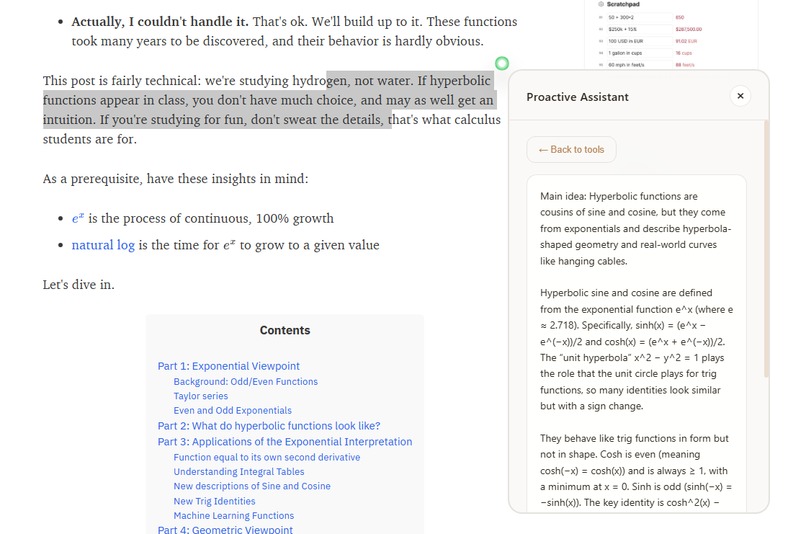
explainaiton
-
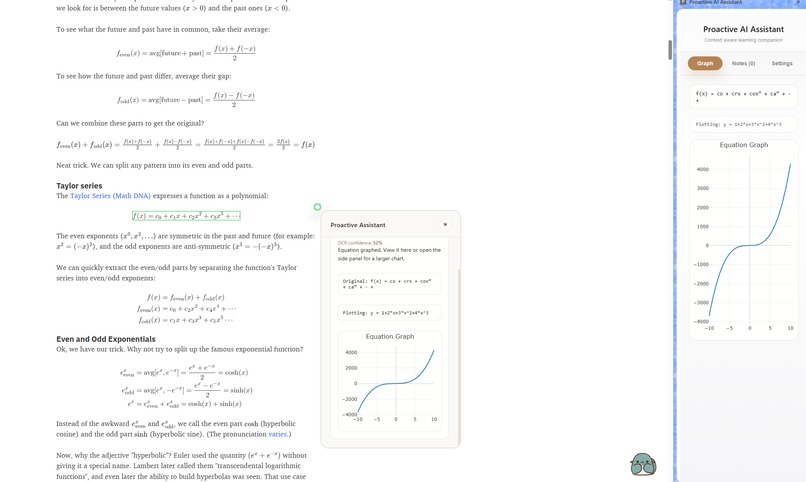
equation graph
-

Interactivity
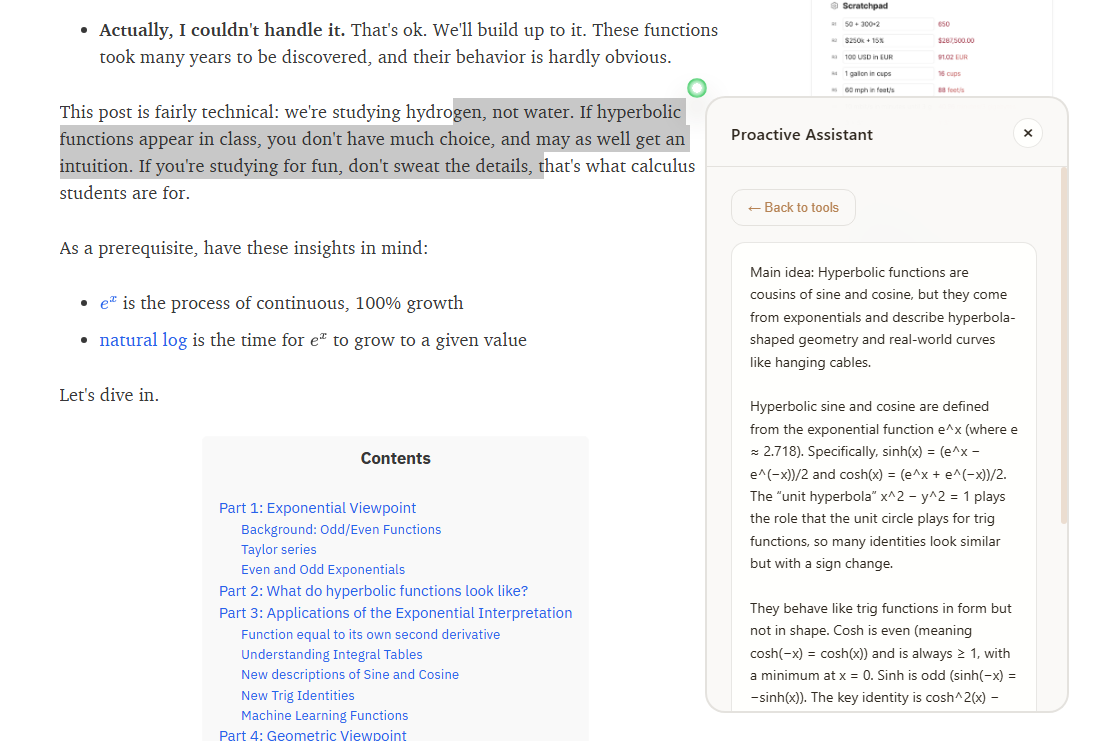

Inspiration We’ve all hit those “I wish I could just see this” moments while studying: reading about convex vs. concave functions, maxima/minima, or logistic curves and wanting an immediate graph. We wanted a lightweight, on‑page learning companion that appears when you need it—no context switching, no copy/paste into separate tools. The goal: make AI feel proactive and practical for learning—instant graphs for math, clear explanations for dense paragraphs, quick translations, and simple save‑to‑notes.
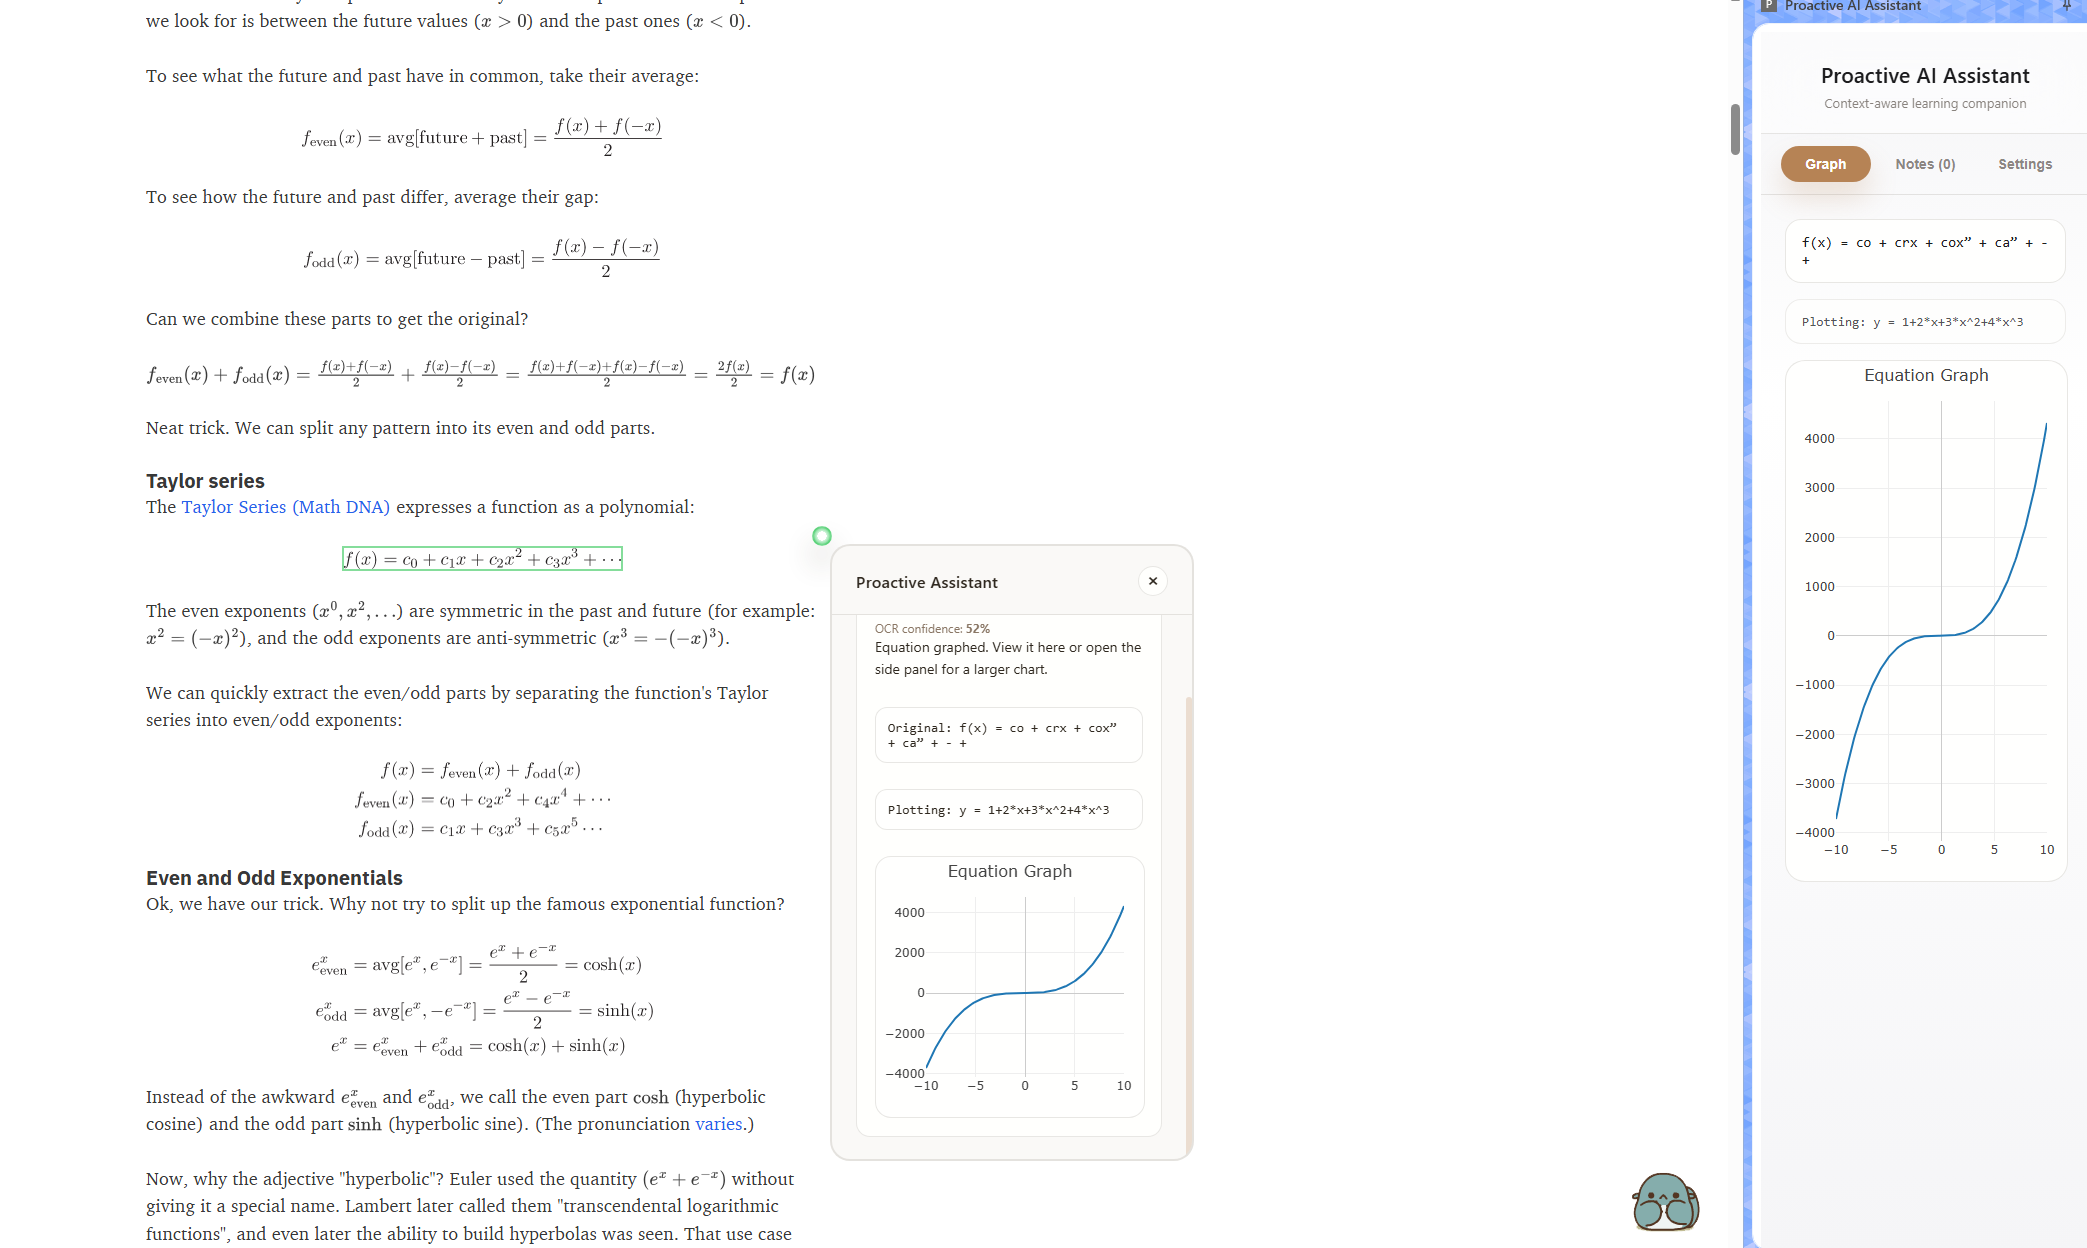
What it does Detects what you hover or select (text, images, equations, tables, code) and pops a small round icon, clicking the icon will trigger a small floating window with the tools that gpt-5 thinks is the best. e.g., typing or OCR’ing “y = x^2 − 3x + 2” gives you a live plot. e.g., offers “Explain,” “Summarize,” “Translate,” and “Save to Notes” for paragraphs. e.g., for code, “Explain/Debug/Improve”; for citations, “Get Paper.” A side panel provides a larger graph view, saved notes, and settings (including enter API key). The agent chooses the buttons based on detected content type plus an LLM ranker—so the UI stays relevant and uncluttered.
How we built it Chrome MV3 extension with a content script that watches selections and DOM context, then injects a React UI in an iframe as a floating window and a React side panel for richer views. Content analysis heuristics: detect math, plottable patterns, code, tables, citations, URLs, foreign language, and images (including background images, canvas, and SVG). For images, we add an OCR badge to opt‑in extraction. Tool ranking: an OpenAI Responses call returns up to 4 tool IDs via a strict JSON schema, with caching + graceful fallbacks when offline or rate‑limited. Graphing pipeline: Accept raw math (including noisy OCR like “ln(1+e^x)”, “f(x)=...”, or LaTeX fragments). Use an LLM step to normalize to explicit functions of x (e.g., “y = ln(1+exp(x))”). Safeguard with a local fallback sanitizer and math.js to evaluate expressions and generate Plotly traces over a default x‑range. Persist graph data in chrome.storage.local and signal the side panel to render via Plotly. OCR: Tesseract.js worker (CDN) with progress logging; only runs on explicit user action for performance and UX clarity. UI and Virtual Pet: We reuse some online resource, and did most of the animation by gif edition of Photoshop
Message choreography: Content script ↔ floating iframe for UI state and drag/position events. Content script ↔ background service worker for tool suggestions and execution. Background ↔ side panel for rendering graph payloads and managing notes/settings.
Challenges we ran into: First-time extension dev: For four of us, this was our first Chrome extension. Manifest V3 felt very different from traditional frontend apps—service workers sleep, have no DOM, and debug in a separate DevTools. Logs vanish on reload; hot‑reloading is not the same; we had to learn chrome://extensions and service worker debugging flows. OCR messiness: noisy Unicode, mixed function notation, and partial LaTeX. We built normalization rules and an LLM “equation cleanup” step, plus a math.js fallback to stay robust. Click‑through UX: balancing a clickable floating UI with seamless page interaction required careful pointer‑events, z-indexing, and cross‑window event routing. Tool ranking reliability: schema‑constrained outputs reduce hallucinations; we still needed caching, timeouts, and deterministic fallbacks by content type. MV3 constraints: service worker lifecycle, web_accessible_resources, and side panel behavior needed iteration to keep startup latency low and messaging reliable. Performance: avoiding re‑OCR during quick hovers, debouncing selection events, and containing Plotly renders in the side panel for heavy plots.
Accomplishments that we’re proud of End‑to‑end “select equation → see graph” flow that works on both clean text and OCR’d formulas: e.g., $$y = \cos(x) + \sin(x)$$ or $$y = \ln(1 + e^{x}).$$ A context‑aware assistant that feels helpful, not noisy—the floating window shows only the most relevant tools. A resilient graphing pipeline with LLM normalization plus local math.js fallback to handle real‑world messy input. Clean, draggable floating UI and a polished side panel experience with instant notes and settings. A clear, extensible tool catalog and prompt strategy that makes adding new tools straightforward. A user-friendly UI with cuteness and interactivity.
What we learned Pairing lightweight heuristics with an LLM ranker yields reliable UX: heuristics gate obvious cases; the model refines choices. Structured outputs (JSON schema) and layered fallbacks are essential for production‑like stability. MV3 messaging and UI injection patterns benefit from strict separation of concerns: content analysis in the content script, network/AI in the background, rendering in iframe/side panel. Math is unforgiving: subtle symbol normalizations, domain assumptions, and parameter defaults matter for plotting to “just work.” OCR on the open web is noisy—clear affordances (badges, progress) make it feel intentional rather than random.
What’s next for Proactive-AI Math upgrades: 3D plots, parameter sliders, and multi‑curve overlays; better LaTeX parsing and direct MathJax/KaTeX integration. Richer study tools: inline highlights/annotations, spaced‑repetition export, and cite‑as‑you‑go bibliography. Smarter data tools: auto‑detect tables, quick charts, and CSV/Sheets export with one click. Model options: on‑device or private endpoints, cost/latency controls, and better offline fallbacks. Security and polish: Chrome Web Store release.
Built With
- chrome
- graph
- latex
- openai
- react
- typescript


Log in or sign up for Devpost to join the conversation.