-
-
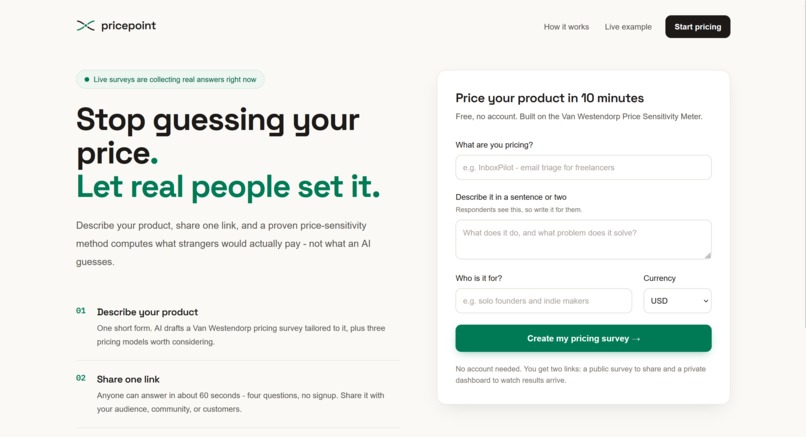
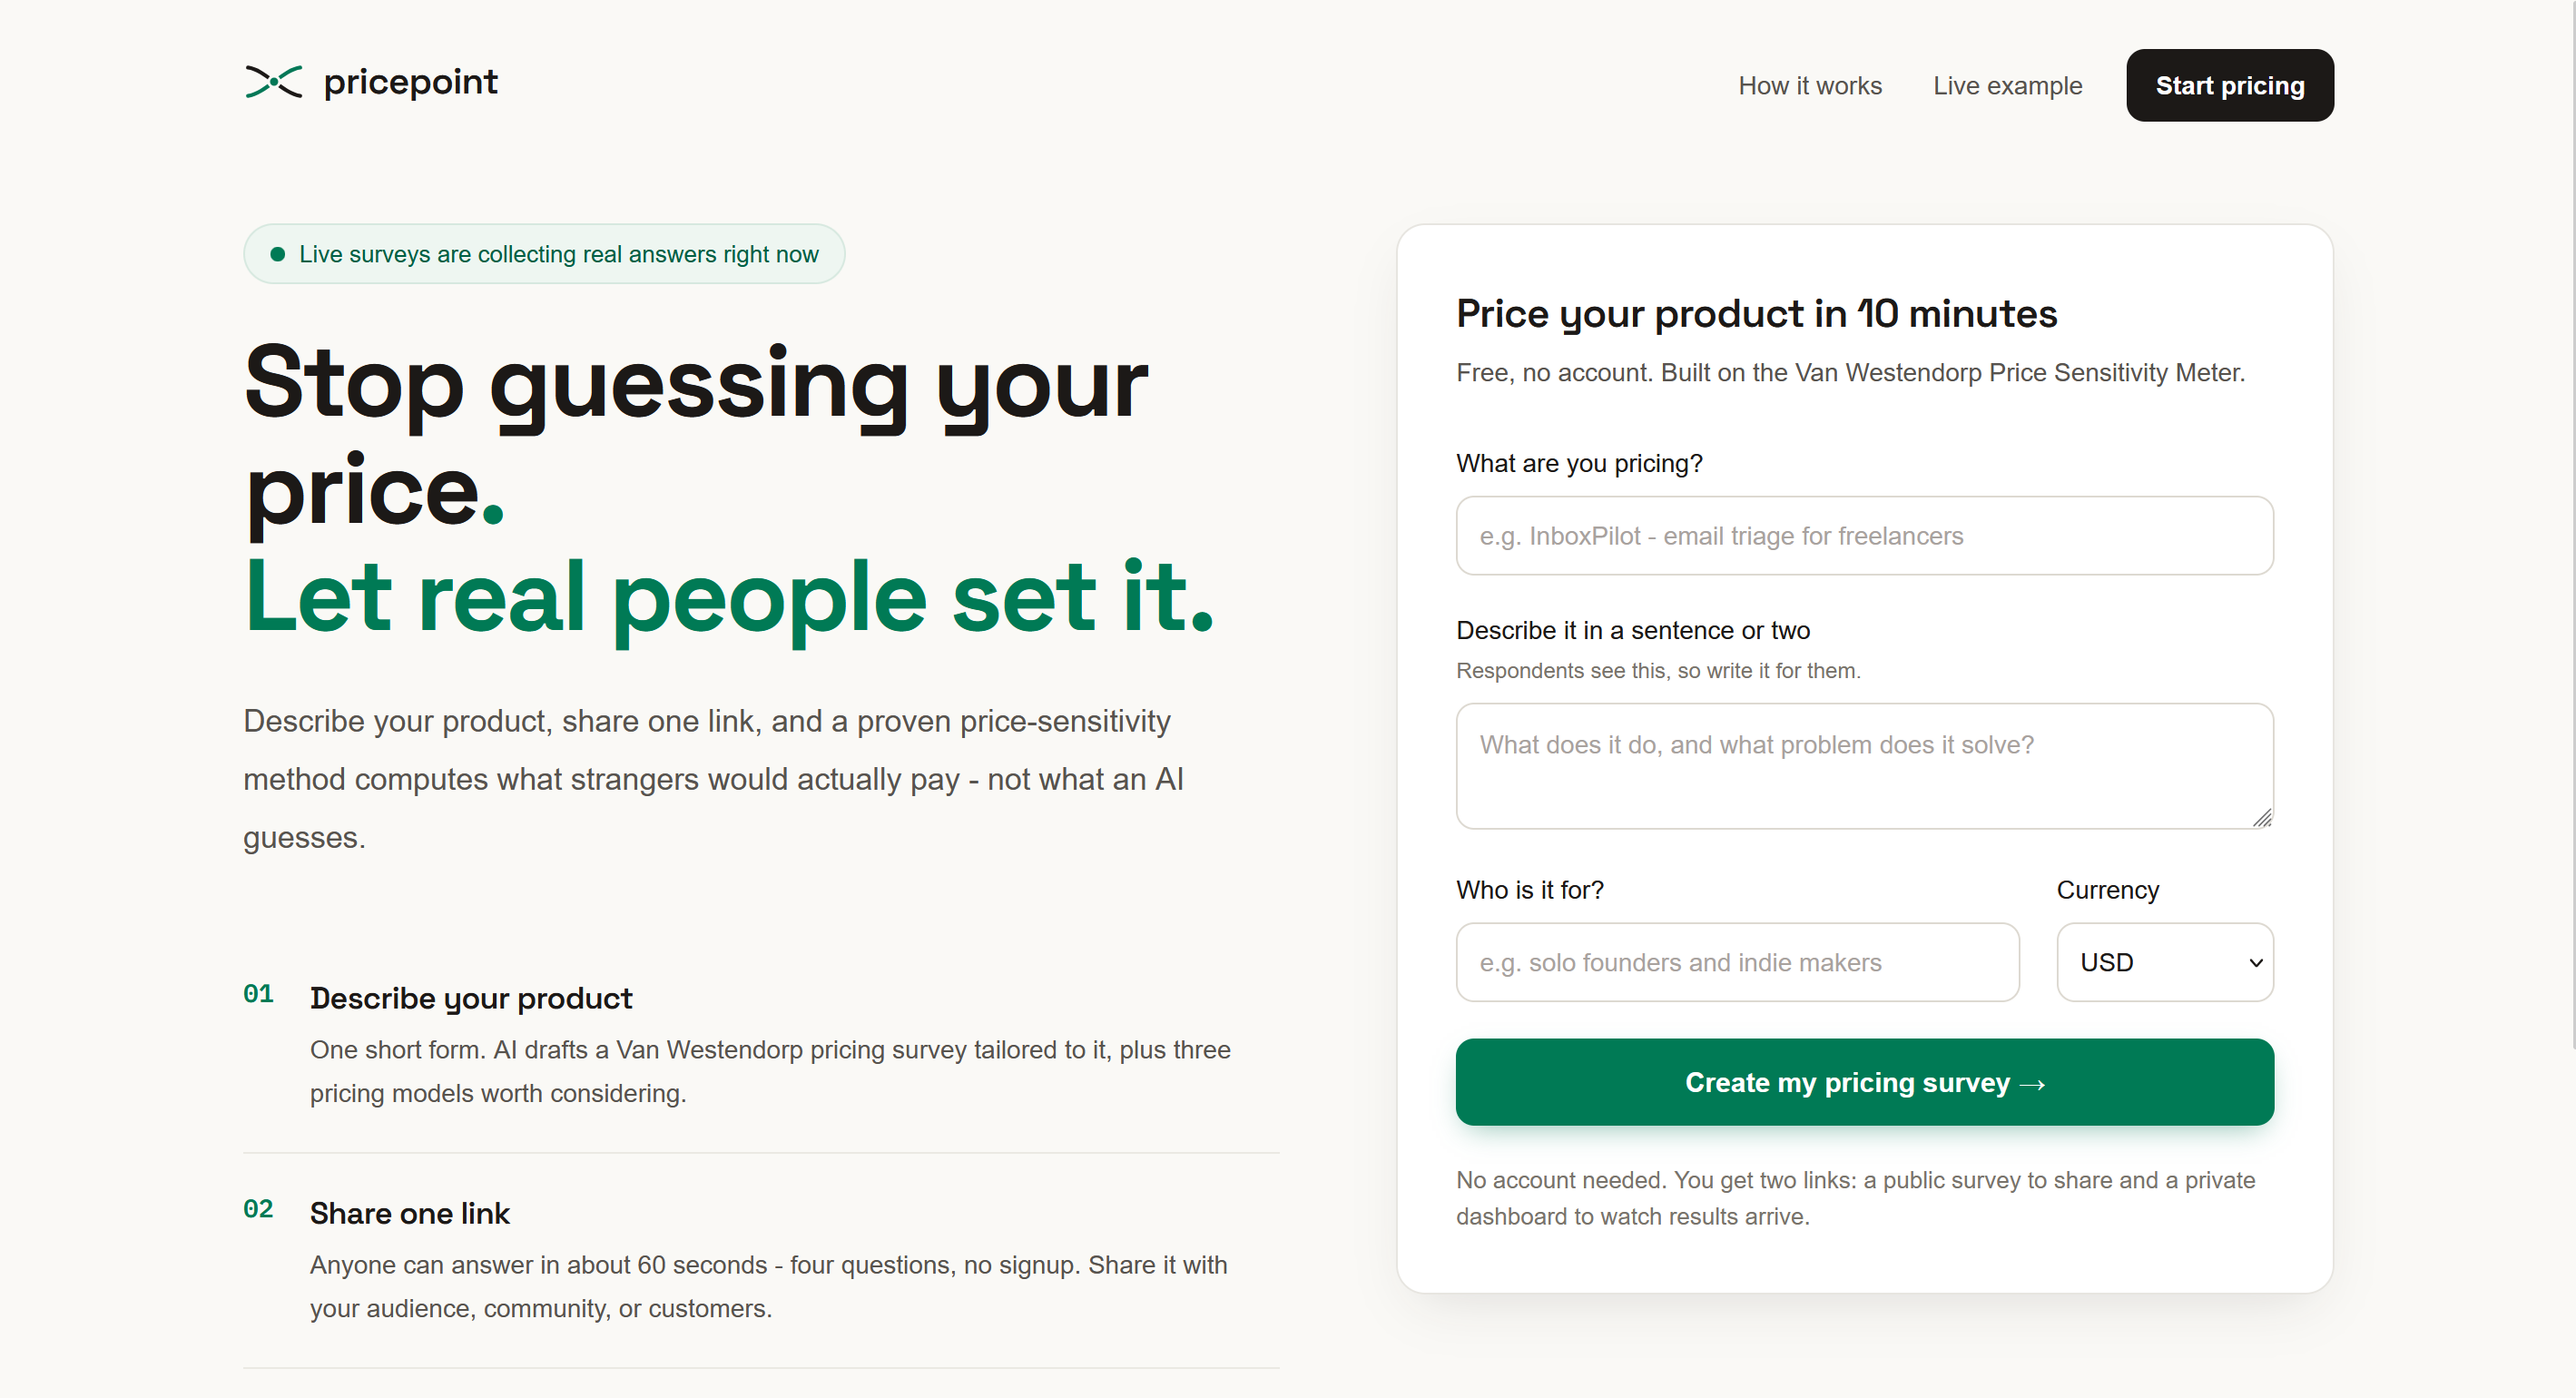
Describe your product, share one link, and let real people set your price. Not an AI's opinion, a measured one.
-
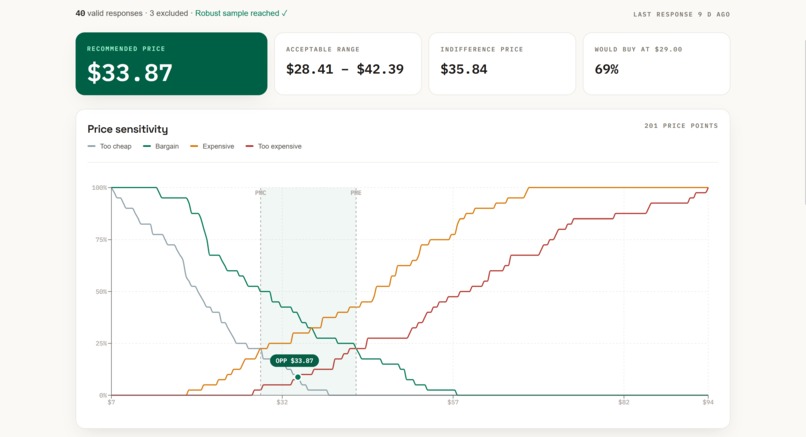
The live dashboard. Four Van Westendorp curves compute the optimal price, acceptable range, and who would actually buy.
-
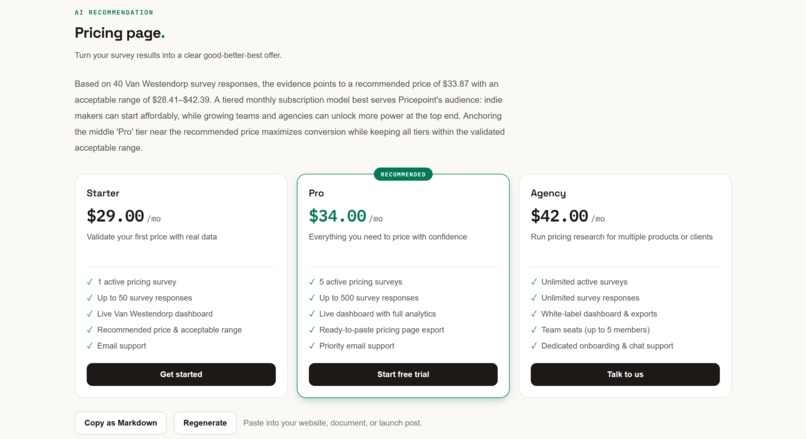
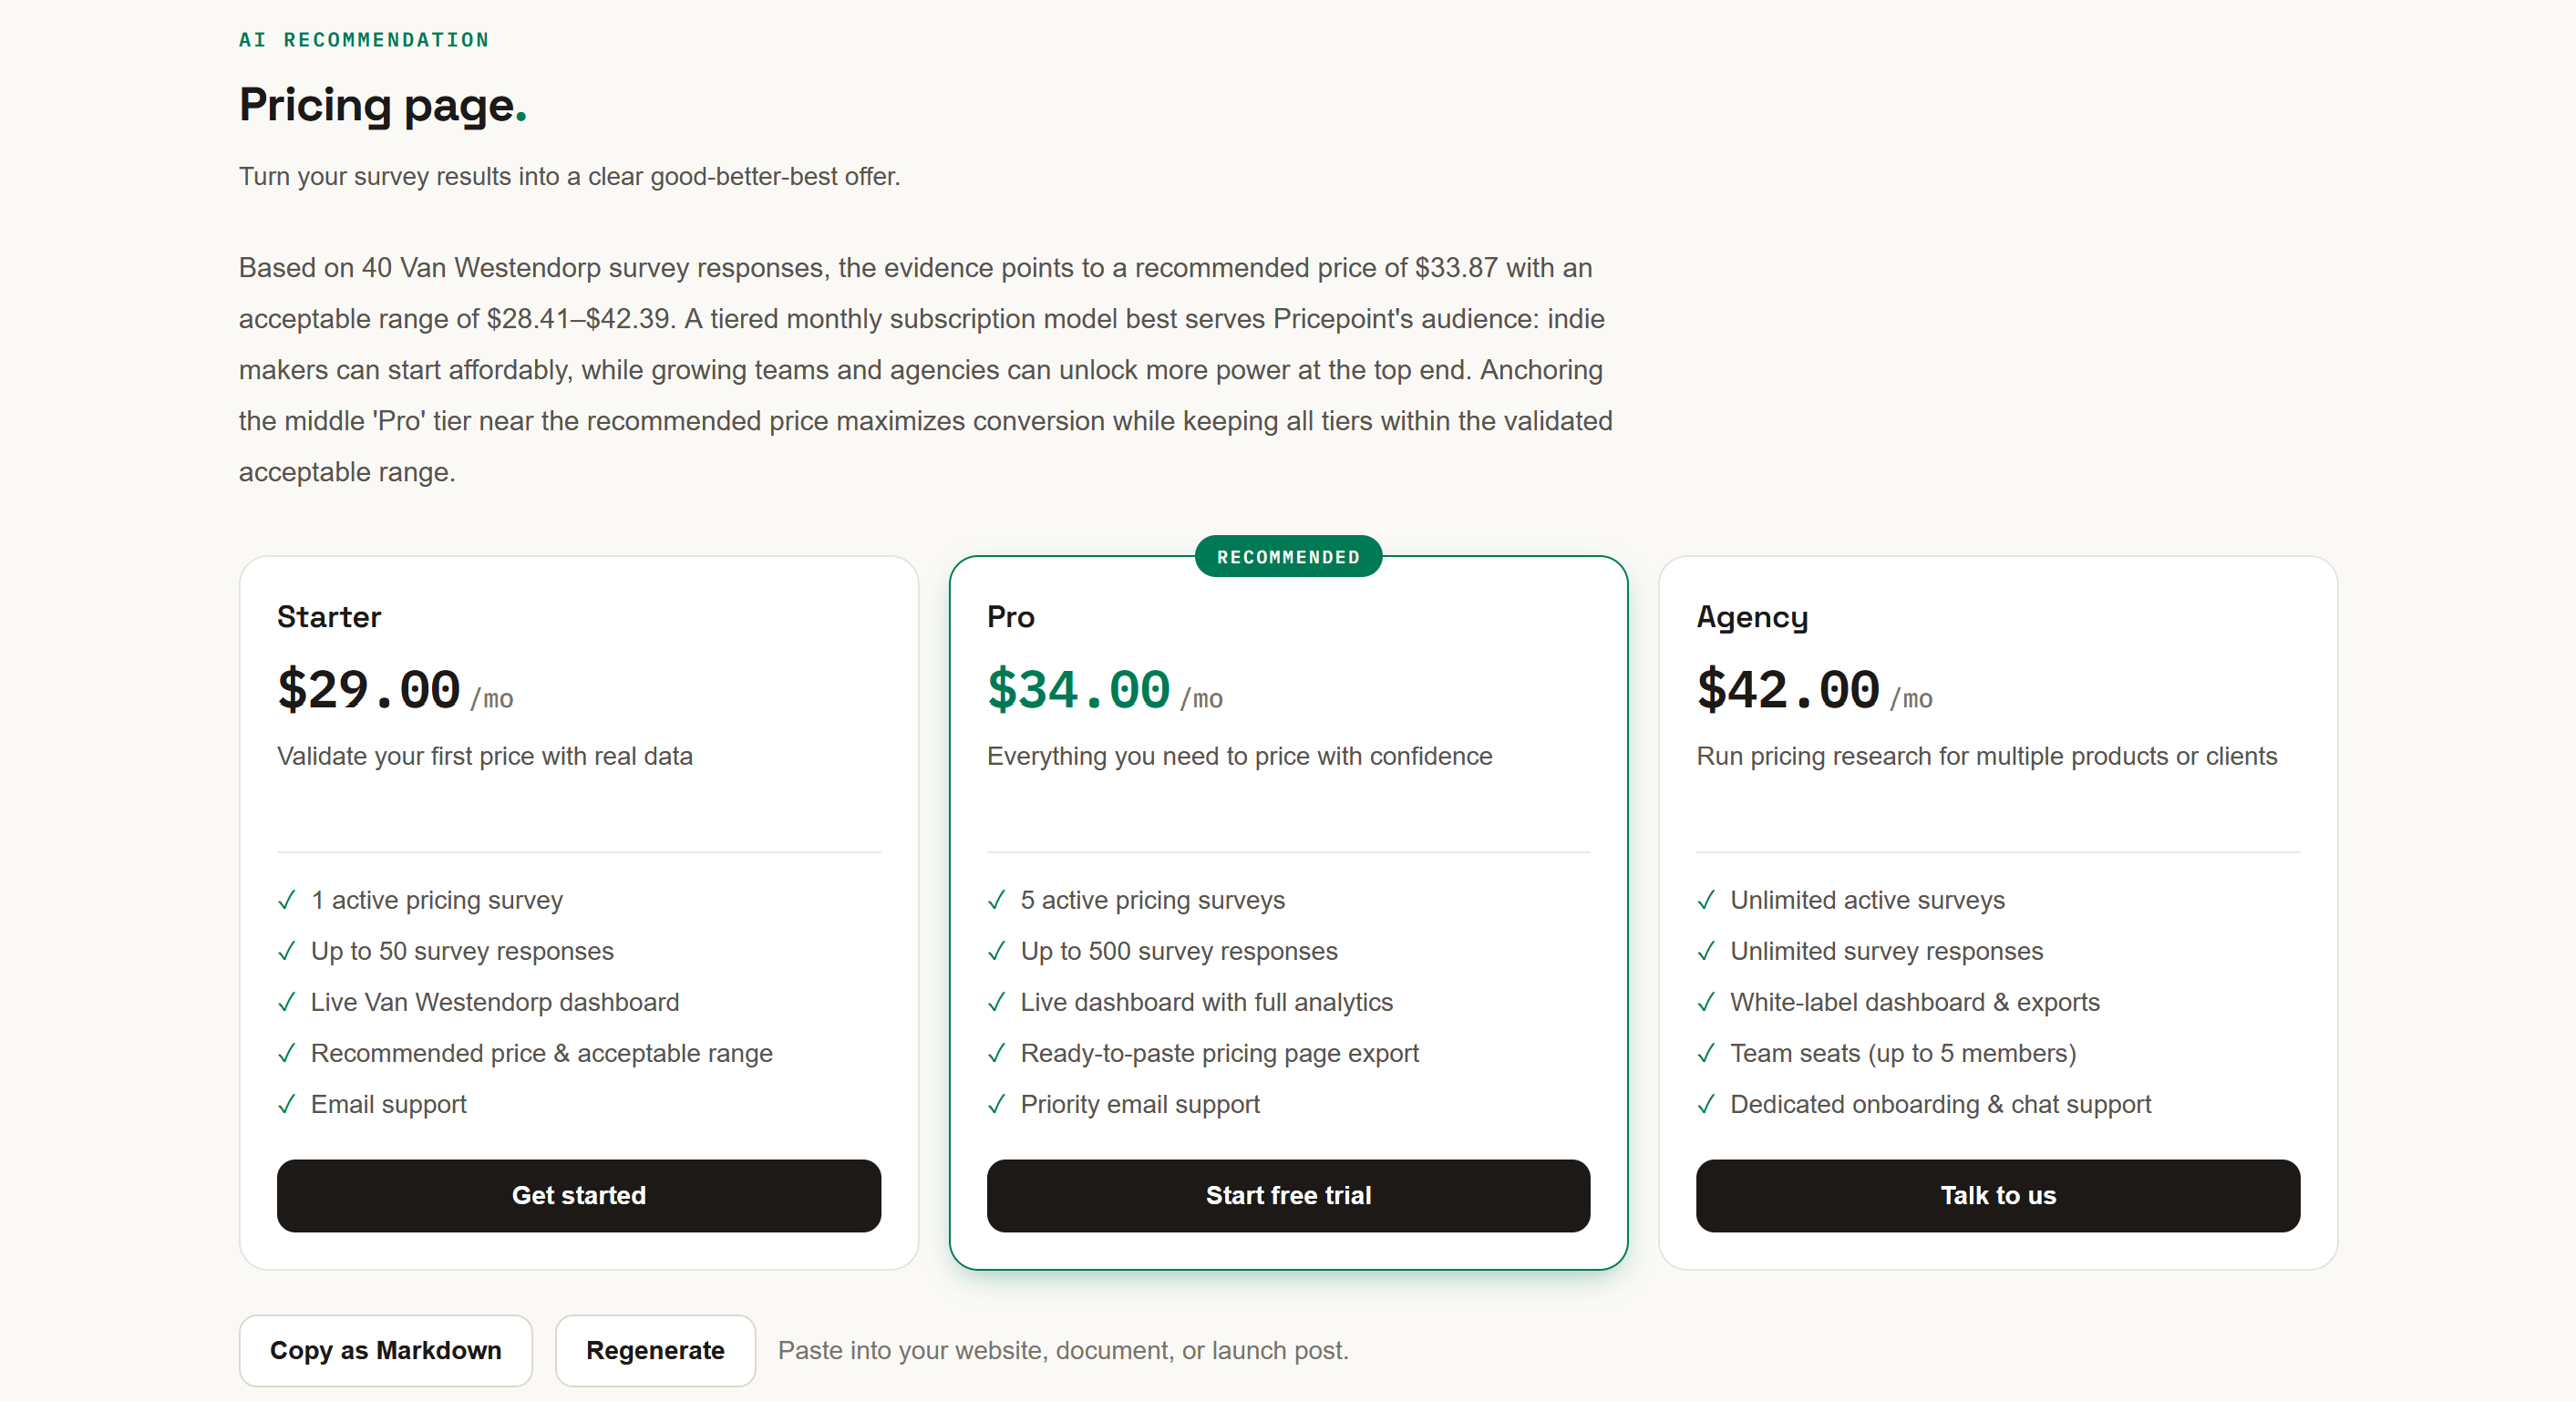
One click turns responses into a ready-to-paste pricing page: three data-anchored tiers, recommended one flagged, copyable as Markdown.
-
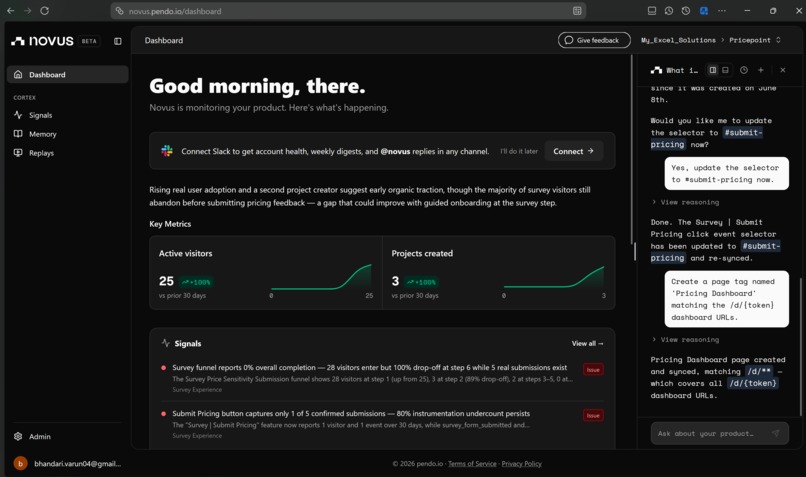
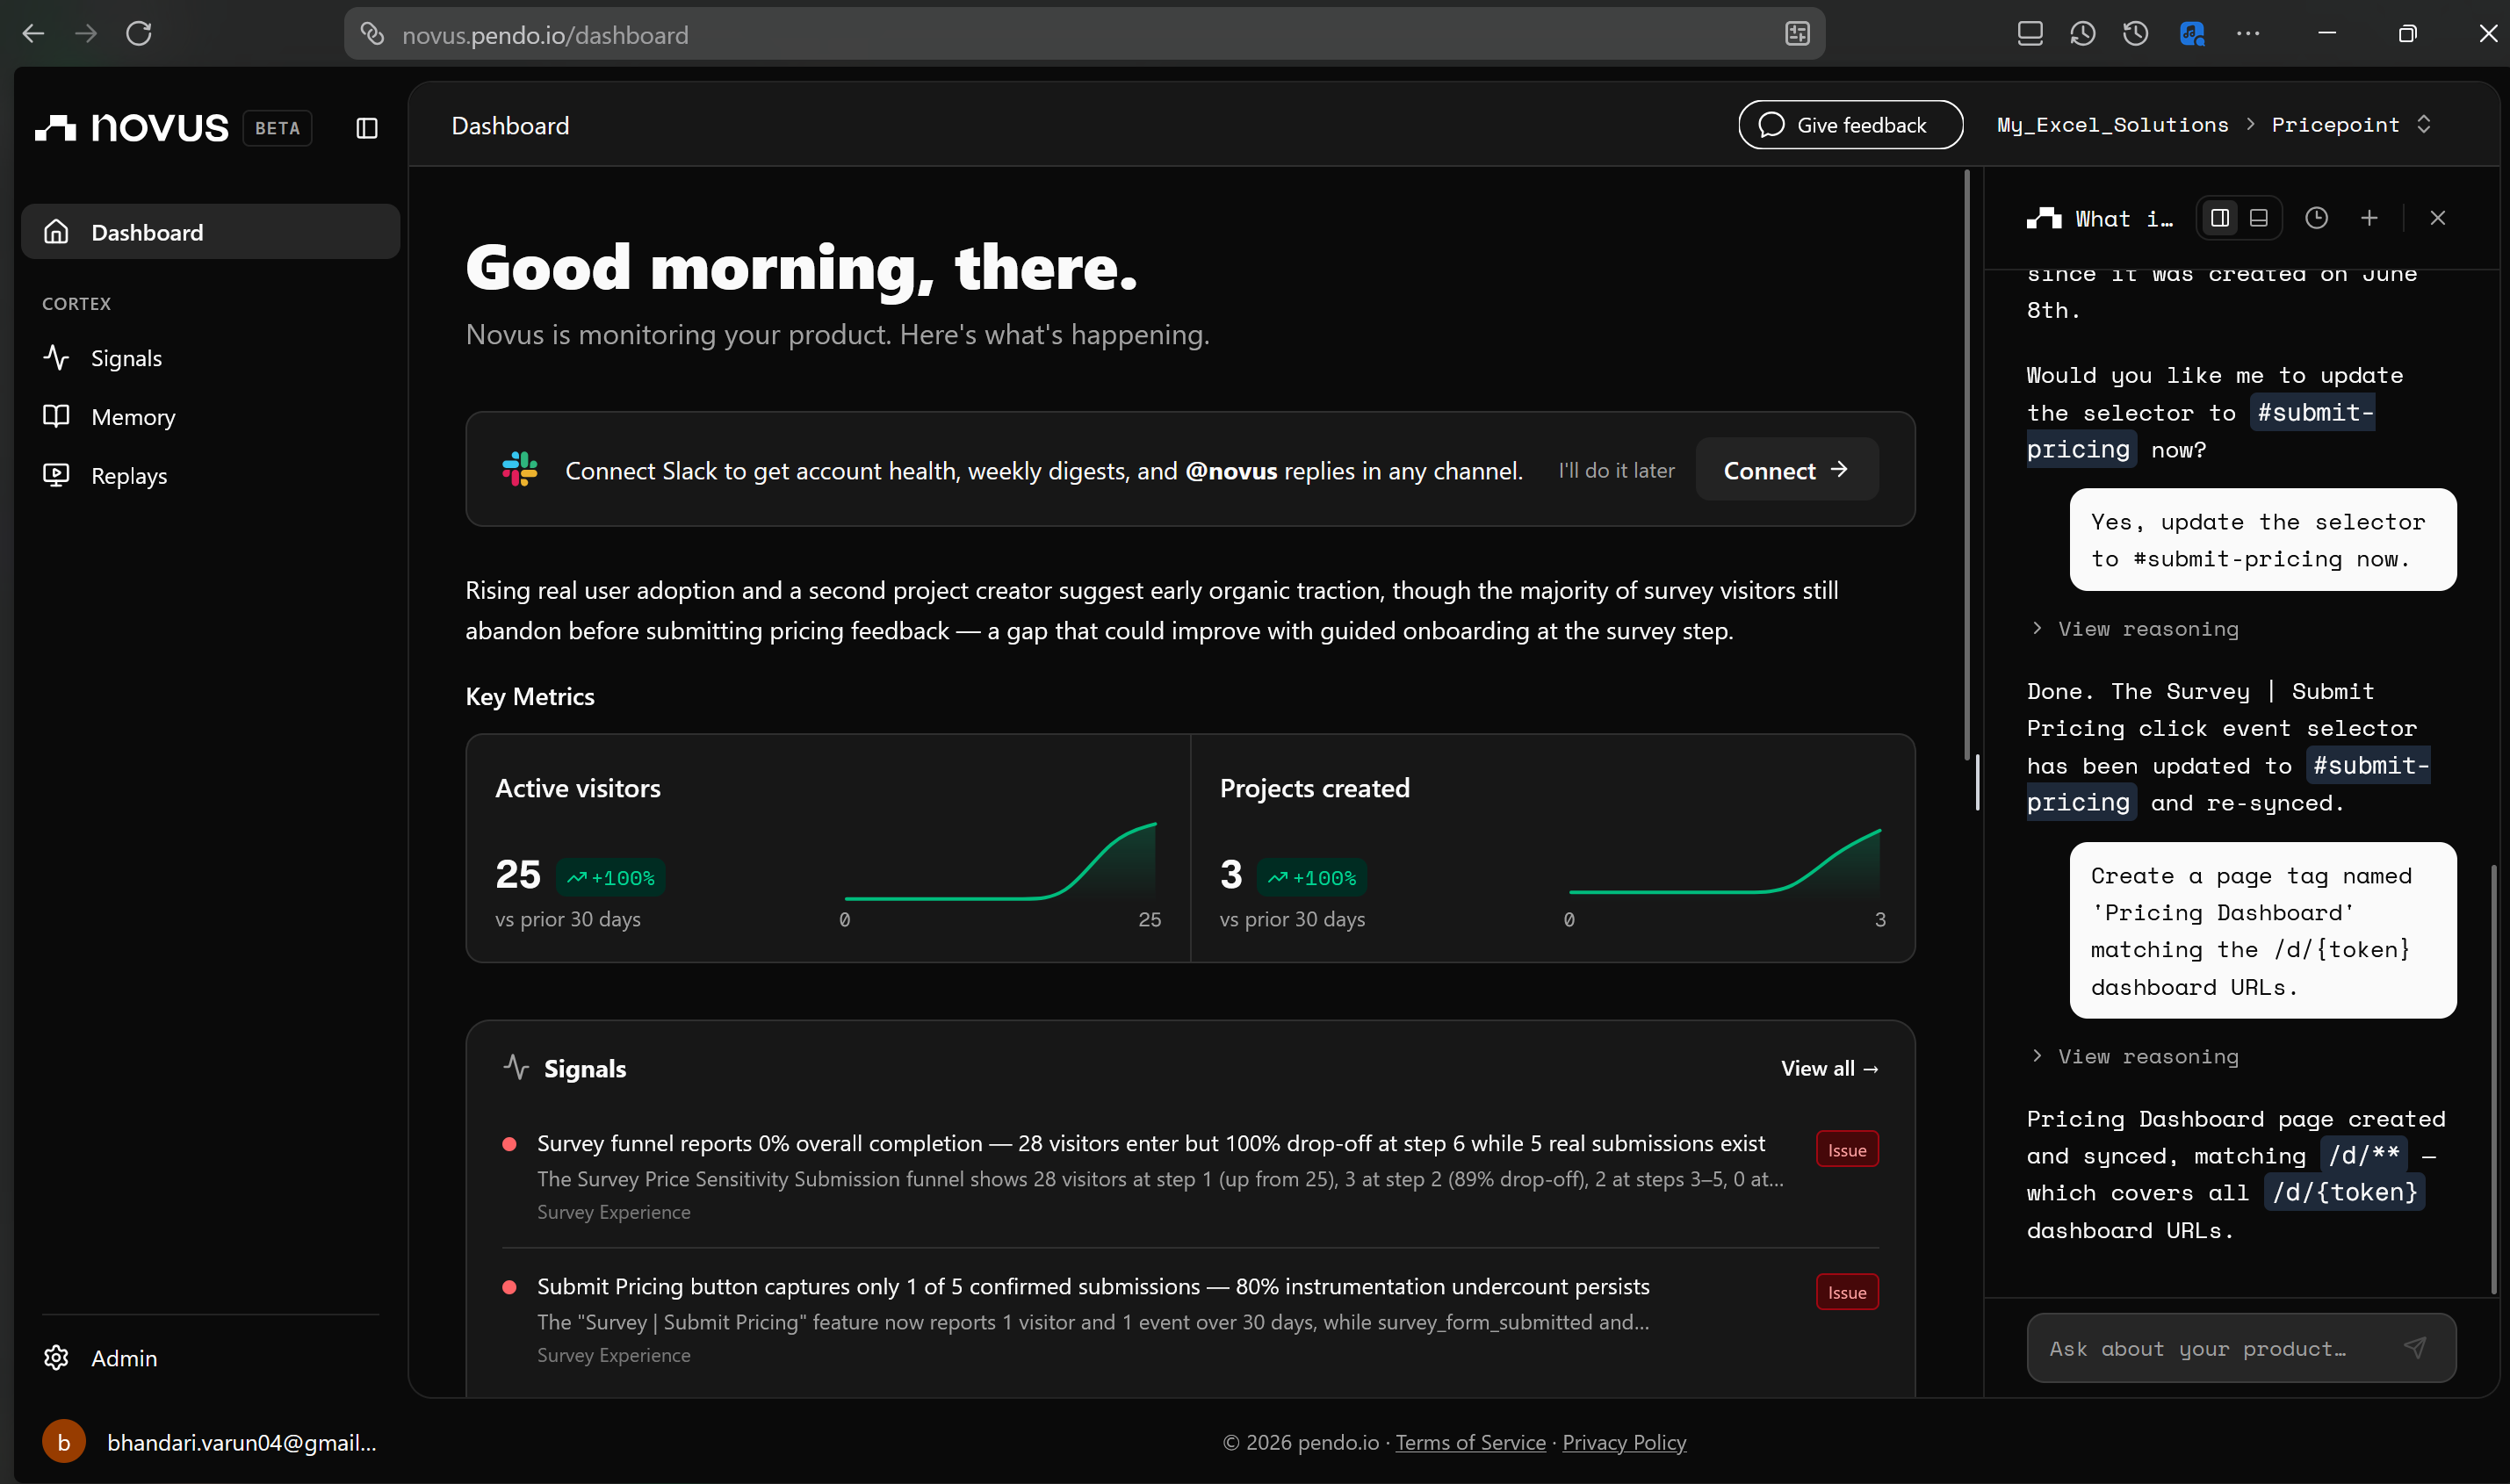
Instrumented with Novus from day one. It mapped the funnel, caught a broken submit-button selector, and re-synced the fix from this chat.
-
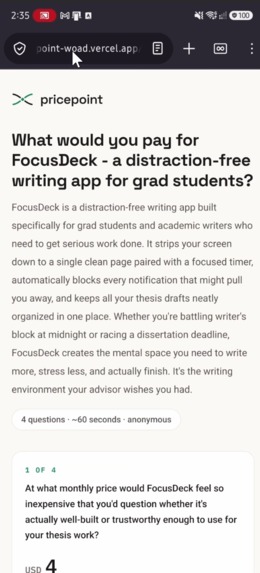
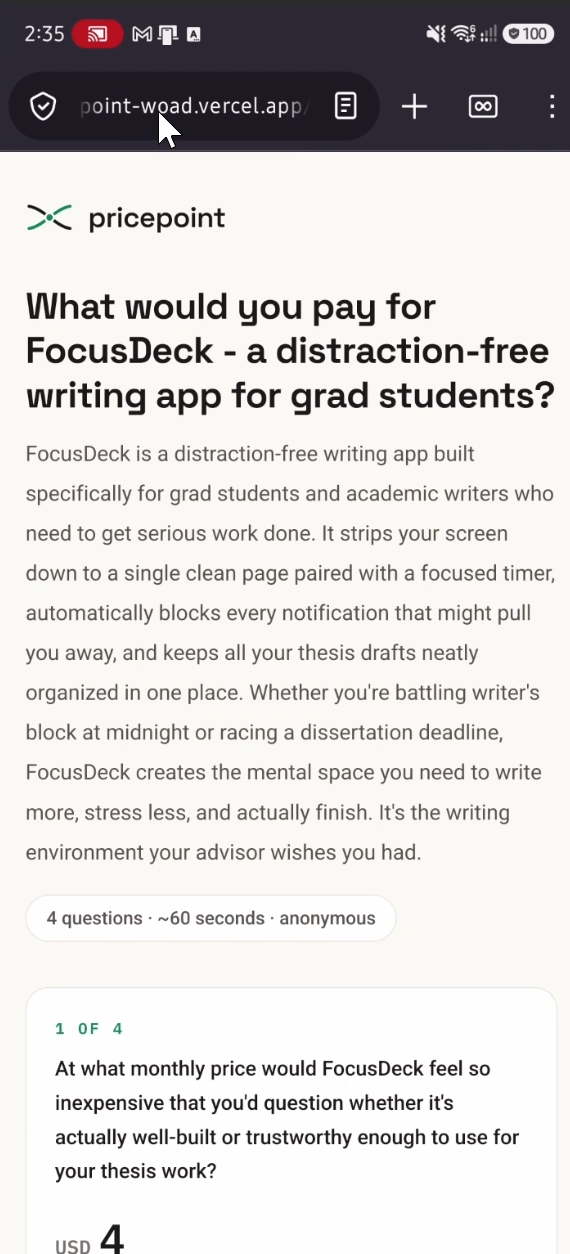
The mobile-first public survey. Four price questions plus one optional buy check, about 60 seconds, no account, no email.

Inspiration
Every indie maker I know prices their product the same way: copy a competitor, add a gut feeling, hope. The tools that exist either ask an AI to guess a number, or cost more than the product you're trying to price. But pricing research isn't actually hard. The Van Westendorp Price Sensitivity Meter has been doing it with four simple questions since the 1970s. It just never had a self-serve, share-a-link version. So I built one.
What it does
Pricepoint is for indie makers, solo founders, and PMs who need a defensible price, fast.
- Describe your product in one short form. Claude designs a Van Westendorp survey worded around your product, plus three pricing models worth considering.
- Share one link. Anyone can answer in about 60 seconds: four price questions and an optional "would you actually pay this?" question. No account, no email.
- Get your price. A live dashboard turns responses into four sensitivity curves, an optimal price point, an acceptable range, and a buy-rate at your anchor. It then generates a ready-to-paste three-tier pricing page anchored to the data.
There are no accounts anywhere. Creators get a private dashboard link and respondents stay anonymous. The landing page links to a live example dashboard with sample data, so you can see the full experience (curves, optimal price, pricing page) in one click.
How I built it
I designed and built this solo in under two weeks: wrote a full SRS first, then worked through eight planned phases from data model to design system. The architecture decisions were the work. Claude (via Claude Code) accelerated the implementation, and the Claude API powers survey generation and pricing-page writing as validated structured output, but every number on the dashboard comes from my own Van Westendorp engine: about 150 lines of pure NumPy, unit-tested against hand-computed datasets. The rest of the stack is Next.js 16 + Tailwind v4 + Recharts on Vercel, FastAPI + SQLAlchemy on Render, and Postgres on Neon.
Novus instruments everything: page flows, the survey funnel, session replays, and custom events like project_created and survey_response_submitted that tell me where the product actually works.
Challenges I ran into
- Sparse data has no answer. With few responses, Van Westendorp curves legitimately don't intersect. I had to make "no clean crossing yet" a designed state. Honest empty states beat fake numbers.
- Novus caught a bug I shipped. My survey funnel reported 0% completion despite confirmed submissions. Novus traced it to an unsupported
:contains()CSS selector in a feature tag, cross-referencing session replays against my actual source code, and we fixed it conversationally. My favorite moment of the hackathon: the analytics tool debugged itself. - LLMs guess; surveys measure. Keeping Claude in the right lane (wording questions, narrating results) while NumPy owns every number took deliberate architecture. The LLM is never in the hot path and never invents a price.
Accomplishments that I'm proud of
A stranger can land on the URL and get real value in under three minutes. Rate-limited, bot-filtered, mobile-first, with a documented design system, and a working end-to-end funnel I can prove in Novus.
What I learned
Instrumentation is product work, not plumbing. Half my backlog came from Novus signals rather than my own intuition, including a tracking bug I would never have found by clicking around. The other lesson is methodological: an LLM opinion and a measured answer feel similar in a demo but are worlds apart in a product, and drawing that line sharply is what makes this tool trustworthy.
What's next for Pricepoint
Revenue-optimal pricing via the Newton-Miller-Smith extension (the purchase-intent data is already collected), respondent segmentation, and shareable read-only result pages.
Built With
- anthropic-claude
- claude-code
- fastapi
- github-actions
- neon
- next.js
- novus.ai
- numpy
- postgresql
- python
- react
- recharts
- render
- sqlalchemy
- tailwindcss
- typescript
- vercel

Log in or sign up for Devpost to join the conversation.