-
-
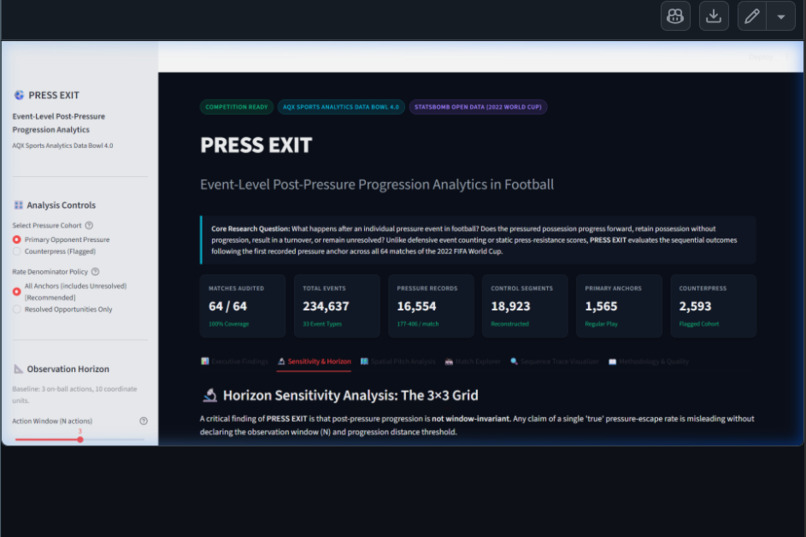
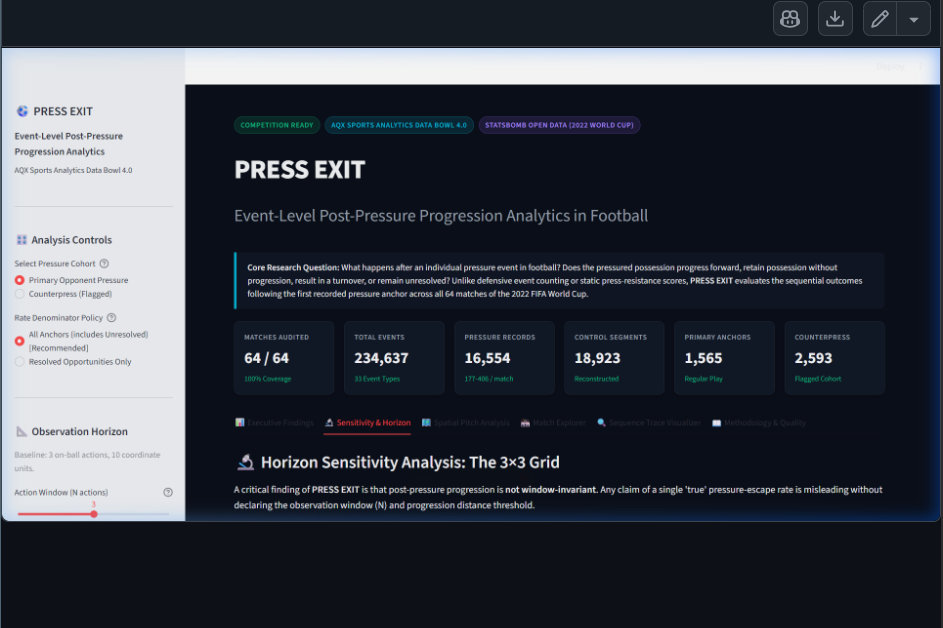
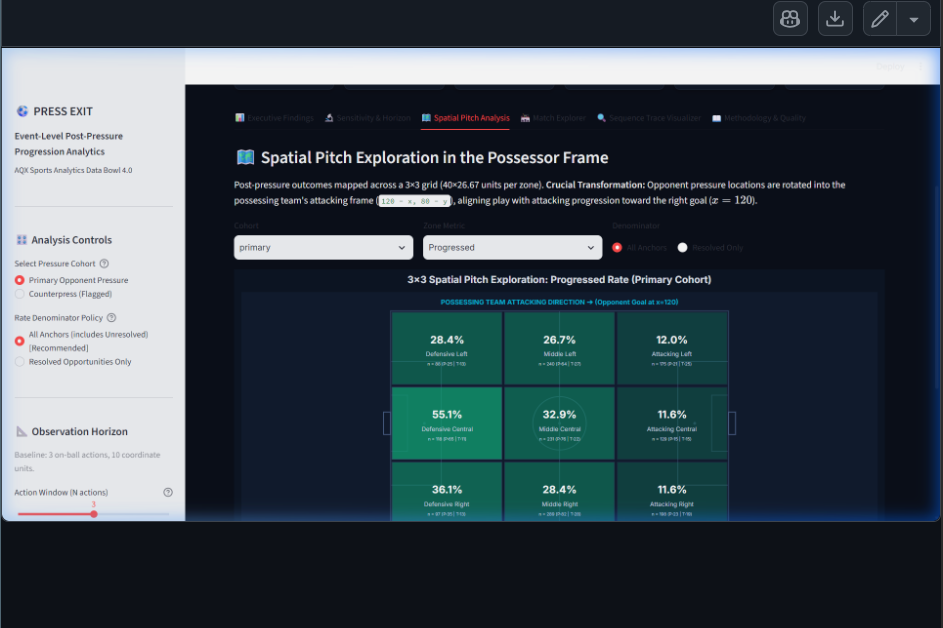
3×3 sensitivity analysis
-
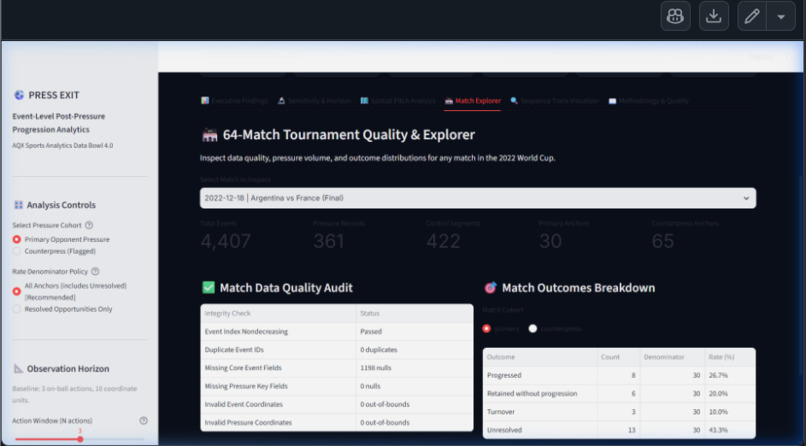
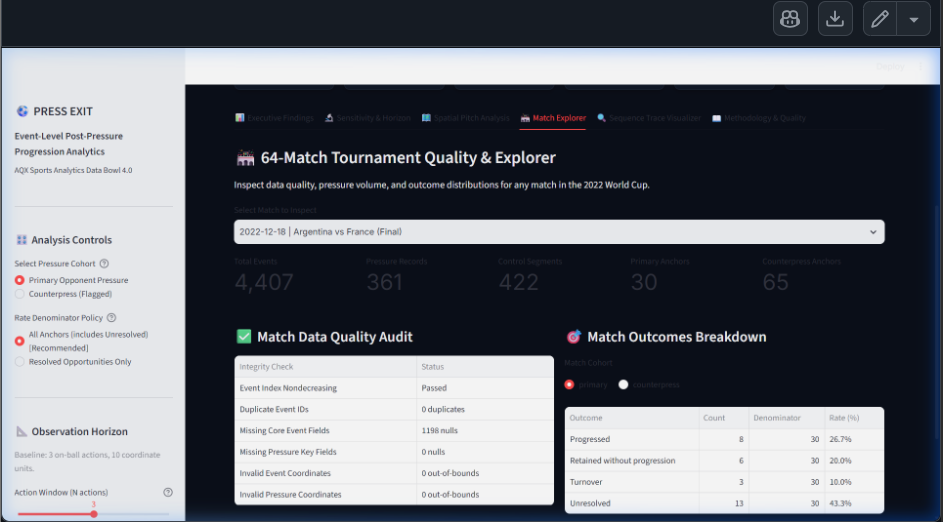
Match-level exploration and data quality
-
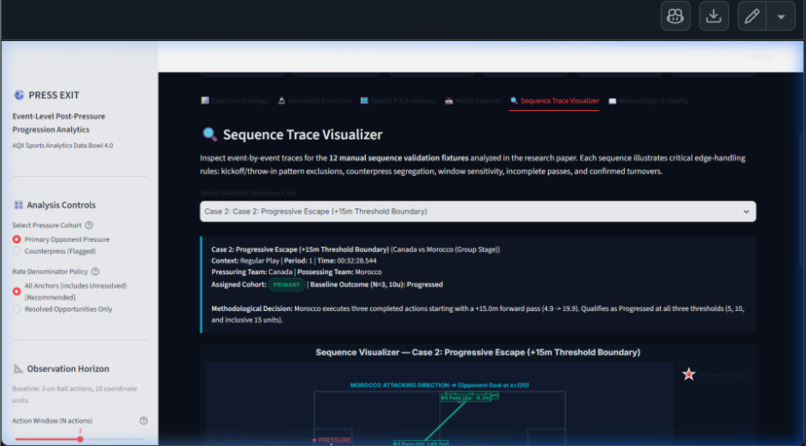
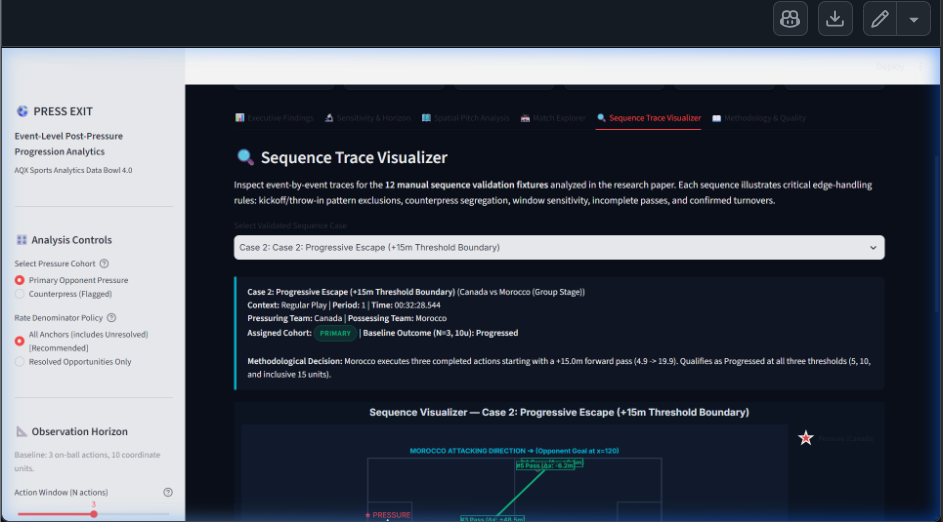
Individual pressure sequence visualization
-
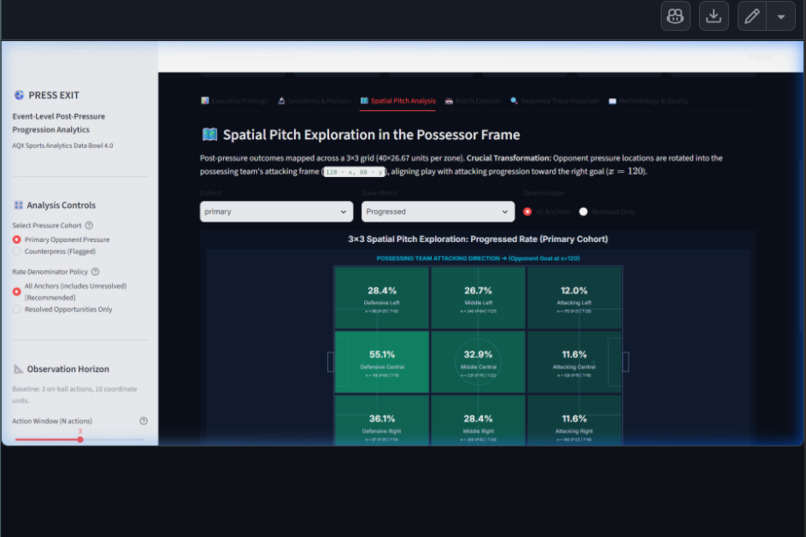
Spatial pressure analysis
-
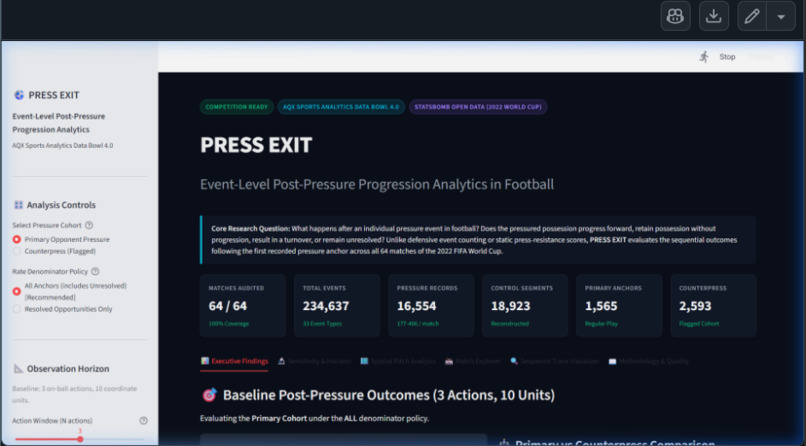
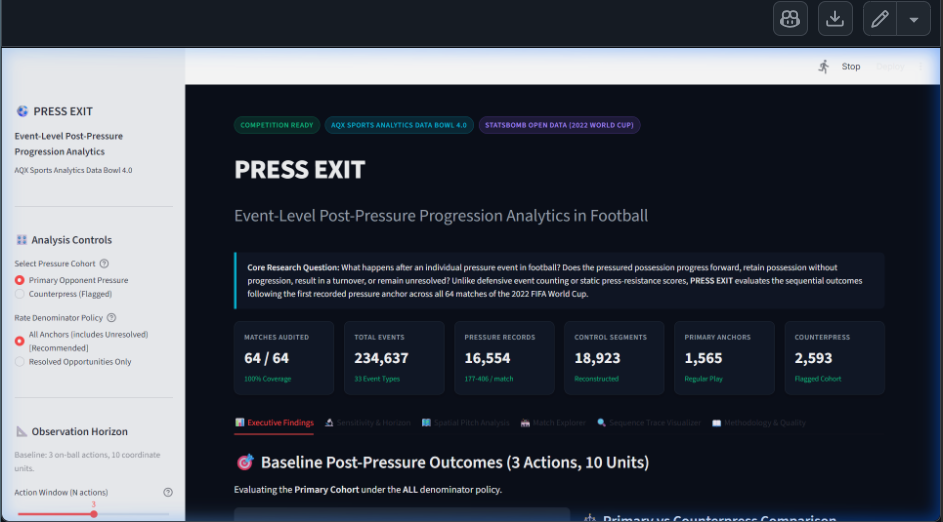
Tournament metrics and executive findings
Inspiration
In football, pressing is often discussed in terms of pressure, possession, and turnovers. But one important question deserves closer analysis: What actually happens after a player comes under pressure?
Does the team escape and progress the ball, retain possession without progressing, lose control, or produce an outcome that cannot be confidently determined?
This question inspired PRESS EXIT — an attempt to move beyond counting pressure events and investigate the sequences of play that follow them.
What it does
PRESS EXIT is an event-level football analytics application that analyzes what happens after recorded Pressure events using StatsBomb Open Data from the 2022 FIFA World Cup.
It classifies subsequent sequences into four outcomes:
- Progressed: The team advances the ball according to the defined progression criteria.
- Retained: The team maintains control without meeting the progression threshold.
- Turnover: The opposing team establishes confirmed control.
- Unresolved: The available event sequence does not provide enough evidence for a confident classification.
The analysis covers 64 matches, 234,637 events, and 16,554 recorded Pressure events.
It examines primary pressure anchors and counterpress anchors separately, with an interactive dashboard for exploring tournament-level findings, outcome distributions, spatial patterns, match-level results, and individual event sequences.
How we built it
We built PRESS EXIT using Python and Streamlit, with Pandas and NumPy for data processing, Plotly for interactive visualizations, and statistical methods for uncertainty and sensitivity analysis.
The implementation follows several stages:
- Process StatsBomb event data from the 2022 FIFA World Cup.
- Reconstruct provisional control sequences around recorded Pressure events.
- Identify primary and counterpress pressure anchors.
- Trace subsequent on-ball actions and classify their outcomes.
- Calculate aggregate statistics and match-level bootstrap intervals.
- Present the results through an interactive Streamlit dashboard.
The baseline analysis examines the next three on-ball actions using a 10-unit progression threshold. We also perform sensitivity analysis using action horizons of 2, 3, and 5 and progression thresholds of 5, 10, and 15 units.
Challenges we ran into
One of the biggest challenges was reconstructing possession and control from event-level data. A pressure event does not automatically tell us what happened next, and incomplete sequences make classification difficult.
We also had to account for:
- Different attacking directions and team-relative pitch coordinates.
- The distinction between a pressure player's location and the ball's location.
- Confirming opponent control before classifying a turnover.
- Avoiding incorrect progression classifications from incomplete passes or ambiguous events.
- Handling incomplete sequences without forcing them into misleading categories.
We addressed these challenges by using explicit classification rules, retaining unresolved outcomes, validating individual sequences, and testing alternative analytical parameters.
Accomplishments that we're proud of
- Analyzed all 64 matches of the 2022 FIFA World Cup dataset.
- Processed 234,637 events and identified 16,554 recorded Pressure events.
- Built separate primary and counterpress analytical cohorts.
- Implemented four explicit post-pressure outcome categories.
- Developed sensitivity analysis to examine how results change with different observation windows and progression thresholds.
- Created spatial pitch visualizations and individual sequence trace visualizations.
- Included 12 manually validated sequence examples.
- Built a six-section interactive dashboard.
- Achieved 51 passing automated tests and a clean Ruff lint check.
- Verified that the public repository can be cloned, installed in a fresh Python environment, and tested without the original development environment or raw event JSON files.
What we learned
We learned that meaningful sports analytics requires more than producing statistics and charts. The definitions, assumptions, and limitations behind every metric matter.
Working with event-level football data taught us about possession reconstruction, event sequencing, coordinate transformations, statistical uncertainty, and sensitivity analysis.
An important lesson was that unresolved outcomes should remain visible. Forcing uncertain sequences into definitive categories could create misleading conclusions.
We also learned to distinguish descriptive associations from causal explanations. Observing a higher turnover share in one cohort does not establish that the corresponding pressing approach caused those turnovers.
What's next for PRESS EXIT — Event-Level Post-Pressure Progression Analytics
There is room to extend PRESS EXIT beyond the current tournament analysis.
Potential future improvements include:
- Expanding the analysis to additional competitions and seasons.
- Exploring team-specific and match-context differences.
- Improving possession reconstruction and sequence validation.
- Adding more detailed player and team comparisons.
- Exploring additional statistical models while preserving transparent outcome definitions.
- Deploying the dashboard publicly so analysts and football enthusiasts can explore the findings directly.
Our goal is to make PRESS EXIT a useful analytical framework for understanding not just when pressure happens, but what follows it.


Log in or sign up for Devpost to join the conversation.