Inspiration
We wanted to make GIS easily available to everyone, even those without mapping or coding skills, by making it easy to visualise and use multiple data sources.
What it does
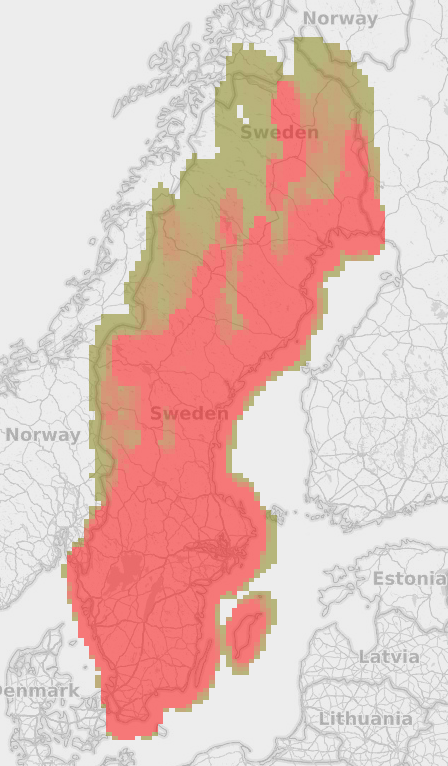
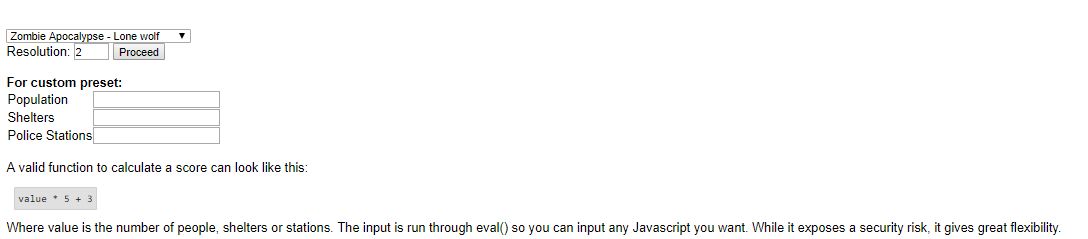
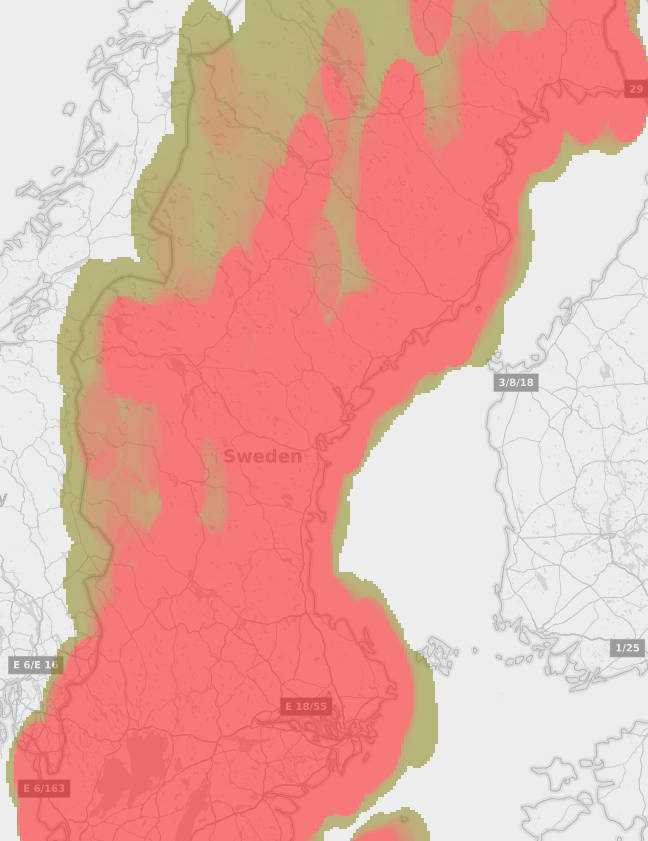
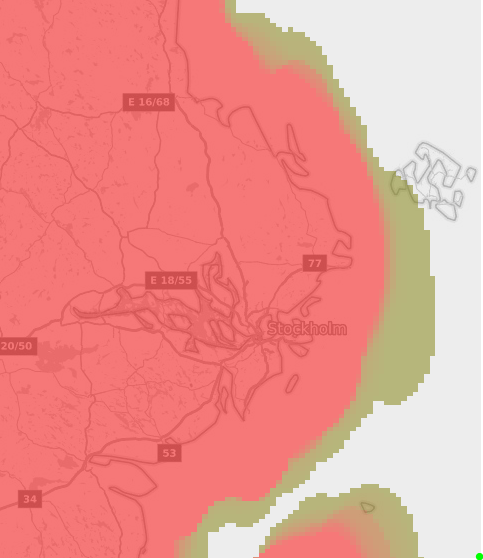
Prepmatic is a decision support tool for preppers planning to survive a possible zombie outbreak. With pre-prepared scenarios such as "Lone wolf" or "Networker" and open data such as population density and community functions like police and shelters, they can find a place that fits well for their taste, and plan a travel route to there. The system uses an assessment template to calculate the best places to be on or avoid and then visualizes this using a heat map overlay of sweden. If none of the presets fits the prepper, they can easily add custom weights and funtions to find the perfect place just for them.
How we built it
In Cloud9 with Javascript and HTML5 for frontend, and Node for processing data.
Challenges we ran into
Getting the data in a format that is easy to use for computing.
Accomplishments that we're proud of
Getting all the data together and reformatting it before processing it into a heatmap visualisation.
What we learned
A lot about GIS and converting map data between different formats and projections.
What's next for Prepmatic
More customisation options, and more data sources. Also the data processing will be made more efficient.
The video only has sound at the moment, we are working on it Seems to work now


Log in or sign up for Devpost to join the conversation.